OPEN-SOURCE SCRIPT
Mashrab | Momentum X-Ray
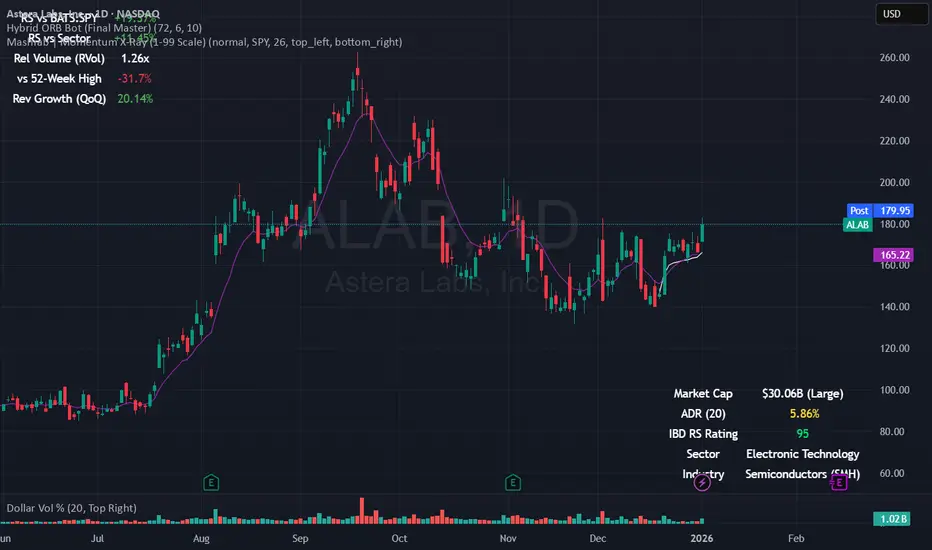
Stop guessing if a stock is a "Leader" or a "Laggard." The Mashrab Momentum X-Ray is a professional Heads-Up Display (HUD) that tells you the true strength of any stock in seconds.
Designed for serious swing traders and breakout specialists (similar to the styles of Qullamagie, Mark Minervini, and IBD), this tool ignores the noise and focuses on the only things that matter: Relative Strength, Volume Fuel, and Fundamental Health.
🚀 Key Features (What it does)
1. The "Smart" Relative Strength Engine
Most indicators blindly compare every stock to the S&P 500. This dashboard is smarter.
It automatically scans the stock’s Industry (e.g., Semiconductors, Gold Miners, Regional Banks).
It compares the stock’s performance against its specific peers (e.g., NVDA vs. SMH ETF) and the market benchmark (SPY).
Green Signal: The stock is beating both the market and its sector. This is a "True Leader."
2. IBD-Style RS Rating (1-99 Scale)
Get the "Secret Sauce" of institutional screening directly on your chart.
Calculates a weighted performance score: 40% (Last 3 Months) + 20% (6m, 9m, 12m).
The Scale:
90–99 (Lime Green): Elite Super-Stock.
80–89 (Green): Strong Leader / Breakout Candidate.
< 50 (Red): Laggard / Avoid.
3. Momentum "Fuel" Gauge (RVol)
Price moving up is good. Price moving up on massive volume is better.
The RVol (Relative Volume) row lights up Yellow or Purple when volume is 1.5x to 3x higher than normal. This detects "Institutional Buying" footprints.
4. "Blue Sky" Detector
Instantly see how close the price is to its 52-Week High.
Stocks within 5% of their highs (Green) have no "overhead supply" (bag holders) and can run the fastest.
👀 How to Read the Dashboard
Top Table (Tactical Momentum)
RS vs SPY / Sector: Look for DOUBLE GREEN. This means the stock is the "King of the Hill."
RVol: Look for > 1.5x (Yellow). This means big players are entering the trade.
Bottom Table (Strategic Context)
IBD RS Rating: Look for a score of 80 or higher.
ADR (20): Shows the "Average Daily Range" volatility. (e.g., 4.5% means the stock moves ~4.5% a day). Use this to size your position correctly!
Industry: Tells you exactly which ETF is being used for comparison (e.g., "Semiconductors (SMH)").
⚙️ Settings & Customization
Benchmark: Change the default SPY to QQQ (for Tech), IWM (for Small Caps), or BTCUSD (for Crypto) to fit your strategy.
Lookback: Defaults to 26 Bars (Standard Monthly Momentum), but fully adjustable.
Text Size: Make the tables larger or smaller to fit your screen.
"Trade the Leaders, Ignore the Laggards."
Designed for serious swing traders and breakout specialists (similar to the styles of Qullamagie, Mark Minervini, and IBD), this tool ignores the noise and focuses on the only things that matter: Relative Strength, Volume Fuel, and Fundamental Health.
🚀 Key Features (What it does)
1. The "Smart" Relative Strength Engine
Most indicators blindly compare every stock to the S&P 500. This dashboard is smarter.
It automatically scans the stock’s Industry (e.g., Semiconductors, Gold Miners, Regional Banks).
It compares the stock’s performance against its specific peers (e.g., NVDA vs. SMH ETF) and the market benchmark (SPY).
Green Signal: The stock is beating both the market and its sector. This is a "True Leader."
2. IBD-Style RS Rating (1-99 Scale)
Get the "Secret Sauce" of institutional screening directly on your chart.
Calculates a weighted performance score: 40% (Last 3 Months) + 20% (6m, 9m, 12m).
The Scale:
90–99 (Lime Green): Elite Super-Stock.
80–89 (Green): Strong Leader / Breakout Candidate.
< 50 (Red): Laggard / Avoid.
3. Momentum "Fuel" Gauge (RVol)
Price moving up is good. Price moving up on massive volume is better.
The RVol (Relative Volume) row lights up Yellow or Purple when volume is 1.5x to 3x higher than normal. This detects "Institutional Buying" footprints.
4. "Blue Sky" Detector
Instantly see how close the price is to its 52-Week High.
Stocks within 5% of their highs (Green) have no "overhead supply" (bag holders) and can run the fastest.
👀 How to Read the Dashboard
Top Table (Tactical Momentum)
RS vs SPY / Sector: Look for DOUBLE GREEN. This means the stock is the "King of the Hill."
RVol: Look for > 1.5x (Yellow). This means big players are entering the trade.
Bottom Table (Strategic Context)
IBD RS Rating: Look for a score of 80 or higher.
ADR (20): Shows the "Average Daily Range" volatility. (e.g., 4.5% means the stock moves ~4.5% a day). Use this to size your position correctly!
Industry: Tells you exactly which ETF is being used for comparison (e.g., "Semiconductors (SMH)").
⚙️ Settings & Customization
Benchmark: Change the default SPY to QQQ (for Tech), IWM (for Small Caps), or BTCUSD (for Crypto) to fit your strategy.
Lookback: Defaults to 26 Bars (Standard Monthly Momentum), but fully adjustable.
Text Size: Make the tables larger or smaller to fit your screen.
"Trade the Leaders, Ignore the Laggards."
Skrip open-source
Dengan semangat TradingView yang sesungguhnya, pembuat skrip ini telah menjadikannya sebagai sumber terbuka, sehingga para trader dapat meninjau dan memverifikasi fungsinya. Salut untuk penulisnya! Meskipun Anda dapat menggunakannya secara gratis, perlu diingat bahwa penerbitan ulang kode ini tunduk pada Tata Tertib kami.

Pernyataan Penyangkalan
Informasi dan publikasi ini tidak dimaksudkan, dan bukan merupakan, saran atau rekomendasi keuangan, investasi, trading, atau jenis lainnya yang diberikan atau didukung oleh TradingView. Baca selengkapnya di Ketentuan Penggunaan.
Skrip open-source
Dengan semangat TradingView yang sesungguhnya, pembuat skrip ini telah menjadikannya sebagai sumber terbuka, sehingga para trader dapat meninjau dan memverifikasi fungsinya. Salut untuk penulisnya! Meskipun Anda dapat menggunakannya secara gratis, perlu diingat bahwa penerbitan ulang kode ini tunduk pada Tata Tertib kami.
Pernyataan Penyangkalan
Informasi dan publikasi ini tidak dimaksudkan, dan bukan merupakan, saran atau rekomendasi keuangan, investasi, trading, atau jenis lainnya yang diberikan atau didukung oleh TradingView. Baca selengkapnya di Ketentuan Penggunaan.