Diupdate
DCA Helper
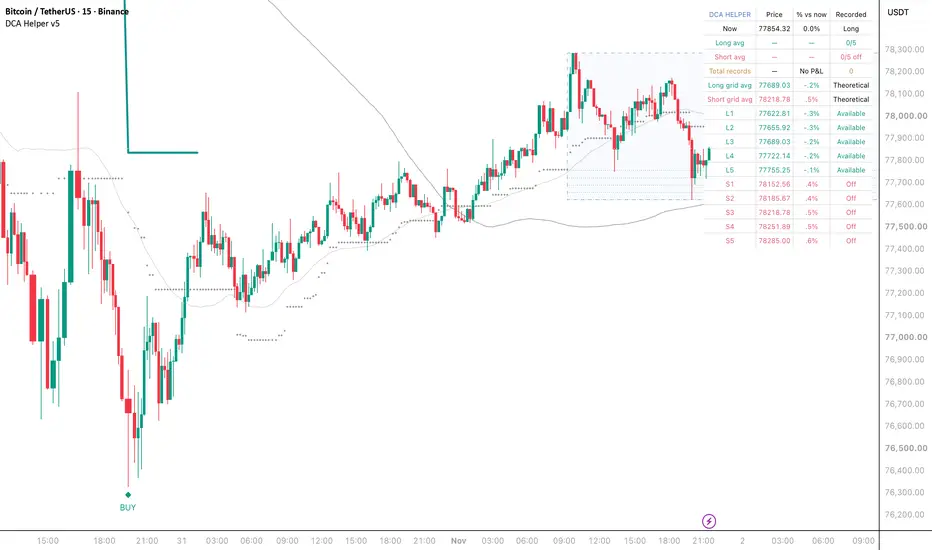
Disciplines your DCA strategy by splitting your buy zone into N pre-calculated levels. Triggers buy signals only when price touches a level within the discount zone.
How it works:
The indicator automatically divides the discount zone (bottom 20% of a 50-bar range) into N equal parts. Each part is a potential DCA entry (L1, L2, ..., LN). Signals fire ONLY when price touches a specific level — never in "no man's land" between levels.
Entry filters (all must pass):
Price below both MA(50) AND MA(200) → double trend confirmation
RSI(14) below 35 → oversold filter
Price within bottom 20% of range (discount zone)
Price sustained in discount for 3 consecutive bars (anti-spike)
20-bar cooldown between signals
Within 0.5% of a level (no in-between triggers)
Chart visualization:
🟩 Light green box = discount zone (where levels operate)
🟦 Blue dashed box = full high/low range (context)
➕ White dotted line = 50% equilibrium level
🟧 Orange line = average DCA price
🔷 Green "DCA" diamond below bar = each executed level
🟢➖🟢 Horizontal green lines = the N levels, labeled L1 price (% vs current), L2 ..., etc.
Level color: more intense the deeper (better price)
Info table (top-right):
Now: current price
Avg: current average + # buys/N
Complete: average if ALL N levels fill (ideal position avg)
L1, L2, ..., LN: each level price + % vs current, colored by risk:
🟢 Green = close (entry ready)
🟠 Orange = medium
🔴 Red = far below (better discount but more waiting)
Configurable inputs:
DCA levels (1-10) — number of staggered buys
Trigger proximity to level (%) — max distance for level trigger
Filter MA length (fast/slow)
RSI buy level
Range lookback
Discount threshold
Sustained bars
Min bars between signals
How to use for real DCA:
1.
Check the "Complete" row in the table → that's your avg if you split position across N levels
2.
Decide total size (e.g., $10k) and divide into N parts
3.
Set alerts on "DCA" diamonds for each level
4.
Buy the corresponding part when each level triggers
How it works:
The indicator automatically divides the discount zone (bottom 20% of a 50-bar range) into N equal parts. Each part is a potential DCA entry (L1, L2, ..., LN). Signals fire ONLY when price touches a specific level — never in "no man's land" between levels.
Entry filters (all must pass):
Price below both MA(50) AND MA(200) → double trend confirmation
RSI(14) below 35 → oversold filter
Price within bottom 20% of range (discount zone)
Price sustained in discount for 3 consecutive bars (anti-spike)
20-bar cooldown between signals
Within 0.5% of a level (no in-between triggers)
Chart visualization:
🟩 Light green box = discount zone (where levels operate)
🟦 Blue dashed box = full high/low range (context)
➕ White dotted line = 50% equilibrium level
🟧 Orange line = average DCA price
🔷 Green "DCA" diamond below bar = each executed level
🟢➖🟢 Horizontal green lines = the N levels, labeled L1 price (% vs current), L2 ..., etc.
Level color: more intense the deeper (better price)
Info table (top-right):
Now: current price
Avg: current average + # buys/N
Complete: average if ALL N levels fill (ideal position avg)
L1, L2, ..., LN: each level price + % vs current, colored by risk:
🟢 Green = close (entry ready)
🟠 Orange = medium
🔴 Red = far below (better discount but more waiting)
Configurable inputs:
DCA levels (1-10) — number of staggered buys
Trigger proximity to level (%) — max distance for level trigger
Filter MA length (fast/slow)
RSI buy level
Range lookback
Discount threshold
Sustained bars
Min bars between signals
How to use for real DCA:
1.
Check the "Complete" row in the table → that's your avg if you split position across N levels
2.
Decide total size (e.g., $10k) and divide into N parts
3.
Set alerts on "DCA" diamonds for each level
4.
Buy the corresponding part when each level triggers
Catatan Rilis
- Added strategy mode selector: Long / Long & Short / Short- Added separate Long and Short DCA levels (5 each by default, configurable 1-10)
- Each level fires only once per cycle (no more repeated buys at same level)
- Cycle auto-resets when price exits the discount/premium zone by a configurable threshold (default 60% of range)
- Added Short Avg, Long Avg, Net Pos and "Complete" avg prominently displayed in table and as chart lines
- Long and Short entry signals are independent: separate MA, RSI, sustained and proximity filters per side
- Inputs grouped: General, Trend, Momentum, Timing for easier tuning
- Level lines: solid (filled) vs dotted (pending) with check-mark on filled levels
Catatan Rilis
DCA HELPER — A RANGE-BASED STAGING WORKSPACEDCA Helper divides the discount and premium portions of a rolling price range into a configurable grid. It marks qualified closes near available grid levels and maintains separate long and short cycle records.
This is an indicator, not an order execution system or backtest. Its averages describe recorded signal closes with equal weight. It does not model capital, position size, brokerage fills, exits, fees or returns.
01 / THE REFERENCE GRID
The range uses the highest high and lowest low of the selected lookback, including the current bar. Defaults are 50 bars, discount at the bottom 20% and premium at the top 20% of that range. Equilibrium marks the midpoint.
The default five long levels span range low to discount top, including both boundaries. Five short levels span premium bottom to range high. With one level, the long reference is range low and the short reference is premium bottom. Levels are recalculated as the rolling range changes; they are not fixed limit orders placed at the beginning of a cycle.
“Discount” and “premium” describe relative range location. They do not establish fundamental value or predict a reversal.
02 / WHEN A MARKER QUALIFIES
- Long: the close is strictly below both simple moving averages, RSI is strictly below the buy threshold, and the close has remained in discount for the required consecutive bars.
- Short: the close is strictly above both simple moving averages, RSI is strictly above the sell threshold, and the close has remained in premium for the required consecutive bars.
- The nearest unrecorded level on the enabled side must be within the configured proximity. The test is absolute distance from the close divided by the close, strictly less than the percentage setting. A wick touching a level is not sufficient by itself.
- The side-specific cooldown must have elapsed. A level already recorded in that cycle is excluded from subsequent candidate selection.
Defaults: SMA 50 and SMA 200, RSI 14 with thresholds 35/65, three consecutive bars in zone, 0.5% proximity and 20 bars between same-side signals. Long is the initial mode; Long & Short and Short are available. Buy and sell cooldowns are independent and use “at least” the configured bar count.
The zone streak is measured on closes and resets when a close leaves its zone. Conditions are evaluated on the developing bar; there is no built-in bar-close confirmation switch. Intrabar markers can change before the candle closes. Evaluate closed candles when comparing historical examples.
03 / WHAT THE CYCLE RECORDS MEAN
Each qualifying event records that candle's close and marks the chosen grid index as used. Long Avg and Short Avg are arithmetic means of recorded closes, not volume-weighted or account-cost averages. Changing the chart or inputs recalculates the historical sequence.
The grid continues to move while those used-index flags remain in place. A “Recorded” badge means that index generated an event during the current cycle; its currently displayed price can differ from the price at that event. Solid versus dotted grid lines show recorded versus available indices.
The long cycle resets when the close is outside discount and its position in the range is strictly above the reset threshold, provided a long record exists. The short cycle resets when the close is outside premium and its position is strictly below that same threshold, provided a short record exists. The default threshold is 60%. These are record resets, not position-closing transactions. They do not reset the last-signal cooldown timestamps.
04 / READING THE NEW DASHBOARD
- Now: current close and selected mode.
- Long avg / Short avg: recorded-close average, percentage distance from the current close and number of records on that side.
- Total records: sum of both side counts. This is not net exposure.
- Long grid avg / Short grid avg: equal-weight theoretical average of every current grid level. It is not a completed trade or a forecast.
- L1–LN and S1–SN: current level price, percentage distance and Available, Recorded or Off state.
The compact four-column panel supports all four chart corners and follows the chart theme. Teal identifies long references, rose identifies short references, blue identifies the range and amber highlights recorded slots. Optional level badges are off initially to reduce overlapping text. Signal markers can be hidden without disabling cycle calculations.
05 / A PRACTICAL REVIEW SEQUENCE
Choose the direction and chart interval first. Inspect the rolling range before increasing the number of levels: a narrow zone can place several references very close together. Then check whether the SMA, RSI and zone-streak conditions agree with the intended context. Review recorded closes and resets over several market conditions rather than treating an attractive average as evidence of profitability.
The indicator contains no dedicated alertcondition definitions. A platform alert based on an available plot is not equivalent to a dedicated BUY/SELL event alert. Risk limits, allocation and execution require a separate process.
06 / THIS UPDATE
Nearest-level prices, indices and distances now reset on every bar. Previously they persisted between bars, which could retain a stale candidate or a level already marked used. Single-level grids now participate in candidate selection; the previous loop excluded that setting. The single short-level theoretical average now matches its actual premium-bottom reference. These fixes can change historical markers and cycle averages relative to the previous version.
The qualification thresholds, streak rules, signal-close averaging and reset formulas are preserved. Presentation changes include configurable accents, smaller event markers, optional price badges, a readable vertical dashboard and labels that distinguish cycle records from theoretical grid averages. Redundant accumulating boundary labels have been removed.

Pernyataan Penyangkalan
Informasi dan publikasi ini tidak dimaksudkan, dan bukan merupakan, saran atau rekomendasi keuangan, investasi, trading, atau jenis lainnya yang diberikan atau didukung oleh TradingView. Baca selengkapnya di Ketentuan Penggunaan.
Pernyataan Penyangkalan
Informasi dan publikasi ini tidak dimaksudkan, dan bukan merupakan, saran atau rekomendasi keuangan, investasi, trading, atau jenis lainnya yang diberikan atau didukung oleh TradingView. Baca selengkapnya di Ketentuan Penggunaan.