US500 Expected Session Range
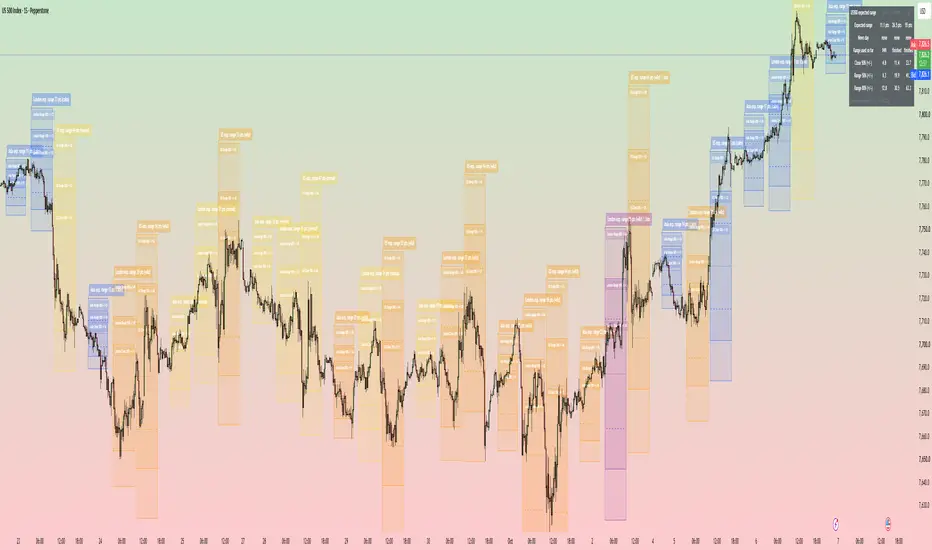
US500 Session Expected Range (Asia / London / US)
Draws forecast boxes for the Asia, London and US trading sessions showing how far price is likely to travel. It does not predict direction. It only tells you how big the session is likely to be.
HOW IT WORKS
Thirty minutes after each session opens, the script forecasts the range (high minus low) for the rest of the session from four things:
1. The average range of the last 14 sessions of the same type.
2. The range of the previous session.
3. The range of the 6 hours before the open.
4. The range of the first 30 minutes.
Each session has its own fitted weights. On news days the forecast is scaled up: FOMC x1.7 (US session), CPI x1.8 and jobs report x1.6 (London session, where the 08:30 ET release lands). No news effect was found in Asia.
Sessions: Asia = Tokyo 09:00-15:00, London = 03:00-09:30 New York, US = 09:30-16:00 New York. Each one can be switched on or off.
FOUR OPTIONAL BOXES (same sizes for every session)
Centred on the price 30 minutes after the open and drawn to the end of the session.
- Range 50% (solid): price stayed inside it for the whole rest of the session on about 50% of days.
- Range 80% (solid, larger): about 80% of days.
- Close 50% (dashed): only the session close landed inside it, about 50% of days.
- Close 80% (dashed, off by default): same, about 80% of days.
Range boxes cover every tick. Close boxes only cover where the session ends, so they are tighter. Pick whichever matches how you trade.
Colour shows the mood: blue = calm, yellow = normal, orange = wild, purple = news day.
HOW OFTEN THE BOXES HELD
Tested on US500 1-minute data, Jan 2023 to Sep 2026, about 860 to 950 sessions per session type. Each year was forecast using weights fitted on the other years (leave-one-year-out).
Asia (862 sessions): Range 50% 51% | Range 80% 82% | Close 50% 51% | Close 80% 80%
London (954): 50% | 80% | 53% | 81%
US (917): 51% | 80% | 48% | 80%
Single years moved around: the 50% boxes ranged from about 41% to 61%, the 80% boxes from about 73% to 87%. Half of all sessions land within about -25% / +28% of the forecast.
HOW IT COMPARES WITH ATR
Share of the session-to-session variation in range that is explained (higher is better), against ATR(14) on the 1-hour chart, with ATR given its own best scaling:
- Asia: 50% vs 37% (ATR 15m: 42%). Closer than ATR in about 58% of sessions. Clear win.
- London: 45% vs 36%. Level once ATR also gets the same CPI/jobs multipliers (44%).
- US: 40% vs 38%. A properly scaled ATR with the FOMC multiplier is slightly ahead (42%).
So outside Asia this is not a more accurate forecast than a well-scaled ATR. What it adds is ready-made boxes with measured hit rates, news handling and all three sessions in one tool.
LIMITS
- No direction, no entry signals. Half of all sessions break the 50% boxes by design.
- Fitted on a US500 CFD feed. Futures and other markets are untested.
- Weights were fitted on the same period shown above. Expect live results to be a little worse.
- Pine cannot read the economic calendar, so news dates are typed in (to Dec 2026). Update them in settings.
USE
- Chart: 1m to 30m. Needs about 15 sessions of history loaded.
- Table: expected range, news flag and how much of the range is used so far, one column per session.
- Settings: toggle each session, each box and the tags. Weights, box sizes and news dates are editable.
For information only. Not financial advice.
Draws forecast boxes for the Asia, London and US trading sessions showing how far price is likely to travel. It does not predict direction. It only tells you how big the session is likely to be.
HOW IT WORKS
Thirty minutes after each session opens, the script forecasts the range (high minus low) for the rest of the session from four things:
1. The average range of the last 14 sessions of the same type.
2. The range of the previous session.
3. The range of the 6 hours before the open.
4. The range of the first 30 minutes.
Each session has its own fitted weights. On news days the forecast is scaled up: FOMC x1.7 (US session), CPI x1.8 and jobs report x1.6 (London session, where the 08:30 ET release lands). No news effect was found in Asia.
Sessions: Asia = Tokyo 09:00-15:00, London = 03:00-09:30 New York, US = 09:30-16:00 New York. Each one can be switched on or off.
FOUR OPTIONAL BOXES (same sizes for every session)
Centred on the price 30 minutes after the open and drawn to the end of the session.
- Range 50% (solid): price stayed inside it for the whole rest of the session on about 50% of days.
- Range 80% (solid, larger): about 80% of days.
- Close 50% (dashed): only the session close landed inside it, about 50% of days.
- Close 80% (dashed, off by default): same, about 80% of days.
Range boxes cover every tick. Close boxes only cover where the session ends, so they are tighter. Pick whichever matches how you trade.
Colour shows the mood: blue = calm, yellow = normal, orange = wild, purple = news day.
HOW OFTEN THE BOXES HELD
Tested on US500 1-minute data, Jan 2023 to Sep 2026, about 860 to 950 sessions per session type. Each year was forecast using weights fitted on the other years (leave-one-year-out).
Asia (862 sessions): Range 50% 51% | Range 80% 82% | Close 50% 51% | Close 80% 80%
London (954): 50% | 80% | 53% | 81%
US (917): 51% | 80% | 48% | 80%
Single years moved around: the 50% boxes ranged from about 41% to 61%, the 80% boxes from about 73% to 87%. Half of all sessions land within about -25% / +28% of the forecast.
HOW IT COMPARES WITH ATR
Share of the session-to-session variation in range that is explained (higher is better), against ATR(14) on the 1-hour chart, with ATR given its own best scaling:
- Asia: 50% vs 37% (ATR 15m: 42%). Closer than ATR in about 58% of sessions. Clear win.
- London: 45% vs 36%. Level once ATR also gets the same CPI/jobs multipliers (44%).
- US: 40% vs 38%. A properly scaled ATR with the FOMC multiplier is slightly ahead (42%).
So outside Asia this is not a more accurate forecast than a well-scaled ATR. What it adds is ready-made boxes with measured hit rates, news handling and all three sessions in one tool.
LIMITS
- No direction, no entry signals. Half of all sessions break the 50% boxes by design.
- Fitted on a US500 CFD feed. Futures and other markets are untested.
- Weights were fitted on the same period shown above. Expect live results to be a little worse.
- Pine cannot read the economic calendar, so news dates are typed in (to Dec 2026). Update them in settings.
USE
- Chart: 1m to 30m. Needs about 15 sessions of history loaded.
- Table: expected range, news flag and how much of the range is used so far, one column per session.
- Settings: toggle each session, each box and the tags. Weights, box sizes and news dates are editable.
For information only. Not financial advice.

Pernyataan Penyangkalan
Informasi dan publikasi ini tidak dimaksudkan, dan bukan merupakan, saran atau rekomendasi keuangan, investasi, trading, atau jenis lainnya yang diberikan atau didukung oleh TradingView. Baca selengkapnya di Ketentuan Penggunaan.
Pernyataan Penyangkalan
Informasi dan publikasi ini tidak dimaksudkan, dan bukan merupakan, saran atau rekomendasi keuangan, investasi, trading, atau jenis lainnya yang diberikan atau didukung oleh TradingView. Baca selengkapnya di Ketentuan Penggunaan.