Eye Volume Balloons [EyeAlgo]
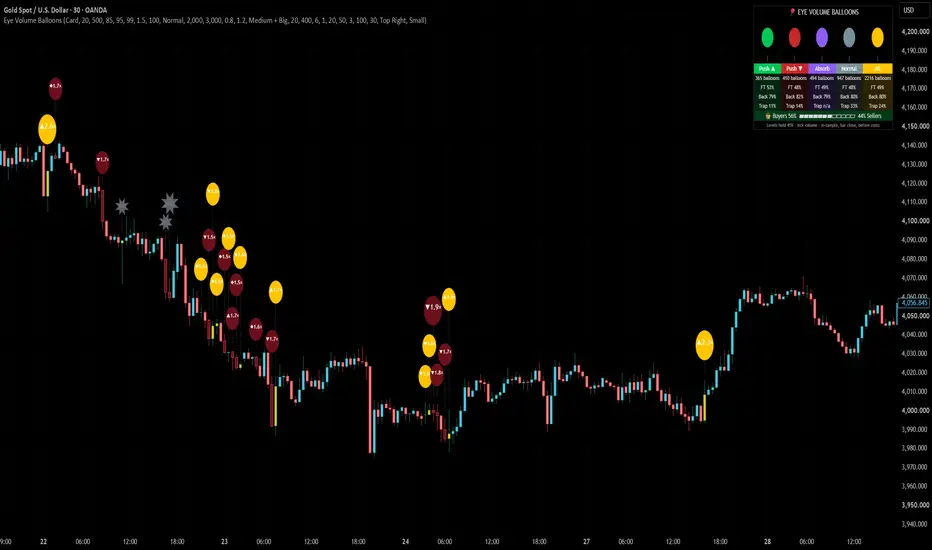
Eye Volume Balloons turns every unusual volume bar into a balloon that floats above the candle. The bigger the volume, the bigger the balloon and the higher it floats, so you can read where the market really traded at a glance, and the indicator keeps score of what happened after every balloon.

🟢 OVERVIEW
Most volume bubble tools only answer one question: "was this bar's volume big?" A big bar on its own tells you little. What you really want to know is what that volume did next. Eye Volume Balloons answers three questions on your own chart:
▶ Where did unusual volume trade, and was it buyers or sellers?
▶ Did that volume push price, or was it absorbed with almost no move?
▶ After a balloon like this, how often did price follow through, come back to it, or trap the traders who chased it?
🟢 WHAT MAKES IT ORIGINAL
▶ Time-of-day volume baseline. On intraday charts each bar is compared with the normal volume of the same clock time over recent days, not with a flat moving average. Session opens no longer fill the chart with false balloons, and a quiet-hour spike stands out.
▶ Self-ranking sizes. Balloon size comes from the percentile rank of that volume ratio over recent bars, so the same settings adapt to gold, forex, indices, crypto or stocks.
▶ Four balloon types: Push ▲, Push ▼, Absorb and Normal, based on how far price actually moved for the volume spent.
▶ Volume-centre levels. Medium and big balloons leave a level at the bar's volume-weighted price (from lower-timeframe bars), with a visible life cycle: Fresh, Held ×n, Flipped, then removed.
▶ Balloon pop. When a balloon turns into a trap, it pops on the chart (✸ pop), so failed volume is easy to see.
▶ A built-in scorecard that tracks every balloon: follow-through rate, return-to-balloon rate, average bars to return and trap rate, split by balloon type.
All calculations are our own, written from scratch for this script.
🟢 HOW IT WORKS
1. Normal volume
For each bar the script keeps a running average of volume for that exact clock time (default memory 20 days). The volume ratio = this bar's volume ÷ normal volume for that time. On daily and higher charts, or when the option is off, a flat 50-bar average is used instead.
2. Balloon size
The ratio is ranked against the last 500 bars. Percentile 85+ = small balloon, 95+ = medium, 99+ = big, and the ratio must also be at least 1.5× normal. Balloons are drawn only when the bar closes.
3. Buyers vs sellers and volume centre
The script reads lower-timeframe bars inside each candle (timeframe chosen automatically). Volume of up bars counts as buying, down bars as selling, and the volume-weighted price of those bars is the balloon's volume centre. Where intrabar history is not available, the split is estimated from the candle's close position, and the Table dashboard shows how often the split was exact.
4. Balloon type
Bar range is measured in ATR(14).
• Push ▲: range at least 1.2 ATR, close in the top third, buyers at least half.
• Push ▼: the mirror for sellers.
• Absorb: range at most 0.8 ATR. Big volume, small move.
• Normal: everything else.
5. Tracking and levels
Every balloon is followed on closed bars:
• Follow-through: price moves 1 ATR in the balloon's direction before 1 ATR against it, within 20 bars (the adverse side is checked first, so it is a strict count).
• Came back: price first leaves the volume centre by 0.5 ATR, then trades back to it within 50 bars.
• Trap: within 3 bars price closes beyond the opposite end of the balloon bar. The balloon pops.
Medium and big balloons also draw a level at the volume centre. A clean touch counts as Held. A close through the level flips it to the other side. A second break, or 400 bars of age, removes it.
🟢 READING THE CHART
▶ Balloon colour = candle direction + volume level. Green candles use light blue / green / gold, red candles use light red / dark red / maroon, for below Level 2, Level 2+ and Level 3+ volume.
▶ Balloon height = volume ratio. The higher it floats, the more unusual the volume. Balloons close together float at different heights so they do not cover each other.
▶ Text inside: ▲ buyers stronger, ▼ sellers stronger, ◆ absorb, then the ratio (for example ▼1.9×).
▶ Candles are coloured by the same volume levels, so balloon bars stand out from the rest.
▶ Level tags on the right show the price and state, for example "4033.810 · Held ×2".

🟢 WHAT OUR CHART SHOWED
Scorecard on OANDA:XAUUSD 30m with default settings, over the history loaded on our chart (snapshot 1 Nov 2026). In-sample, before spread and commission, not a performance expectation:
• Push ▲: 365 balloons · follow-through 53% · came back 79% · trap 11%
• Push ▼: 410 balloons · follow-through 48% · came back 82% · trap 14%
• Absorb: 494 balloons · follow-through 49% · came back 79%
• Normal: 947 balloons · follow-through 48% · came back 80% · trap 33%
• All: 2216 balloons · follow-through 49% · came back 80% · trap 24%
• Balloon level touches held: 45%
What we take from this: on this chart a balloon on its own was close to a coin flip for direction, but price came back to the balloon's volume centre about 4 times out of 5. Push balloons were trapped far less often than Normal ones. Your numbers will differ on every symbol and timeframe, which is exactly why the scorecard is built in.
🟢 HOW TO USE
1. Add it to your chart and let it load the full history so the scorecard has enough balloons.
2. Read the scorecard first. It tells you how balloons behaved on this symbol and timeframe.
3. Treat balloon volume centres and Held levels as areas to watch for a reaction, not as signals on their own.
4. Absorb balloons at the end of a move show effort without result. Watch for a reversal confirmation.
5. Push balloons that are not trapped in the next few bars show the move was accepted.
6. A popped balloon (✸) marks volume that failed. The opposite side often gets the next move.
7. Use the Buyers / Sellers pressure gauge to see who controlled the recent balloons.
🟢 HOW TO CHANGE SETTINGS
1. Open the indicator settings (double-click its name on the chart).
2. Change the inputs in the group you need.
3. Click OK and check the scorecard again.
Quick guide:
• Too many balloons: raise "Small balloon from percentile", turn off "Show small balloons" or raise "Minimum volume ratio (x normal)".
• Balloon colours: set "Level 2 from volume" and "Level 3 from volume" to the volume your instrument normally trades per bar. The defaults (2,000 and 3,000) are only a starting point.
• Stricter follow-through: raise "Follow-through target (x ATR)".
• Fewer levels: set "Levels from" to "Big only" or lower "Levels kept on chart".
• Dashboard: choose Card, HUD, Table or Off in "Dashboard style".
Test the parameters and timeframe on your own instrument before relying on them.
🟢 SETTINGS
• 📊 Dashboard: Dashboard style (Card / HUD / Table / Off), HUD distance, scorecard position and text size.
• 🎈 Balloons: time-of-day baseline and memory, percentile window, small / medium / big percentiles, minimum ratio, balloons kept, show small balloons, ratio text, balloon size, string colour, pop on trap.
• 🎨 Balloon Colours (by volume): Level 2 and Level 3 volume, three colours for green candles and three for red candles.
• 🧭 Balloon Types: Absorb maximum range, Push minimum range (both in ATR), lower-timeframe buy/sell split.
• 📏 Balloon Levels: show levels, levels from Medium + Big or Big only, levels kept, remove after N bars, hide levels farther than N ATR.
• 📊 Tracking: follow-through target and window, return window, trap check bars, pressure gauge window.
• 🎨 Colours & Dashboard: buyers, sellers and absorb colours, colour candles by volume level.
🟢 ALERTS
• Big balloon
• Push ▲ balloon
• Push ▼ balloon
• Absorb balloon
• Balloon trap
• Balloon level broken
All alerts fire on bar close. There is also a detailed "Any alert() function call" alert for every medium and big balloon, for example: Eye Volume Balloons | XAUUSD 30 | Push ▲ BIG balloon | 3.4× normal | buy 64% | centre 4033.810
🟢 IMPORTANT NOTES & LIMITATIONS
• Forex, gold and CFD symbols usually have tick volume, not real traded volume. The dashboard shows which type your symbol uses. Symbols with no volume data will not show balloons.
• The buyer / seller split is an estimate from lower-timeframe bars, not real bid / ask or footprint data. Lower-timeframe history is limited, so older bars fall back to the candle-shape estimate.
• Balloons, levels, traps and statistics are calculated on bar close and do not repaint. Candle colours on the live bar can change until the bar closes.
• All scorecard numbers are in-sample, depend on the history your chart loads, and change with symbol, timeframe and settings.
• TradingView limits drawings, so the chart keeps the latest 100 balloons and 20 levels by default.
• This indicator does not place trades.
🟢 DISCLAIMER
This script is for educational purposes only and is not financial advice. Past results do not guarantee future results. Always test on your own instrument and manage your risk.
🟢 OVERVIEW
Most volume bubble tools only answer one question: "was this bar's volume big?" A big bar on its own tells you little. What you really want to know is what that volume did next. Eye Volume Balloons answers three questions on your own chart:
▶ Where did unusual volume trade, and was it buyers or sellers?
▶ Did that volume push price, or was it absorbed with almost no move?
▶ After a balloon like this, how often did price follow through, come back to it, or trap the traders who chased it?
🟢 WHAT MAKES IT ORIGINAL
▶ Time-of-day volume baseline. On intraday charts each bar is compared with the normal volume of the same clock time over recent days, not with a flat moving average. Session opens no longer fill the chart with false balloons, and a quiet-hour spike stands out.
▶ Self-ranking sizes. Balloon size comes from the percentile rank of that volume ratio over recent bars, so the same settings adapt to gold, forex, indices, crypto or stocks.
▶ Four balloon types: Push ▲, Push ▼, Absorb and Normal, based on how far price actually moved for the volume spent.
▶ Volume-centre levels. Medium and big balloons leave a level at the bar's volume-weighted price (from lower-timeframe bars), with a visible life cycle: Fresh, Held ×n, Flipped, then removed.
▶ Balloon pop. When a balloon turns into a trap, it pops on the chart (✸ pop), so failed volume is easy to see.
▶ A built-in scorecard that tracks every balloon: follow-through rate, return-to-balloon rate, average bars to return and trap rate, split by balloon type.
All calculations are our own, written from scratch for this script.
🟢 HOW IT WORKS
1. Normal volume
For each bar the script keeps a running average of volume for that exact clock time (default memory 20 days). The volume ratio = this bar's volume ÷ normal volume for that time. On daily and higher charts, or when the option is off, a flat 50-bar average is used instead.
2. Balloon size
The ratio is ranked against the last 500 bars. Percentile 85+ = small balloon, 95+ = medium, 99+ = big, and the ratio must also be at least 1.5× normal. Balloons are drawn only when the bar closes.
3. Buyers vs sellers and volume centre
The script reads lower-timeframe bars inside each candle (timeframe chosen automatically). Volume of up bars counts as buying, down bars as selling, and the volume-weighted price of those bars is the balloon's volume centre. Where intrabar history is not available, the split is estimated from the candle's close position, and the Table dashboard shows how often the split was exact.
4. Balloon type
Bar range is measured in ATR(14).
• Push ▲: range at least 1.2 ATR, close in the top third, buyers at least half.
• Push ▼: the mirror for sellers.
• Absorb: range at most 0.8 ATR. Big volume, small move.
• Normal: everything else.
5. Tracking and levels
Every balloon is followed on closed bars:
• Follow-through: price moves 1 ATR in the balloon's direction before 1 ATR against it, within 20 bars (the adverse side is checked first, so it is a strict count).
• Came back: price first leaves the volume centre by 0.5 ATR, then trades back to it within 50 bars.
• Trap: within 3 bars price closes beyond the opposite end of the balloon bar. The balloon pops.
Medium and big balloons also draw a level at the volume centre. A clean touch counts as Held. A close through the level flips it to the other side. A second break, or 400 bars of age, removes it.
🟢 READING THE CHART
▶ Balloon colour = candle direction + volume level. Green candles use light blue / green / gold, red candles use light red / dark red / maroon, for below Level 2, Level 2+ and Level 3+ volume.
▶ Balloon height = volume ratio. The higher it floats, the more unusual the volume. Balloons close together float at different heights so they do not cover each other.
▶ Text inside: ▲ buyers stronger, ▼ sellers stronger, ◆ absorb, then the ratio (for example ▼1.9×).
▶ Candles are coloured by the same volume levels, so balloon bars stand out from the rest.
▶ Level tags on the right show the price and state, for example "4033.810 · Held ×2".
🟢 WHAT OUR CHART SHOWED
Scorecard on OANDA:XAUUSD 30m with default settings, over the history loaded on our chart (snapshot 1 Nov 2026). In-sample, before spread and commission, not a performance expectation:
• Push ▲: 365 balloons · follow-through 53% · came back 79% · trap 11%
• Push ▼: 410 balloons · follow-through 48% · came back 82% · trap 14%
• Absorb: 494 balloons · follow-through 49% · came back 79%
• Normal: 947 balloons · follow-through 48% · came back 80% · trap 33%
• All: 2216 balloons · follow-through 49% · came back 80% · trap 24%
• Balloon level touches held: 45%
What we take from this: on this chart a balloon on its own was close to a coin flip for direction, but price came back to the balloon's volume centre about 4 times out of 5. Push balloons were trapped far less often than Normal ones. Your numbers will differ on every symbol and timeframe, which is exactly why the scorecard is built in.
🟢 HOW TO USE
1. Add it to your chart and let it load the full history so the scorecard has enough balloons.
2. Read the scorecard first. It tells you how balloons behaved on this symbol and timeframe.
3. Treat balloon volume centres and Held levels as areas to watch for a reaction, not as signals on their own.
4. Absorb balloons at the end of a move show effort without result. Watch for a reversal confirmation.
5. Push balloons that are not trapped in the next few bars show the move was accepted.
6. A popped balloon (✸) marks volume that failed. The opposite side often gets the next move.
7. Use the Buyers / Sellers pressure gauge to see who controlled the recent balloons.
🟢 HOW TO CHANGE SETTINGS
1. Open the indicator settings (double-click its name on the chart).
2. Change the inputs in the group you need.
3. Click OK and check the scorecard again.
Quick guide:
• Too many balloons: raise "Small balloon from percentile", turn off "Show small balloons" or raise "Minimum volume ratio (x normal)".
• Balloon colours: set "Level 2 from volume" and "Level 3 from volume" to the volume your instrument normally trades per bar. The defaults (2,000 and 3,000) are only a starting point.
• Stricter follow-through: raise "Follow-through target (x ATR)".
• Fewer levels: set "Levels from" to "Big only" or lower "Levels kept on chart".
• Dashboard: choose Card, HUD, Table or Off in "Dashboard style".
Test the parameters and timeframe on your own instrument before relying on them.
🟢 SETTINGS
• 📊 Dashboard: Dashboard style (Card / HUD / Table / Off), HUD distance, scorecard position and text size.
• 🎈 Balloons: time-of-day baseline and memory, percentile window, small / medium / big percentiles, minimum ratio, balloons kept, show small balloons, ratio text, balloon size, string colour, pop on trap.
• 🎨 Balloon Colours (by volume): Level 2 and Level 3 volume, three colours for green candles and three for red candles.
• 🧭 Balloon Types: Absorb maximum range, Push minimum range (both in ATR), lower-timeframe buy/sell split.
• 📏 Balloon Levels: show levels, levels from Medium + Big or Big only, levels kept, remove after N bars, hide levels farther than N ATR.
• 📊 Tracking: follow-through target and window, return window, trap check bars, pressure gauge window.
• 🎨 Colours & Dashboard: buyers, sellers and absorb colours, colour candles by volume level.
🟢 ALERTS
• Big balloon
• Push ▲ balloon
• Push ▼ balloon
• Absorb balloon
• Balloon trap
• Balloon level broken
All alerts fire on bar close. There is also a detailed "Any alert() function call" alert for every medium and big balloon, for example: Eye Volume Balloons | XAUUSD 30 | Push ▲ BIG balloon | 3.4× normal | buy 64% | centre 4033.810
🟢 IMPORTANT NOTES & LIMITATIONS
• Forex, gold and CFD symbols usually have tick volume, not real traded volume. The dashboard shows which type your symbol uses. Symbols with no volume data will not show balloons.
• The buyer / seller split is an estimate from lower-timeframe bars, not real bid / ask or footprint data. Lower-timeframe history is limited, so older bars fall back to the candle-shape estimate.
• Balloons, levels, traps and statistics are calculated on bar close and do not repaint. Candle colours on the live bar can change until the bar closes.
• All scorecard numbers are in-sample, depend on the history your chart loads, and change with symbol, timeframe and settings.
• TradingView limits drawings, so the chart keeps the latest 100 balloons and 20 levels by default.
• This indicator does not place trades.
🟢 DISCLAIMER
This script is for educational purposes only and is not financial advice. Past results do not guarantee future results. Always test on your own instrument and manage your risk.

Pernyataan Penyangkalan
Informasi dan publikasi ini tidak dimaksudkan, dan bukan merupakan, saran atau rekomendasi keuangan, investasi, trading, atau jenis lainnya yang diberikan atau didukung oleh TradingView. Baca selengkapnya di Ketentuan Penggunaan.
Pernyataan Penyangkalan
Informasi dan publikasi ini tidak dimaksudkan, dan bukan merupakan, saran atau rekomendasi keuangan, investasi, trading, atau jenis lainnya yang diberikan atau didukung oleh TradingView. Baca selengkapnya di Ketentuan Penggunaan.