OPEN-SOURCE SCRIPT
Diupdate Traivend ATR
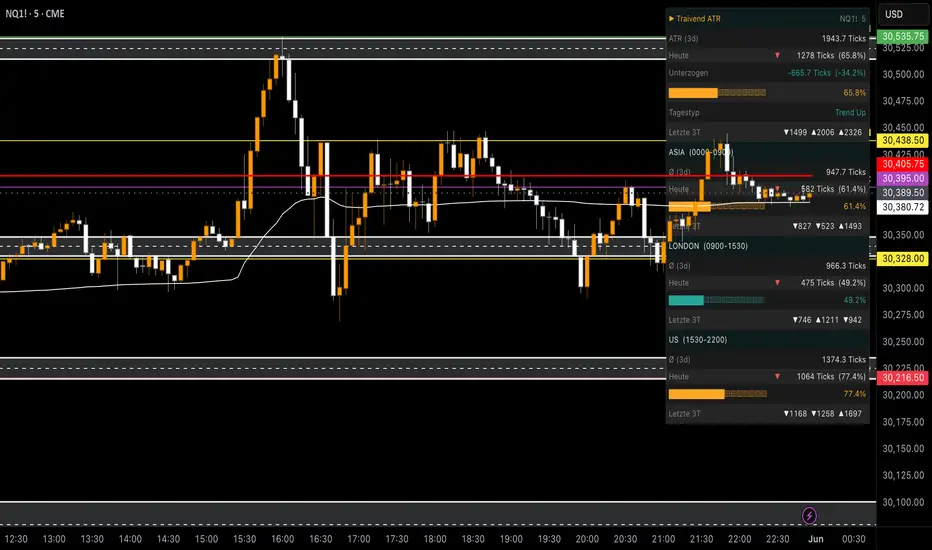
What this indicator does
The ATR Daily Progress measures how many ticks the market has already traveled during the current trading session and compares that value with the average daily movement calculated from previous sessions.
The indicator provides traders with a real-time view of the session's progress relative to its historical average range, helping them understand whether the market is operating below, near, or beyond its typical daily movement.
Key information displayed includes:
Current session ticks traveled
Average daily ticks based on historical sessions
Percentage of average range already completed
Real-time monitoring of daily expansion and exhaustion conditions
Who this indicator is for
This indicator is designed for:
Futures traders
Day traders
Scalpers
Intraday traders
Traders who use volatility and range analysis in their decision-making process
It is especially useful for traders who want to avoid entering trades after a significant portion of the average daily movement has already been completed.
What makes this indicator different
Unlike traditional ATR indicators that only display volatility values, this tool focuses on the practical intraday application of daily range statistics.
The indicator combines:
Real-time session range tracking
Historical average range analysis
Immediate visualization of daily progress
Session-based market exhaustion awareness
The goal is not simply to measure volatility, but to provide actionable context regarding how much of the market's expected daily movement has already occurred.
The ATR Daily Progress measures how many ticks the market has already traveled during the current trading session and compares that value with the average daily movement calculated from previous sessions.
The indicator provides traders with a real-time view of the session's progress relative to its historical average range, helping them understand whether the market is operating below, near, or beyond its typical daily movement.
Key information displayed includes:
Current session ticks traveled
Average daily ticks based on historical sessions
Percentage of average range already completed
Real-time monitoring of daily expansion and exhaustion conditions
Who this indicator is for
This indicator is designed for:
Futures traders
Day traders
Scalpers
Intraday traders
Traders who use volatility and range analysis in their decision-making process
It is especially useful for traders who want to avoid entering trades after a significant portion of the average daily movement has already been completed.
What makes this indicator different
Unlike traditional ATR indicators that only display volatility values, this tool focuses on the practical intraday application of daily range statistics.
The indicator combines:
Real-time session range tracking
Historical average range analysis
Immediate visualization of daily progress
Session-based market exhaustion awareness
The goal is not simply to measure volatility, but to provide actionable context regarding how much of the market's expected daily movement has already occurred.
Catatan Rilis
ATR Projection (Daily Targets) — newAdded a daily range projection. At the start of each session it draws where price can statistically reach, based on the multi-day average daily range (the "ATR (Xd)" value already shown in the panel):
Upper line = anchor + ATR → potential high target for the day
Lower line = anchor − ATR → potential low target for the day
Optional dotted middle line at the anchor
The anchor defaults to the daily open, so the lines stay fixed for the whole session and act as static targets; a "current price" mode is also available if you prefer the lines to follow the live close. Right-edge labels show both the projected distance in your chosen unit (Pips / Ticks / Points) and the exact target price.
Other changes in this update:
New "ATR Projection" settings group — anchor mode, number of past days to keep on chart, toggles for the middle line and labels, plus color, width and style controls.
Two new rows in the info table showing the upper and lower target price levels.
Two new alerts — upper ATR target reached and lower ATR target reached.
The original Sessions panel (per-session ranges for Asia / London / US, daily total, utilization %, day type, multi-day comparison) is unchanged.
Skrip open-source
Dengan semangat TradingView yang sesungguhnya, pembuat skrip ini telah menjadikannya sebagai sumber terbuka, sehingga para trader dapat meninjau dan memverifikasi fungsinya. Salut untuk penulisnya! Meskipun Anda dapat menggunakannya secara gratis, perlu diingat bahwa penerbitan ulang kode ini tunduk pada Tata Tertib kami.

Pernyataan Penyangkalan
Informasi dan publikasi ini tidak dimaksudkan, dan bukan merupakan, saran atau rekomendasi keuangan, investasi, trading, atau jenis lainnya yang diberikan atau didukung oleh TradingView. Baca selengkapnya di Ketentuan Penggunaan.
Skrip open-source
Dengan semangat TradingView yang sesungguhnya, pembuat skrip ini telah menjadikannya sebagai sumber terbuka, sehingga para trader dapat meninjau dan memverifikasi fungsinya. Salut untuk penulisnya! Meskipun Anda dapat menggunakannya secara gratis, perlu diingat bahwa penerbitan ulang kode ini tunduk pada Tata Tertib kami.
Pernyataan Penyangkalan
Informasi dan publikasi ini tidak dimaksudkan, dan bukan merupakan, saran atau rekomendasi keuangan, investasi, trading, atau jenis lainnya yang diberikan atau didukung oleh TradingView. Baca selengkapnya di Ketentuan Penggunaan.