OPEN-SOURCE SCRIPT
RSI of Ratio
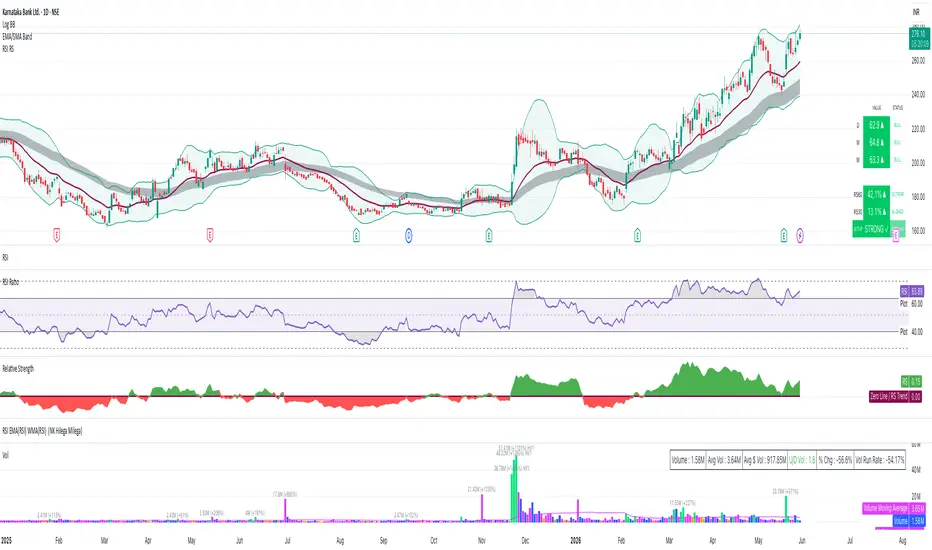
What it does:
Calculates RSI on the ratio of current symbol vs a user-selected compare symbol
(default: NSE:NIFTY). This shows whether the stock is strong or weak relative
to the index.
How to use:
- RSI above 60 → stock outperforming the index (gray dark fill)
- RSI 50–60 → mildly outperforming
- RSI 40–50 → mildly underperforming
- RSI below 40 → stock underperforming the index (gray dark fill)
Settings:
- RSI Length: default 30
- Compare Symbol: any TradingView symbol (Nifty, BTC, SPX, Gold etc)
- All levels adjustable: 70/60/50/40/30
Calculates RSI on the ratio of current symbol vs a user-selected compare symbol
(default: NSE:NIFTY). This shows whether the stock is strong or weak relative
to the index.
How to use:
- RSI above 60 → stock outperforming the index (gray dark fill)
- RSI 50–60 → mildly outperforming
- RSI 40–50 → mildly underperforming
- RSI below 40 → stock underperforming the index (gray dark fill)
Settings:
- RSI Length: default 30
- Compare Symbol: any TradingView symbol (Nifty, BTC, SPX, Gold etc)
- All levels adjustable: 70/60/50/40/30
Skrip open-source
Dengan semangat TradingView yang sesungguhnya, pembuat skrip ini telah menjadikannya sebagai sumber terbuka, sehingga para trader dapat meninjau dan memverifikasi fungsinya. Salut untuk penulisnya! Meskipun Anda dapat menggunakannya secara gratis, perlu diingat bahwa penerbitan ulang kode ini tunduk pada Tata Tertib kami.

Pernyataan Penyangkalan
Informasi dan publikasi ini tidak dimaksudkan, dan bukan merupakan, saran atau rekomendasi keuangan, investasi, trading, atau jenis lainnya yang diberikan atau didukung oleh TradingView. Baca selengkapnya di Ketentuan Penggunaan.
Skrip open-source
Dengan semangat TradingView yang sesungguhnya, pembuat skrip ini telah menjadikannya sebagai sumber terbuka, sehingga para trader dapat meninjau dan memverifikasi fungsinya. Salut untuk penulisnya! Meskipun Anda dapat menggunakannya secara gratis, perlu diingat bahwa penerbitan ulang kode ini tunduk pada Tata Tertib kami.
Pernyataan Penyangkalan
Informasi dan publikasi ini tidak dimaksudkan, dan bukan merupakan, saran atau rekomendasi keuangan, investasi, trading, atau jenis lainnya yang diberikan atau didukung oleh TradingView. Baca selengkapnya di Ketentuan Penggunaan.