Eye EMA Pulse Histogram [EyeAlgo]
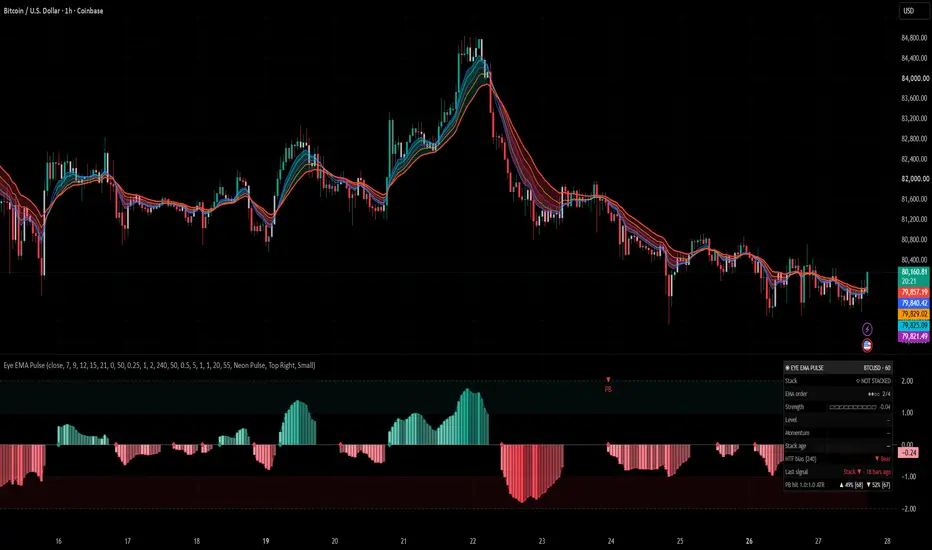
Eye EMA Pulse Histogram [EyeAlgo] is a free, open-source indicator that watches five EMAs (7, 9, 12, 15, 21 by default) and only speaks when they are in perfect order. When all five lines are fully stacked, with no touch and no cross, a histogram appears in the lower pane and a GMMA-style ribbon is filled on the price chart. When the order breaks, both disappear. So an empty pane means "no clean trend right now", and that is useful information too.

What is original here
▶ The histogram exists ONLY while all 5 EMAs are in full order. No touching, no crossing. Optional: you can ask for a minimum gap between every neighbour pair, measured in ATR.
▶ Value = (EMA 1 − EMA 5) ÷ ATR. Because it is divided by ATR, the scale is the same on gold, forex, crypto and indices. A reading of 1.0 means the same thing everywhere.
▶ The ribbon fill on the price chart is drawn only while the stack is active. Fast band is strongest, slow band is lightest.
▶ Three marks: Stack Start, Pullback Continue (PB) and Exhaustion.
▶ HTF EMA bias filter, live heartbeat dot, and a dashboard with EMA order dots, strength meter, stack age, last signal and a PB hit rate.
▶ The code is written from scratch and fully open. You can read every line.
Why these parts belong together
The 5-EMA stack decides WHEN a clean trend exists. The ATR-normalised gap measures HOW STRONG it is, in units you can compare across markets. PB and Exhaustion read the shape of that gap inside one leg. The HTF bias gates only the trend-continuation signal. The stats row lets you check PB on your own chart instead of trusting anyone's numbers.
How it works
1. Five EMAs are calculated on your source (default close): 7, 9, 12, 15, 21.
2. Bull stack = EMA 1 above 2 above 3 above 4 above 5. Bear stack = the exact opposite. Anything else is "not stacked" and nothing is drawn.
3. While stacked, the histogram shows (EMA 1 − EMA 5) ÷ ATR (ATR length 50 by default). Green above zero, red below. Neon Pulse style (default): the colour deepens as the gap gets bigger, and bars where the gap is shrinking are drawn see-through. Classic style: dark colour = the gap is growing, light colour = the gap is shrinking.
4. The gap is sorted into Weak, Normal, Strong and Extreme using the levels you set (0.25 / 1.0 / 2.0 ATR by default). The band between the Strong and Extreme lines can be shaded.
5. Marks and alerts are built on this state:
Stack Start = a new bull or bear stack has just formed (diamond on the zero line).
Pullback Continue (PB) = the leg first reached Strong, then the gap shrank to your pullback depth (50% of the leg's peak by default), then the gap turned back in the trend direction (up for bull, down for bear) while all 5 EMAs are stacked again. A leg = all bars where EMA 1 − EMA 5 keeps the same sign. The HTF filter and a cooldown apply. Bullish = triangle up, bearish = triangle down.
Exhaustion = the gap was at Extreme and has just started to shrink. It is a caution dot, NOT a reversal call.

What the dashboard showed in testing
The dashboard has a row called "PB hit 1.0:1.0 ATR". It checks every PB signal with a 1 ATR target against a 1 ATR stop, and gives up after the max bars you set.
On the author's charts (default settings, checked 27 Oct 2026, BTCUSD, ETHUSD, NAS100, SPX500, XAUUSD, EURUSD and GBPUSD on 30m and 1H) the PB hit rates ranged from about 36% to 59%, most of them close to 50%. With a 1:1 target and stop that is no proven edge, so treat PB as context, not as a system. Your numbers will differ.
Please read these numbers correctly: they are in-sample, before spread and commission, from a simple 1 ATR target vs 1 ATR stop test. They are not a trade result and not a performance expectation. If one bar touches both levels, the test counts it as a stop. Signals that run out of bars are not counted.
How to use
▶ Use the empty pane as a filter. No histogram = the 5 EMAs are tangled, so the trend is unclear.
▶ Use the marks as context, not as orders: Stack Start tells you a trend order has formed, PB tells you a trend leg paused and resumed, Exhaustion tells you the stretch is large and may slow down.
▶ Watch the colour. A solid bar = the gap is widening. A see-through (Neon) or light (Classic) bar = the gap is closing, even if it is still above zero.
▶ Keep the HTF bias on if you want PB signals only in the direction of the higher-timeframe trend.
▶ Test the settings and the timeframe on your own instrument before you trust anything. Different markets behave differently.
How to change settings (Quick guide)
▶ Too few signals: raise "Pullback depth (part of leg peak)" toward 0.8 to allow shallower pullbacks, or lower "Strong from" so legs arm sooner.
▶ Too many or noisy signals: raise "Min gap between EMAs (ATR)", raise "Cooldown bars", or lower "Pullback depth (part of leg peak)" to demand a deeper dip.
▶ Cleaner trends only: raise "Min gap between EMAs (ATR)" (for example 0.05 to 0.10) so touching EMAs are ignored.
▶ Faster or slower feel: change the five EMA lengths, or "ATR length (normaliser)".
▶ Chart too busy: switch off "Show 5 EMAs on price chart", "Colour chart candles (only when stacked)" or the ribbon fill.
Settings by group
5-EMA stack: "Source", "EMA 1 (fastest)", "EMA 2", "EMA 3", "EMA 4", "EMA 5 (slowest)", "Min gap between EMAs (ATR)", "ATR length (normaliser)".
Strength zones (ATR units): "Normal from", "Strong from", "Extreme from", "Shade strong / extreme zones".
Higher-timeframe bias: "Use HTF EMA bias filter", "HTF timeframe", "HTF EMA length". Bias is bull when the previous closed HTF candle closed above its EMA, bear when below.
Signals: "Stack start marks", "Pullback-continue signals", "Pullback depth (part of leg peak)", "Cooldown bars", "Exhaustion dots (caution, not reversal)".
Signal stats: "Target (ATR)", "Stop (ATR)", "Max bars to resolve". These only drive the dashboard hit-rate row.
Display: "Show 5 EMAs on price chart", "GMMA-style ribbon fill between EMAs (only when stacked)", "Show HTF EMA on price chart", "Colour chart candles (only when stacked)", "Ribbon fill transparency", "Histogram style" (Neon Pulse or Classic), "Live heartbeat dot on last bar", "Show dashboard", "Dashboard position", "Dashboard size", and four colour inputs.
Dashboard rows
"Stack" (bull stacked, bear stacked or not stacked; with "Min gap between EMAs (ATR)" above 0, EMAs that are in order but too close also count as not stacked), "EMA order" (dots for how many of the 4 neighbour pairs are in order, out of 4), "Strength" (10-block meter plus the number), "Level", "Momentum" (building or fading), "Stack age" (bars since the stack began), "HTF bias" (shows your HTF timeframe), "Last signal" (with bars ago), and "PB hit 1.0:1.0 ATR" (the in-sample test for bull and bear PB signals, with the count in brackets).
Alerts
Five alert conditions: "Stack Start Bull", "Stack Start Bear", "Pullback Continue Bull", "Pullback Continue Bear", "Exhaustion". The script also sends one combined message once per bar close with the ticker, timeframe, pulse value and close price. Pick either the alert conditions or the "Any alert() function call" option so you do not get two messages for the same bar. Choose "Once Per Bar Close" for the alert conditions. When several events happen on one bar, the alert() message names only one, in this order: PB, then Stack Start, then Exhaustion. Turning off a mark in the settings also turns off its alert.
Live or on bar close?
▶ Signals, marks and alerts are confirmed on bar close only.
▶ The histogram, ribbon, candle colour, heartbeat dot and dashboard update live while the bar is forming. On the open bar the histogram can change, appear or disappear before the bar closes.
▶ HTF bias uses the previous closed HTF candle, so it does not repaint.
Notes and limits
▶ The HTF timeframe must be higher than your chart timeframe. If it is not, the dashboard shows "TF too low" and the filter is skipped.
▶ The HTF filter is applied to Pullback Continue signals only. Stack Start and Exhaustion marks are not filtered.
▶ The heartbeat dot blinks on live ticks only, so it will not blink on a closed market.
▶ EMAs lag price by nature. A stack forms after the move has started.
▶ Exhaustion means "stretched", not "reversal". Trends can stay stretched for a long time.
▶ If "Pullback-continue signals" is off, the PB hit row stays empty.
▶ The PB hit rate is a small in-sample sample on the bars loaded on your chart. It changes with symbol, timeframe, history length and settings.
Disclaimer
This indicator is for education and chart analysis only. It is not financial advice and not a signal service. Markets carry risk and you can lose money. Test on your own instrument and timeframe, and use your own risk management.
What is original here
▶ The histogram exists ONLY while all 5 EMAs are in full order. No touching, no crossing. Optional: you can ask for a minimum gap between every neighbour pair, measured in ATR.
▶ Value = (EMA 1 − EMA 5) ÷ ATR. Because it is divided by ATR, the scale is the same on gold, forex, crypto and indices. A reading of 1.0 means the same thing everywhere.
▶ The ribbon fill on the price chart is drawn only while the stack is active. Fast band is strongest, slow band is lightest.
▶ Three marks: Stack Start, Pullback Continue (PB) and Exhaustion.
▶ HTF EMA bias filter, live heartbeat dot, and a dashboard with EMA order dots, strength meter, stack age, last signal and a PB hit rate.
▶ The code is written from scratch and fully open. You can read every line.
Why these parts belong together
The 5-EMA stack decides WHEN a clean trend exists. The ATR-normalised gap measures HOW STRONG it is, in units you can compare across markets. PB and Exhaustion read the shape of that gap inside one leg. The HTF bias gates only the trend-continuation signal. The stats row lets you check PB on your own chart instead of trusting anyone's numbers.
How it works
1. Five EMAs are calculated on your source (default close): 7, 9, 12, 15, 21.
2. Bull stack = EMA 1 above 2 above 3 above 4 above 5. Bear stack = the exact opposite. Anything else is "not stacked" and nothing is drawn.
3. While stacked, the histogram shows (EMA 1 − EMA 5) ÷ ATR (ATR length 50 by default). Green above zero, red below. Neon Pulse style (default): the colour deepens as the gap gets bigger, and bars where the gap is shrinking are drawn see-through. Classic style: dark colour = the gap is growing, light colour = the gap is shrinking.
4. The gap is sorted into Weak, Normal, Strong and Extreme using the levels you set (0.25 / 1.0 / 2.0 ATR by default). The band between the Strong and Extreme lines can be shaded.
5. Marks and alerts are built on this state:
Stack Start = a new bull or bear stack has just formed (diamond on the zero line).
Pullback Continue (PB) = the leg first reached Strong, then the gap shrank to your pullback depth (50% of the leg's peak by default), then the gap turned back in the trend direction (up for bull, down for bear) while all 5 EMAs are stacked again. A leg = all bars where EMA 1 − EMA 5 keeps the same sign. The HTF filter and a cooldown apply. Bullish = triangle up, bearish = triangle down.
Exhaustion = the gap was at Extreme and has just started to shrink. It is a caution dot, NOT a reversal call.
What the dashboard showed in testing
The dashboard has a row called "PB hit 1.0:1.0 ATR". It checks every PB signal with a 1 ATR target against a 1 ATR stop, and gives up after the max bars you set.
On the author's charts (default settings, checked 27 Oct 2026, BTCUSD, ETHUSD, NAS100, SPX500, XAUUSD, EURUSD and GBPUSD on 30m and 1H) the PB hit rates ranged from about 36% to 59%, most of them close to 50%. With a 1:1 target and stop that is no proven edge, so treat PB as context, not as a system. Your numbers will differ.
Please read these numbers correctly: they are in-sample, before spread and commission, from a simple 1 ATR target vs 1 ATR stop test. They are not a trade result and not a performance expectation. If one bar touches both levels, the test counts it as a stop. Signals that run out of bars are not counted.
How to use
▶ Use the empty pane as a filter. No histogram = the 5 EMAs are tangled, so the trend is unclear.
▶ Use the marks as context, not as orders: Stack Start tells you a trend order has formed, PB tells you a trend leg paused and resumed, Exhaustion tells you the stretch is large and may slow down.
▶ Watch the colour. A solid bar = the gap is widening. A see-through (Neon) or light (Classic) bar = the gap is closing, even if it is still above zero.
▶ Keep the HTF bias on if you want PB signals only in the direction of the higher-timeframe trend.
▶ Test the settings and the timeframe on your own instrument before you trust anything. Different markets behave differently.
How to change settings (Quick guide)
▶ Too few signals: raise "Pullback depth (part of leg peak)" toward 0.8 to allow shallower pullbacks, or lower "Strong from" so legs arm sooner.
▶ Too many or noisy signals: raise "Min gap between EMAs (ATR)", raise "Cooldown bars", or lower "Pullback depth (part of leg peak)" to demand a deeper dip.
▶ Cleaner trends only: raise "Min gap between EMAs (ATR)" (for example 0.05 to 0.10) so touching EMAs are ignored.
▶ Faster or slower feel: change the five EMA lengths, or "ATR length (normaliser)".
▶ Chart too busy: switch off "Show 5 EMAs on price chart", "Colour chart candles (only when stacked)" or the ribbon fill.
Settings by group
5-EMA stack: "Source", "EMA 1 (fastest)", "EMA 2", "EMA 3", "EMA 4", "EMA 5 (slowest)", "Min gap between EMAs (ATR)", "ATR length (normaliser)".
Strength zones (ATR units): "Normal from", "Strong from", "Extreme from", "Shade strong / extreme zones".
Higher-timeframe bias: "Use HTF EMA bias filter", "HTF timeframe", "HTF EMA length". Bias is bull when the previous closed HTF candle closed above its EMA, bear when below.
Signals: "Stack start marks", "Pullback-continue signals", "Pullback depth (part of leg peak)", "Cooldown bars", "Exhaustion dots (caution, not reversal)".
Signal stats: "Target (ATR)", "Stop (ATR)", "Max bars to resolve". These only drive the dashboard hit-rate row.
Display: "Show 5 EMAs on price chart", "GMMA-style ribbon fill between EMAs (only when stacked)", "Show HTF EMA on price chart", "Colour chart candles (only when stacked)", "Ribbon fill transparency", "Histogram style" (Neon Pulse or Classic), "Live heartbeat dot on last bar", "Show dashboard", "Dashboard position", "Dashboard size", and four colour inputs.
Dashboard rows
"Stack" (bull stacked, bear stacked or not stacked; with "Min gap between EMAs (ATR)" above 0, EMAs that are in order but too close also count as not stacked), "EMA order" (dots for how many of the 4 neighbour pairs are in order, out of 4), "Strength" (10-block meter plus the number), "Level", "Momentum" (building or fading), "Stack age" (bars since the stack began), "HTF bias" (shows your HTF timeframe), "Last signal" (with bars ago), and "PB hit 1.0:1.0 ATR" (the in-sample test for bull and bear PB signals, with the count in brackets).
Alerts
Five alert conditions: "Stack Start Bull", "Stack Start Bear", "Pullback Continue Bull", "Pullback Continue Bear", "Exhaustion". The script also sends one combined message once per bar close with the ticker, timeframe, pulse value and close price. Pick either the alert conditions or the "Any alert() function call" option so you do not get two messages for the same bar. Choose "Once Per Bar Close" for the alert conditions. When several events happen on one bar, the alert() message names only one, in this order: PB, then Stack Start, then Exhaustion. Turning off a mark in the settings also turns off its alert.
Live or on bar close?
▶ Signals, marks and alerts are confirmed on bar close only.
▶ The histogram, ribbon, candle colour, heartbeat dot and dashboard update live while the bar is forming. On the open bar the histogram can change, appear or disappear before the bar closes.
▶ HTF bias uses the previous closed HTF candle, so it does not repaint.
Notes and limits
▶ The HTF timeframe must be higher than your chart timeframe. If it is not, the dashboard shows "TF too low" and the filter is skipped.
▶ The HTF filter is applied to Pullback Continue signals only. Stack Start and Exhaustion marks are not filtered.
▶ The heartbeat dot blinks on live ticks only, so it will not blink on a closed market.
▶ EMAs lag price by nature. A stack forms after the move has started.
▶ Exhaustion means "stretched", not "reversal". Trends can stay stretched for a long time.
▶ If "Pullback-continue signals" is off, the PB hit row stays empty.
▶ The PB hit rate is a small in-sample sample on the bars loaded on your chart. It changes with symbol, timeframe, history length and settings.
Disclaimer
This indicator is for education and chart analysis only. It is not financial advice and not a signal service. Markets carry risk and you can lose money. Test on your own instrument and timeframe, and use your own risk management.

Pernyataan Penyangkalan
Informasi dan publikasi ini tidak dimaksudkan, dan bukan merupakan, saran atau rekomendasi keuangan, investasi, trading, atau jenis lainnya yang diberikan atau didukung oleh TradingView. Baca selengkapnya di Ketentuan Penggunaan.
Pernyataan Penyangkalan
Informasi dan publikasi ini tidak dimaksudkan, dan bukan merupakan, saran atau rekomendasi keuangan, investasi, trading, atau jenis lainnya yang diberikan atau didukung oleh TradingView. Baca selengkapnya di Ketentuan Penggunaan.