OPEN-SOURCE SCRIPT
1MF Buy The Dip - Strategy
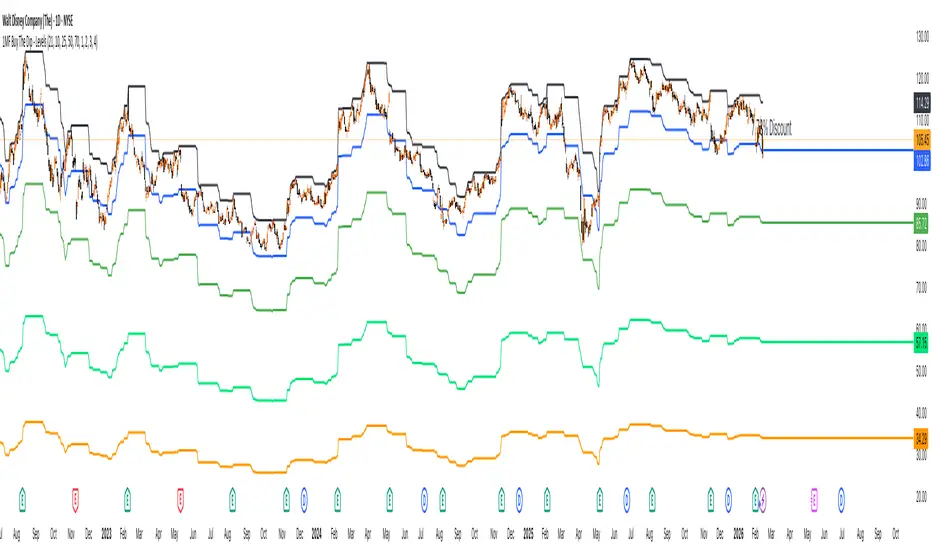
This is the indicator "1MF Buy The Dip - Levels" but made a strategy so you can backtest the usage on each levels.
There are 2 ways to enter:
BY QUANTITY
If Use Shares option is enabled, the amount of shares to open on each level will come from the values above. If it's disabled, then it will use whatever settings you did on the Properties Tab.
The strategy works the following way:
10% discount - a position is open, targeting the previous high
25% discount - another position is open to price average, targeting the same highs.
50% discount & %70% discount, other positions will be opened, targeting the same highs.
The volume of these positions will depend on the Shares Levels you defined (if Use Shares option is enabled), otherwise, on whatever settings you have setup on the Properties tab (percentage, amount, or shares itself).
It's a Buy the Dip and hold, so there's no stop loss as its expected to be an investing strategy instead of a trading strategy.
The look back bars amount is defaulted on 21, which represents 21 days on the daily timeframe (1-month = 30 days high), and from it will start calculating the discount down.
You can play with those numbers to see which one is the best efficient for each stock historically.
Any question, leave it below.
Skrip open-source
Dengan semangat TradingView yang sesungguhnya, pembuat skrip ini telah menjadikannya sebagai sumber terbuka, sehingga para trader dapat meninjau dan memverifikasi fungsinya. Salut untuk penulisnya! Meskipun Anda dapat menggunakannya secara gratis, perlu diingat bahwa penerbitan ulang kode ini tunduk pada Tata Tertib kami.

Pernyataan Penyangkalan
Informasi dan publikasi ini tidak dimaksudkan, dan bukan merupakan, saran atau rekomendasi keuangan, investasi, trading, atau jenis lainnya yang diberikan atau didukung oleh TradingView. Baca selengkapnya di Ketentuan Penggunaan.
Skrip open-source
Dengan semangat TradingView yang sesungguhnya, pembuat skrip ini telah menjadikannya sebagai sumber terbuka, sehingga para trader dapat meninjau dan memverifikasi fungsinya. Salut untuk penulisnya! Meskipun Anda dapat menggunakannya secara gratis, perlu diingat bahwa penerbitan ulang kode ini tunduk pada Tata Tertib kami.
Pernyataan Penyangkalan
Informasi dan publikasi ini tidak dimaksudkan, dan bukan merupakan, saran atau rekomendasi keuangan, investasi, trading, atau jenis lainnya yang diberikan atau didukung oleh TradingView. Baca selengkapnya di Ketentuan Penggunaan.