OI Pressure [Alpine Quant]
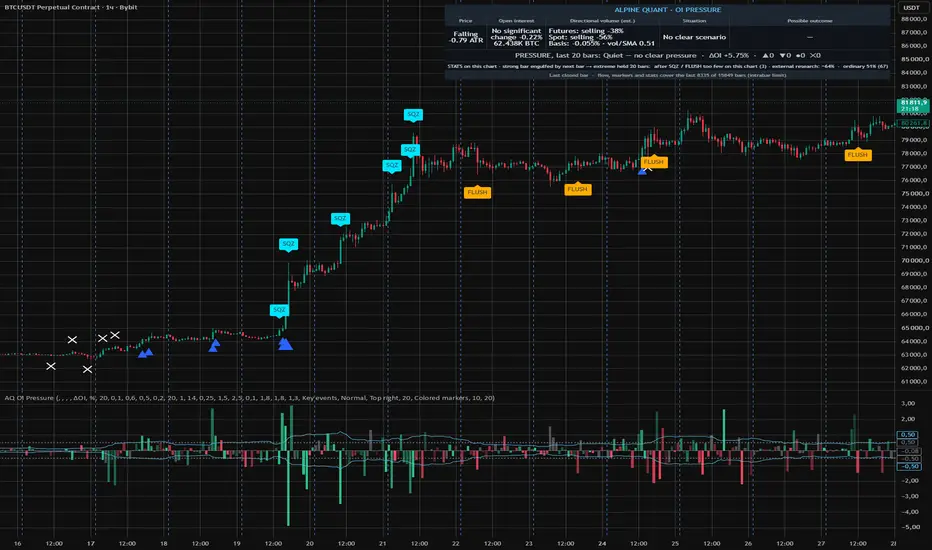
See whether a move comes with positions opening or closing — before you chase it.
OI Pressure helps you read a move: does it come with positions being opened or closed, and with estimated buying or selling? It combines Open Interest with directional volume estimated from intrabars, and adds a futures-vs-spot check.
WHAT IS DIFFERENT
Most Open Interest scripts plot OI alone. OI Pressure classifies every closed bar by three things at once — OI change, intrabar-estimated buy/sell imbalance of the futures and of the spot market — adds a heuristic liquidation estimate, a rolling pressure verdict that must agree with the net OI change, and statistics computed live on your own chart.
WHAT YOU SEE
• Lower pane — change in Open Interest per bar (columns). Color = buy/sell imbalance of futures volume (brighter = stronger). Blue lines = average |ΔOI|; a column beyond the line is a larger than usual change.
• Markers on the price chart (closed bars only):
▲ OI up + buying flow — consistent with new longs opening
▼ OI up + selling flow — consistent with new shorts opening
✕ probable liquidations (below — longs, above — shorts)
SQZ — possible short squeeze: rising bar, OI falling with buying flow, and a probable short liquidation on the same bar
FLUSH — possible long flush: falling bar, OI falling with selling flow, and a probable long liquidation on the same bar
(view «All scenarios» adds ● OI falling = positions closing, and ◆ flat bar with OI rising and one-sided flow = possible absorption)
Every marker is a classification of observable data (price, OI, volume), not knowledge of who traded.
• Table: the last closed bar (price in ATR, OI change, futures and spot flow, basis, interpretation), a PRESSURE line for the last N bars (long build-up / short build-up / deleveraging / mixed / quiet — the verdict must agree with the net OI change) and live STATISTICS on your chart.
HOW IT WORKS
• Open Interest comes from TradingView's <EXCHANGE>:<TICKER>_OI data (for example BYBIT:BTCUSDT.P_OI).
• Directional volume is estimated from intrabars: a lower-timeframe bar closing above its open counts as buying, below — as selling. This is an approximation, not exchange taker-flow data. The intrabar timeframe is chosen automatically from the chart timeframe.
• Spot confirmation: the same flow is measured on the spot market of the same coin (chosen automatically, e.g. ETHUSDT.P → BINANCE:ETHUSDT; can be set manually); the table shows whether spot agrees and the futures/spot basis.
• Probable liquidations are a HEURISTIC ESTIMATE from public data: a sharp OI drop (≥ k × average |ΔOI|) together with high volume and a wide bar. OI can also fall from voluntary closing; Pine Script has no access to real liquidation data.
LIVE STATISTICS (this chart's loaded history only)
The table counts, on the history loaded on your chart and with your settings, what happened after a strong bar was engulfed by the next bar in the opposite direction: did price stay beyond the extreme for N bars? It compares cases where the strong bar was a SQZ / FLUSH with ordinary cases. In our own study (1h, 48 Bybit perpetuals, Dec 2023 – Oct 2026, split into two independent halves) the extreme held for 20 bars in 61.7% / 66.7% of SQZ / FLUSH cases (n = 128 / 189) versus 49.6% / 53.4% for ordinary engulfing (n = 1,523 / 1,835). The study is descriptive: it does not control for bar size or market regime, and a reversal trade on this signal did not pass our own threshold after fees. This is a tendency that can help with exits and with not chasing a move — it is not an entry signal, and past results do not guarantee future ones.
HOW TO USE
• Read the context, not single markers: a rise with OI and buying flow both increasing differs from a rise with OI falling (likely short covering), which may be less sustained — a hypothesis, not a rule.
• SQZ / FLUSH often mark forced, exhausted moves — a reason to be careful with chasing, not an automatic reversal.
• Alerts: any scenario, probable long / short liquidations, short squeeze, long flush.
LIMITATIONS
• Works only on symbols with Open Interest data (crypto perpetual futures on supported exchanges). On spot symbols the table shows «no OI data».
• The number of intrabars TradingView loads is limited (depends on your plan) — a smaller intrabar timeframe means shorter history for flow, markers and statistics.
• For contracts with a multiplier (e.g. 1000PEPE) the auto spot symbol may not exist — the table shows a warning; enter the spot symbol manually (e.g. BINANCE:PEPEUSDT), the price multiplier is detected automatically.
• If the intrabar limit cuts the history, the table says how many recent bars flow, markers and statistics cover.
• All interpretations are hypotheses about market participants, not certainties.
SETTINGS (main)
What to show (key events / all scenarios / liquidations only), significance threshold, liquidation thresholds, spot symbol (auto or manual), pressure window, statistics window, table size and position, colors.
Open-source under MPL 2.0. For education and analysis; not financial advice.
OI Pressure helps you read a move: does it come with positions being opened or closed, and with estimated buying or selling? It combines Open Interest with directional volume estimated from intrabars, and adds a futures-vs-spot check.
WHAT IS DIFFERENT
Most Open Interest scripts plot OI alone. OI Pressure classifies every closed bar by three things at once — OI change, intrabar-estimated buy/sell imbalance of the futures and of the spot market — adds a heuristic liquidation estimate, a rolling pressure verdict that must agree with the net OI change, and statistics computed live on your own chart.
WHAT YOU SEE
• Lower pane — change in Open Interest per bar (columns). Color = buy/sell imbalance of futures volume (brighter = stronger). Blue lines = average |ΔOI|; a column beyond the line is a larger than usual change.
• Markers on the price chart (closed bars only):
▲ OI up + buying flow — consistent with new longs opening
▼ OI up + selling flow — consistent with new shorts opening
✕ probable liquidations (below — longs, above — shorts)
SQZ — possible short squeeze: rising bar, OI falling with buying flow, and a probable short liquidation on the same bar
FLUSH — possible long flush: falling bar, OI falling with selling flow, and a probable long liquidation on the same bar
(view «All scenarios» adds ● OI falling = positions closing, and ◆ flat bar with OI rising and one-sided flow = possible absorption)
Every marker is a classification of observable data (price, OI, volume), not knowledge of who traded.
• Table: the last closed bar (price in ATR, OI change, futures and spot flow, basis, interpretation), a PRESSURE line for the last N bars (long build-up / short build-up / deleveraging / mixed / quiet — the verdict must agree with the net OI change) and live STATISTICS on your chart.
HOW IT WORKS
• Open Interest comes from TradingView's <EXCHANGE>:<TICKER>_OI data (for example BYBIT:BTCUSDT.P_OI).
• Directional volume is estimated from intrabars: a lower-timeframe bar closing above its open counts as buying, below — as selling. This is an approximation, not exchange taker-flow data. The intrabar timeframe is chosen automatically from the chart timeframe.
• Spot confirmation: the same flow is measured on the spot market of the same coin (chosen automatically, e.g. ETHUSDT.P → BINANCE:ETHUSDT; can be set manually); the table shows whether spot agrees and the futures/spot basis.
• Probable liquidations are a HEURISTIC ESTIMATE from public data: a sharp OI drop (≥ k × average |ΔOI|) together with high volume and a wide bar. OI can also fall from voluntary closing; Pine Script has no access to real liquidation data.
LIVE STATISTICS (this chart's loaded history only)
The table counts, on the history loaded on your chart and with your settings, what happened after a strong bar was engulfed by the next bar in the opposite direction: did price stay beyond the extreme for N bars? It compares cases where the strong bar was a SQZ / FLUSH with ordinary cases. In our own study (1h, 48 Bybit perpetuals, Dec 2023 – Oct 2026, split into two independent halves) the extreme held for 20 bars in 61.7% / 66.7% of SQZ / FLUSH cases (n = 128 / 189) versus 49.6% / 53.4% for ordinary engulfing (n = 1,523 / 1,835). The study is descriptive: it does not control for bar size or market regime, and a reversal trade on this signal did not pass our own threshold after fees. This is a tendency that can help with exits and with not chasing a move — it is not an entry signal, and past results do not guarantee future ones.
HOW TO USE
• Read the context, not single markers: a rise with OI and buying flow both increasing differs from a rise with OI falling (likely short covering), which may be less sustained — a hypothesis, not a rule.
• SQZ / FLUSH often mark forced, exhausted moves — a reason to be careful with chasing, not an automatic reversal.
• Alerts: any scenario, probable long / short liquidations, short squeeze, long flush.
LIMITATIONS
• Works only on symbols with Open Interest data (crypto perpetual futures on supported exchanges). On spot symbols the table shows «no OI data».
• The number of intrabars TradingView loads is limited (depends on your plan) — a smaller intrabar timeframe means shorter history for flow, markers and statistics.
• For contracts with a multiplier (e.g. 1000PEPE) the auto spot symbol may not exist — the table shows a warning; enter the spot symbol manually (e.g. BINANCE:PEPEUSDT), the price multiplier is detected automatically.
• If the intrabar limit cuts the history, the table says how many recent bars flow, markers and statistics cover.
• All interpretations are hypotheses about market participants, not certainties.
SETTINGS (main)
What to show (key events / all scenarios / liquidations only), significance threshold, liquidation thresholds, spot symbol (auto or manual), pressure window, statistics window, table size and position, colors.
Open-source under MPL 2.0. For education and analysis; not financial advice.

Pernyataan Penyangkalan
Informasi dan publikasi ini tidak dimaksudkan, dan bukan merupakan, saran atau rekomendasi keuangan, investasi, trading, atau jenis lainnya yang diberikan atau didukung oleh TradingView. Baca selengkapnya di Ketentuan Penggunaan.
Pernyataan Penyangkalan
Informasi dan publikasi ini tidak dimaksudkan, dan bukan merupakan, saran atau rekomendasi keuangan, investasi, trading, atau jenis lainnya yang diberikan atau didukung oleh TradingView. Baca selengkapnya di Ketentuan Penggunaan.