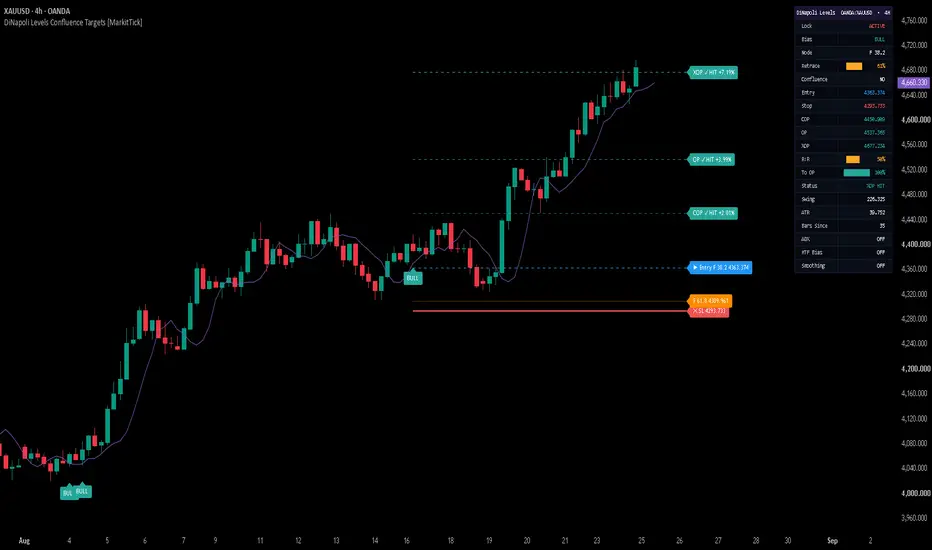
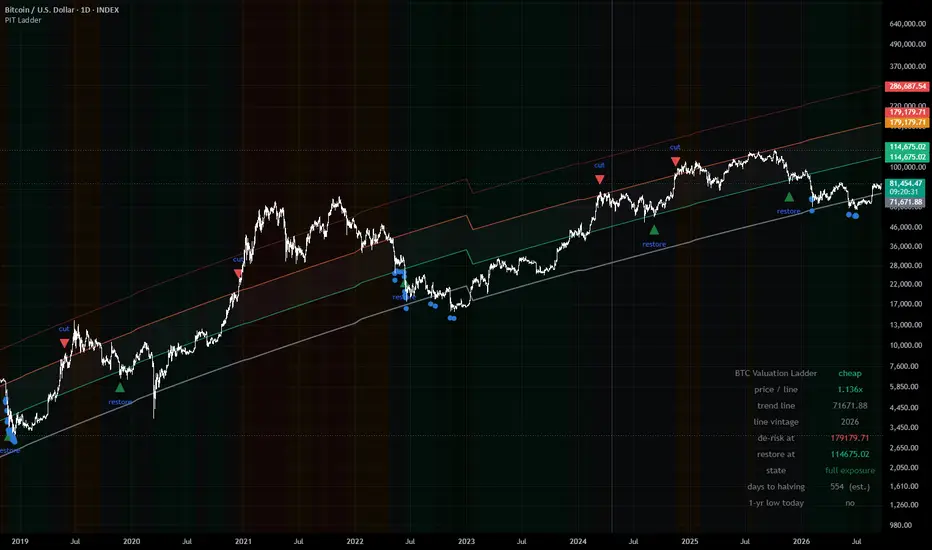
DiNapoli Levels Confluence Targets [MarkitTick]💡 This script automates the complete DiNapoli-style Fibonacci workflow on any symbol and timeframe: it locates confirmed swing pivots, measures the resulting impulse leg, selects an appropriate Fibonacci retracement entry from that leg, projects a three-tier set of Fibonacci profit objectives from the pullback point, cross-checks a second independent swing for confluence, filters everything through a displaced-average trend context, and then tracks the resulting trade in real time through on-chart levels and a live dashboard.
Rather than requiring a trader to manually draw retracement and expansion tools on every fresh swing, cross-reference two different Fibonacci grids by eye, and mentally track a displaced moving average's bias, the script performs all of that detection, labeling, and state-tracking automatically, and exposes the resulting signals through webhook-ready alert payloads for automation.
✨ Originality and Utility
This is not a rehash of a single built-in Pine tool or a simple retracement drawing utility. It implements the full, interdependent DiNapoli Levels sequence as one coherent system, where each stage consumes the output of the previous one:
Confirmed fractal pivot detection builds the swing skeleton the entire tool depends on.
The most recent three-to-five pivots are used to define both a primary swing (for entries and objectives) and a secondary, older swing (used only for confluence cross-checking).
Retracement depth of the pullback determines which of two Fibonacci entry levels is actually referenced, rather than relying on a single fixed ratio for every setup.
Profit objectives are geometric extensions of the very same swing used to derive the entry, not independent, arbitrarily chosen levels.
The displaced-average trend filter, ATR-based stop, and confluence check all read from the same pivot/swing state, so removing any one of them would break the internal logic rather than simply "simplify" the script.
Because the entry, stop, and all three objectives are all mathematically derived from the same confirmed swing, the tool gives traders a single, internally consistent read on a setup instead of several disconnected indicators layered on top of one another. The value is in the integration and automation of a documented, multi-step methodology, the live tracking of trade state once a signal fires, and the structured webhook output for downstream automation — not in inventing a new mathematical formula.
🔬 Methodology and Concepts
• Pivot and Swing Detection
Swing highs and lows are identified using a standard confirmed-fractal method: a candidate high (or low) is only accepted once it is verified to be the extreme point across a window of Pivot Left bars before it and Pivot Right bars after it. Confirmed pivots are stored in a rolling, alternating high/low sequence (capped at the eight most recent) that forms the script's live market-structure map.
• Swing Classification
The three most recent pivots are labeled, oldest to newest, A, B, and C. A bullish structure requires the sequence low → high → low (A low, B high, C low), representing an upward impulse leg from A to B followed by a pullback into C. A bearish structure is the mirror image. The distance from A to B defines the primary swing used for every subsequent calculation.
• Retracement Measurement
The pullback's depth is expressed as a percentage of the A–B swing: how far price has travelled back from B toward A by the time pivot C is confirmed. This retracement percentage drives both setup validity and entry-level selection.
• Fibonacci Retracement Entry Zone
Two retracement levels of the A–B swing are calculated, at 38.2% and 61.8%. If the confirmed pullback has already reached 61.8% or deeper, the script references the 61.8% level as the entry; otherwise it references the shallower 38.2% level. This dynamic selection reflects the idea that the appropriate entry reference depends on how deep the actual retracement has gone, rather than committing to one ratio for every swing.
• Fibonacci Objective Targets
Three profit objectives are projected from pivot C using the primary swing magnitude, following the classic three-tier DiNapoli objective-point structure:
COP (Contracted Objective Point) — C plus 0.618 times the swing.
OP (Objective Point) — C plus 1.000 times the swing.
XOP (Expanded Objective Point) — C plus 1.618 times the swing.
These represent successively less conservative price projections derived from the same impulse leg used for the entry.
• Setup Validation
A setup is only considered valid when all of the following hold: the alternating high/low pattern is intact, the retracement sits between 38.2% and the user-defined Max Retrace ceiling (filters out pullbacks that have gone too deep to be a valid retracement), the swing's magnitude is at least the Min Swing × ATR threshold (filters out insignificant, noise-driven swings), the swing direction is consistent with the claimed bias, the trend filter (if enabled) agrees, and a confluence zone exists (if Confluence Required is enabled).
• Dual-Swing Confluence Detection
A second, independent swing is measured from an older pivot (A2) to B, and the same 38.2%/61.8% retracement math is applied to it. The script then compares all four combinations of the primary and secondary retracement levels and, if the two closest levels fall within Confluence Tolerance × ATR of each other, marks the midpoint between them as a confluence zone. This reflects agreement between two independently measured Fibonacci grids rather than a single grid taken in isolation, which is the basis of the confluence concept in DiNapoli's original methodology.
• Displaced Moving Average Trend Filter
A short simple moving average (DMA Length) is calculated, and the internal trend comparison uses that average's value from DMA Displace bars earlier, effectively lagging the filter by that many bars. The same average is plotted on the chart with a forward visual offset equal to the same displacement, so the line drawn on the chart lines up with the value actually being compared against price. When enabled, only setups where price sits on the correct side of this displaced average are accepted.
• Stop and Objective Placement Logic
The stop is placed a user-defined multiple of ATR beyond pivot C, giving the stop room proportional to the instrument's own recent volatility rather than a fixed distance. All targets are recalculated fresh each time a new, valid setup fires and remain fixed for the life of that trade.
• Signal Firing and State Tracking
A new signal fires only on a confirmed (closed) bar, and only once per underlying pivot, preventing duplicate or repeated firing on the same structure. Once fired, the script tracks live high/low crosses against the stop and each objective; a stop hit takes priority over a same-bar target hit, and each hit updates the relevant level's on-chart label and color permanently for that trade. The Lock Signal input can freeze the presently tracked setup on the real-time bar so that a fresh pivot does not override an open position mid-trade.
⏱️ Confirmation Lag Notice
Because a pivot cannot be confirmed until Pivot Right bars have elapsed past it, both the pivot itself and any signal built from it only become visible on the chart after that many bars have passed — the resulting lines and labels are drawn retroactively onto a swing that has already formed. This is a structural characteristic of any confirmed-pivot Fibonacci tool rather than a flaw, but it does mean a signal never appears exactly at the live turning point; it appears with a short, deliberate confirmation delay.
The script contains no request.security() calls and references no higher-timeframe or future data, so outside of this inherent pivot-confirmation delay there is no forward-looking bias in the setup logic. Entry signals fire only on confirmed, closed bars, and once a signal and its levels are drawn they do not later shift to a different bar or disappear — they are only replaced outright when a new, opposite setup fires.
The DMA line's forward visual offset is a display convention matching the traditional presentation of a displaced moving average: the values plotted are ordinary trailing averages, simply drawn shifted to the right so the line visually tracks price with the same lag the trend filter itself uses internally. It is not a projection or forecast of future price.
🎨 Visual Guide
• Trade Level Lines and Labels
When a setup fires, five horizontal lines and their accompanying labels extend from the signal bar: the Stop (solid, thicker line), Entry (dashed), and the COP, OP and XOP objectives (dashed, drawn in progressively fuller shades of the same bullish or bearish color to reflect their increasing distance). All five lines automatically extend to the current bar while the trade remains open, and extend up to the closing bar once the trade is stopped out or reaches XOP.
• Fibonacci Node Reference Line
A dotted line marks whichever of the two retracement levels (38.2% or 61.8%) was not selected as the entry, shown for reference so the alternate level remains visible alongside the chosen one.
• Confluence Line
When a confluence zone is detected and the Confluence Line option is enabled, a dashed line marks the midpoint between the two agreeing Fibonacci levels from the primary and secondary swing grids.
• Merged Labels
When two or more levels land at the same price, their labels are merged into a single combined label (separated by a middle dot) instead of stacking overlapping duplicate labels, keeping the chart readable.
• Signal Markers
A "BULL" or "BEAR" label is plotted at the low or high of the firing bar respectively, colored to match the configured bullish or bearish color.
• Displaced Moving Average Line
The DMA is plotted in its configured color, shifted forward on the chart by the DMA Displace setting, matching the internal trend-filter reference described above.
• Live Dashboard Table
An on-chart table (position configurable to any corner) shows, row by row: symbol and timeframe, Lock status, current bias, which Fibonacci node is active, retracement depth as a ten-block progress bar with percentage, whether confluence was present, the Entry/Stop/COP/OP/XOP price levels, risk-to-reward expressed as a block bar scaled to 5R, progress toward OP as a block bar, current trade status (open, or which level was hit), the swing size, the current ATR value, and the number of bars elapsed since the last signal.
📖 How to Use
Wait for a "BULL" or "BEAR" marker and its accompanying level lines to appear; remember these will appear with the short pivot-confirmation delay described above rather than exactly at the swing extreme.
On a bullish setup, price will already be sitting in the retracement zone of the prior up-leg; the Entry line marks the DiNapoli-selected reference level, the Stop sits an ATR-buffered distance beyond the swing low, and COP/OP/XOP are staged, increasingly distant profit levels. Bearish setups mirror this on the downside.
Enable Confluence Required to restrict signals to setups where two independently measured Fibonacci grids agree — this produces fewer but more selectively filtered setups.
Leave the DMA Filter enabled to only take setups aligned with the displaced-average trend context, or disable it to see every structurally valid swing regardless of that bias.
Use Lock Signal on the real-time bar if you are already in a tracked trade and do not want a newly forming pivot to override the current levels mid-position.
Watch the dashboard's Status row and block-bar visualizations for a fast read of retracement depth, risk-to-reward, and progress toward the OP objective without needing to read exact prices.
Configure the Alerts group's action strings to match the JSON keys your webhook or automation platform expects, then use TradingView's "Any alert() function call" option to route long, short, close, objective-hit, and stop-hit events.
Treat the Stop, COP, OP and XOP levels as a structured framework for planning risk and staged exits, not as a guarantee that price will reach any particular level — always size positions according to your own risk tolerance.
⚙️ Inputs and Settings
• Core
Pivot Left / Pivot Right — number of bars required on each side of a candidate swing point before it is confirmed; larger values confirm more significant but slower-appearing swings.
Min Swing × ATR — minimum size, in ATR multiples, an A–B swing must have to be considered valid, filtering out noise-sized structures.
Max Retrace — the deepest retracement (as a fraction of the swing) still accepted as a valid pullback.
ATR Len — lookback period for the Average True Range used throughout the stop, minimum-swing, and confluence-tolerance calculations.
• Filters
DMA Filter — toggles the displaced-average trend requirement on entries.
DMA Len / DMA Displace — period and forward displacement of the trend-filter average.
Confluence Required — toggles whether a confluence zone is mandatory for a setup to fire.
Confluence Tol × ATR — maximum distance, in ATR multiples, between two Fibonacci levels for them to be treated as confluent.
• Trade Tools
Lock Signal — freezes the currently tracked setup on the real-time bar, blocking new signals from overriding it.
Stop Buffer × ATR — distance, in ATR multiples, the stop is placed beyond pivot C.
• Visuals
Fibnodes — shows or hides the unused Fibonacci reference node line.
Confluence Line — shows or hides the confluence-zone line.
Signal Markers — shows or hides the BULL/BEAR labels.
DMA Line — shows or hides the displaced moving average plot.
• Dashboard
Show Dashboard — toggles the on-chart table.
Position — selects which chart corner hosts the dashboard.
• Alerts
Long / Short Action, Close Long / Close Short Action — the "action" values sent in the JSON payload for entries and exits.
COP / OP / XOP Action, Stop Action — the "action" values sent when each objective or the stop is hit.
• Colors
Individual color controls are provided for the bullish and bearish themes, stop, entry, each of the three objectives, both Fibonacci nodes, the confluence line, the DMA line, label text, the dashboard's three-tier progress-bar shading, and the dashboard's header, background, and text colors, allowing the full visual theme to be adapted to any chart background.
🔍 Deconstruction of the Underlying Scientific and Academic Framework
The core methodology follows Joe DiNapoli's published approach from "Trading with DiNapoli Levels" (1998), which combines a displaced moving average for trend context with Fibonacci retracement levels for entry timing and a three-tier set of Fibonacci expansion objectives — the Contracted, standard, and Expanded Objective Points — for profit projection. The script's DMA filter and COP/OP/XOP target structure are direct implementations of that framework.
The use of Fibonacci ratios in price analysis traces back to the Fibonacci sequence itself (Leonardo of Pisa, 13th century) and its adoption into market analysis through Ralph Nelson Elliott's wave theory and W.D. Gann's work on proportional price relationships, later formalized by DiNapoli into a discrete, rules-based entry and objective framework.
Swing-point identification via a confirmed left/right bar window reflects the standard swing-high/swing-low definition used broadly across technical analysis, closely related to the fractal concept popularized by Bill Williams, and provides an objective, repeatable substitute for discretionary chart reading.
Average True Range, developed by J. Welles Wilder, supplies the volatility-normalized basis for the stop distance and minimum-swing filter, allowing the same input values to scale automatically across instruments and volatility regimes rather than relying on fixed point or pip distances.
The confluence-detection logic reflects the broader "cluster" or "confluence zone" concept found throughout Fibonacci-based technical analysis: treating agreement between two independently derived retracement grids as a stronger signal than either grid considered alone, a filtering approach explicitly discussed within DiNapoli's own writings on Fibonacci analysis.
⚠️ Disclaimer
All provided scripts and indicators are strictly for educational exploration and must not be interpreted as financial advice or a recommendation to execute trades. We expressly disclaim all liability for any financial losses or damages that may result, directly or indirectly, from the reliance on or application of these tools. Market participation carries inherent risk where past performance never guarantees future returns, leaving all investment decisions and due diligence solely at your own discretion. Indikator
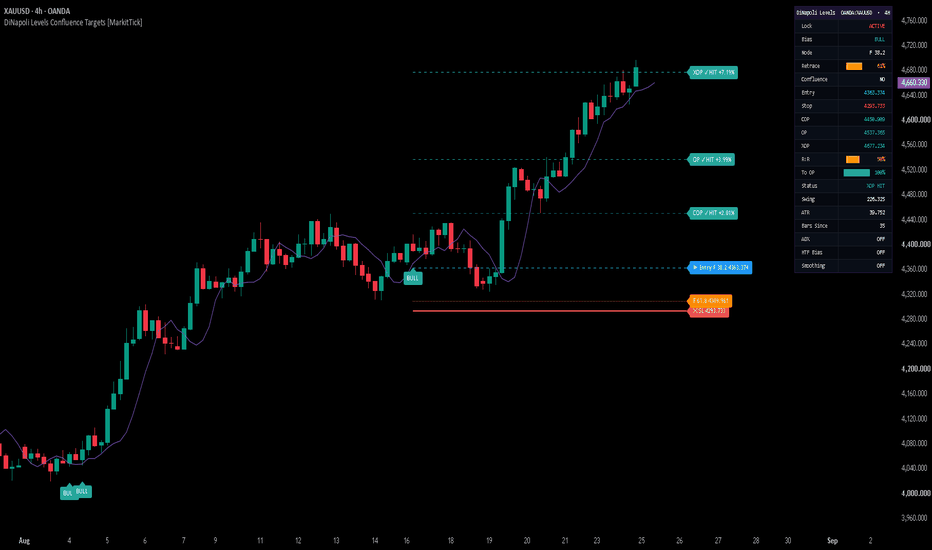
Delta Flow Ribbon [AlgoNorth]Delta Flow Ribbon
Picture two bars with the same heavy volume. In one, price travels the way that volume was leaning. In the other, it barely moves. A volume histogram draws them the same height. Delta Flow Ribbon is built to tell them apart.
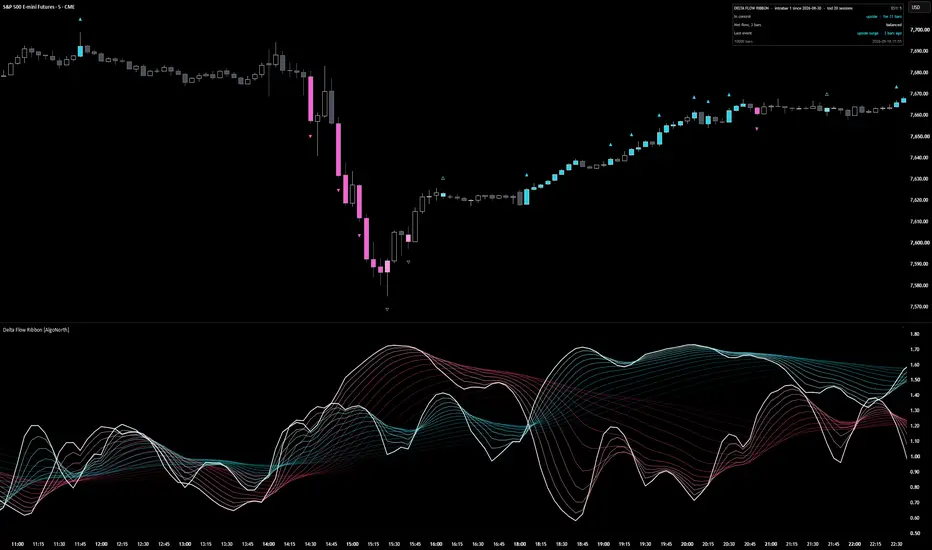
It starts with which way the volume was leaning. Two 14‑strand ribbons, blue for upside flow and pink for downside, each measured against what is normal for that exact time of day. Whichever ribbon sits on top is in control, and the fan opening or closing shows whether that control is building or fading.
The flow behind the ribbons is estimated volume delta: volume with a direction. The script looks at the 1‑minute bars inside every chart bar. Each one's volume counts as upside if it closed up, and downside if it closed down.
Then it checks whether the push worked. Candles light up where flow surges (net flow at least 2.0× normal over three bars, with price travelling with it) and where a hard push stalls (at least 1.5× normal with price travelling 0.35× or less of what that flow would usually move it). Blue for upside, pink for downside, and a lighter shade where the flow was absorbed.
It is a context tool for your own setups. It shows who is in control and when that control is being tested. It does not say what price does next.
🔶 USAGE
🔸 Start with the ribbons. Blue on top means upside flow is running ahead of downside; pink on top means downside is ahead. The bright line on top of each ribbon is its core, the quickest strand. Where the two cores cross, control has changed hands. A ribbon spread wide is flow on the move; a ribbon pulled tight is flow that has settled.
🔸 Then look up at the candles. A solid ▲ above a blue candle marks the start of an upside surge, a solid ▼ below a pink candle, the start of a downside one. A hollow △ or ▽ on a lighter candle marks absorbed flow: a heavy push went in and price barely moved. One arrow per run keeps the chart clean, and the run continues for as long as the candles stay coloured.
🔸 The candles come first and the ribbon confirms. The ribbon is smoothed over 5 to 30 bars, so its peak lands a few bars after the last coloured candle. Read the candle as the event and the ribbon as how much flow has built up behind it (the smoothing can be lowered in the settings for a quicker reaction).
🔸 The sequence worth learning: pink surge candles into a low, a light‑pink absorbed candle at the bottom, then the blue core rising up through the pink. Heavy downside flow met size, then upside flow took over. Weigh it against your own levels. It is context, not a trigger.
🔸 Price climbing while the blue ribbon slides back towards 1.0 is a move running on less flow than it started with. Price flat while a ribbon stays high is flow being soaked up. Both ribbons near 1.0 means nobody is pushing.
🔸 The panel reads the most recent bar, not the part of the chart you have scrolled to: who is in control and for how long, net flow over the last three bars, and the last event. On a live bar it says "forming now" until the bar closes. Full mode adds the raw readings, the delta source and running counts.
🔸 One thing that surprises people: the 09:30 open often shows no coloured candles at all. That is deliberate. Every bar is compared with the average for that same time of day over the last 20 sessions, so heavy flow at the open is just average for the open. A candle only colours when its flow is well above the average for its time of day.
🔶 DETAILS
🔸 Estimated delta. Each chart bar is split into its 1‑minute bars (5‑minute on charts above an hour, hourly on daily). A 1‑minute bar that closed above the previous close puts its volume into upside flow, one that closed below puts it into downside, and an unchanged close keeps the previous direction. Add them up and that is the bar's estimated delta. Where that smaller data is not available, the script places volume by where the close sits in the bar's range instead, and the panel says so.
🔸 Normal for the time of day. Volume, upside flow, downside flow and close‑to‑close travel are each averaged per time slot over the previous 20 sessions. A 5‑minute chart has 288 slots a day, and each one only ever compares itself with its own history. On charts above four hours, or until a slot has enough history, a rolling 300‑bar average takes over and the panel header shows which is in use.
🔸 The ribbons. Upside flow divided by its normal feeds the blue ribbon, downside flow divided by its normal feeds the pink. 1.0 is normal, and each side is measured up to 5×. Every ribbon is the same reading drawn at 14 smoothing lengths spaced from 5 to 30 bars, each passed through three rounds of exponential smoothing, which is what makes the fan open and close. Bars trading under 0.6× normal volume are eased back towards 1.0 so thin trade cannot throw the ribbons around.
🔸 Surge. Net flow = the 3‑bar average of delta ÷ the average one‑way flow for that time of day. A surge is net flow of at least 2.0×, with price travelling in the flow's direction.
🔸 Absorbed flow. Net flow of at least 1.5×, but the 3‑bar price change ÷ the average price change for that time of day comes to 0.35× or less of what that much flow should produce. Expected travel grows with roughly the square root of flow (exponent 0.5): four times the flow is expected to move price about twice as far, not four times. The script measures only the mismatch. Resting size on the other side is one common reason for it, not something the script can see.
🔸 Colours adapt to the chart. Put it on a white or light‑grey background and the ribbons, candles, arrows and panel darken instead of fading out.
🔶 SETTINGS
🔸 Delta: intrabar (default) or bar shape, with the intrabar timeframe on Auto or fixed at 1, 5 or 15 minutes.
🔸 Calibration: time of day (20 sessions per slot) or recent bars (300), plus the quiet threshold (0.6× normal volume).
🔸 Look: fastest strand 5, strand span 25, three smoothing passes, 14 strands, and the two ribbon colours. The defaults are smoothed on purpose. Drop the fastest strand or the passes for a twitchier ribbon.
🔸 Candles: surge at 2.0×, absorbed at 1.5× with price response 0.35×, exponent 0.5, the two candle colours, absorbed shade, arrows once per run or on every candle, arrow size, optional glow.
🔸 Alerts: control change, flow surge and absorbed flow. Pick them as named conditions, or choose "Any alert() function call" to get all three in one alert with the symbol, timeframe and readings in the message.
🔸 Scale: soft (default), log or none, with a knee for how hard extremes are squeezed. Panel: compact or full, on the price chart or in the pane, any corner.
🔶 LIMITATIONS
🔸 The delta is an estimate. It comes from 1‑minute price direction and volume, not exchange‑reported bid and ask trades, and it will differ from a true trade‑by‑trade delta.
🔸 Intrabar history runs out. Older bars beyond it use the bar‑shape fallback, and the panel shows the date the intrabar data begins.
🔸 On a 1‑minute chart there is no smaller timeframe and too few sessions inside the 10,000‑bar window, so it runs on bar shape and the recent‑bars baseline. The panel says so.
🔸 On symbols whose feed reports tick counts rather than traded size (most spot forex and CFDs), the reading is a net tick count, not a volume delta, and the panel flags it.
🔸 The script calculates the most recent 10,000 bars. Readings above 5× normal are shown as 5×.
🔸 The forming bar updates until it closes. Everything on closed bars is fixed.
🔸 Time‑of‑day calibration needs an intraday chart of four hours or less. Daily and weekly charts use the recent‑bars window.
🔶 SUMMARY
Delta Flow Ribbon turns estimated volume delta into two things you can read at a glance. The ribbons show which side is pushing and how hard for that time of day. The candles show where that push surged or was absorbed. Blue for upside, pink for downside, lighter where the flow stalled. It marks conditions, not outcomes.
Indikator
Strong Fade Signals | ProjectSyndicate▪️Strong Fade Signals catches the moment an over-extension runs out of fuel — price tears far beyond its own volatility envelope, exhausts the momentum crowd, then stops expanding — and fires the fade the instant the burst stalls. Markets stretch away from their mean in bursts: a candle drives two, three, four ATR past a volatility band, sucks in the breakout chasers at the worst possible price, then fails to push further and snaps back toward the average.
▪️That stalled burst is the event. The engine measures how violently and how far price has over-travelled as a 0–10 Setup Quality and fires AGAINST the burst — with the reversion, not with the stretch. Every setup gets a structural invalidation level beyond the burst extreme, fixed R-based targets, a 0–10 strength with a 1–4 star rank, and is tracked live on a full statistics dashboard — including honest stop-outs — so you can see exactly how the logic behaves on the symbol and timeframe you trade.
🧠 Burst Core — the core idea, expressed as a lifecycle: BAND ▸ BURST ▸ STACK ▸ STALL ▸ FADE. A moving-average basis wrapped in an ATR band defines what "normal" travel looks like. A burst happens when a bar's wick pokes beyond that band — the over-extension that runs past fair value and has to be paid for. The burst is allowed to keep expanding as long as each bar pushes further in ATR terms; the fade fires on the first confirmed bar where the previous reading was the peak and the current reading comes in smaller. Up-bursts flip to a SHORT, down-bursts to a LONG. Magnitude is measured in ATR beyond the band, the stall is evaluated on the bar's close, and detection runs on confirmed bars only — so a printed signal never disappears from the chart.
🔎 Six Basis Engines — you choose what price is over-extended from. EMA is the validated default on intraday gold and reacts fast enough to keep the band honest in a trend. SMA gives a slower, flatter reference that produces fewer but deeper bursts. HMA tracks aggressively for scalping timeframes, WMA and RMA sit between the two, and VWMA weights the basis by volume so the band respects where business was actually done. One switch changes the entire character of what the engine treats as over-extension, without touching the rest of the logic. Band width in ATR sets how far price must travel before a burst even begins to count.
🔋 Strength Anatomy — a burst is not just true or false; it is scored for how clean the fade setup is. The Setup Quality fuses seven reversion-native ingredients into a single 0–10 read: burst extension (how far past the band the move reached), stack height (how many ATR notches of over-travel accumulated), momentum exhaustion (how stretched RSI is at the peak), rejection wick (how decisively the peak bar was sold or bought back), trend fit (whether the basis slope agrees with the direction you are fading toward, or whether you are catching a knife), volatility regime (calmer conditions favour clean snap-backs over runaway expansion), and reversion room (how much distance there is between price and the basis to actually travel). Each ingredient carries its own adjustable weight and contributes to the 0–10 total, so you shape what qualifies through the weights and the gates rather than chasing a single number.
🎯 Structural Invalidation + R-Based Targets — the stop is anchored to the burst, not guessed. Burst Extreme, the default, places invalidation just beyond the peak bar's wick — the price that, if exceeded, means the exhaustion read was wrong and the move is still expanding — plus an ATR buffer for cushion. ATR Multiple and Swing Extreme are available for a fixed or structural stop instead. That distance is then clamped between an ATR floor and an ATR ceiling, so a stop never balloons into a wide one and the 1R target never collapses into a tight scalp.
▪️Targets run as clean R multiples, defaulting to 1R / 2R / 3R, or in Mean Reversion mode which places TP1 halfway back to the basis, TP2 at the basis itself, and TP3 half a band beyond it — with R-values measured from the real distances, so the statistics stay truthful rather than assuming a clean multiple. Every signal plots its complete Entry / SL / TP1 / TP2 / TP3 line set, labeled level prices, three graded profit zones and a stop zone, with a result label on exit — and every zone is drawn at the same fixed width in bars, so long and short tickets leave an identical, uniform footprint on every symbol and every timeframe.
⭐ 0–10 Strength with Star Tiers — every signal is labeled with its numeric strength, a star rank, and a tier ladder running MINIMAL → WEAK → MODERATE → STRONG → ELITE, so the raw quality of a setup reads at a glance without checking the number. Treat the strength as a cleanliness and confluence read for ranking and thinning setups — it describes how textbook a burst-and-stall is, not a guaranteed outcome. The Minimum Stars gate restricts what is taken and alerted, while the dashboard keeps tracking every tier in the background so you can see, on your own data, whether higher tiers actually convert better.
🎚️ Conviction Controls — a compact set of dials sets how serious a burst must be before it counts: the Minimum Stack Height (how many ATR notches of over-travel are required to fade at all), the Minimum Burst Magnitude in ATR, the rejection-wick requirement on the peak bar, the RSI exhaustion gate at 65 and 35, the Minimum Stars floor, the Alert Minimum Stars threshold, the ATR per stack step that defines how finely over-travel is graded, and the max-risk cap and min-risk floor that keep the stop sane. Long-only and short-only switches let you fade one side of the book. Tighten them for fewer, more violent over-extensions; loosen them for more activity. This is your main control over conviction versus frequency.
🧭 Single-Ticket Discipline & Honest Accounting — only one ticket is active at a time, and a 20-bar minimum spacing between signals enforces a hard gap between entries so one choppy, whipsawing session can't stack overlapping trades on top of each other. Resolution is SL-first pessimistic with honest partial-target accounting — if a stop is hit after TP1 or TP2, that partial result is booked rather than rounded up to a full win, and a stop and target touched on the same bar is always resolved as the loss. A time-stop closes any trade that neither targets nor stops within a generous window, so nothing sits open forever and the on-chart statistics track how the setups actually run to target.
📊 Live Statistics Dashboard — a non-intrusive panel tracks, in real time on your chart: the current status cycling through SCANNING → BURSTING → ARMED → IN TRADE, the live burst state and which side it implies, and the last signal with its star score. Seven live slider gauges show exactly what the engine is reading bar by bar even when no signal is present — extension in ATR, stack height, RSI, rejection percentage, trend fit, volatility percentile, and distance to the basis — feeding a composite SCORE gauge, so you can watch a setup build before it fires instead of being surprised by it. Below that: win rate, total closed trades, profit factor, average R per trade, cumulative total R, best-performing direction, long vs short win rate, current and max win/loss streaks, and a TP1 / TP2 / TP3 / SL outcome breakdown. A multi-timeframe burst-bias strip shows the current and two higher-timeframe fade biases at a glance, a Win Rate By Strength table breaks results out by star tier, and a Last Trades ledger lists the most recent exits with their signed R. Every filled trade that reaches an outcome is counted — winners and stop-outs alike — so the numbers are computed live from the real signals on your current symbol and timeframe, not a figure printed in a description.
🎨 Clean Themed Visuals — seven coherent palettes, all tuned for a black chart background — Aurora (the clean mint-and-rose default), Gold Noir, Bloomberg Amber, Ice Blue, Aqua Violet, Neon Magenta, and Institutional — shade the signal labels, the per-trade SL / TP ladder and graded zone boxes, the level tags, and the dashboard to one consistent look, so direction and quality read at a glance. Each fade prints a labeled FADE LONG or FADE SHORT signal with its strength, star tier, and stack height, and a hover tooltip carrying the full breakdown. An optional background tint marks maximum-stack extremes. A max-drawn-trades cap keeps only the most recent tickets on the chart while the statistics stay cumulative over the full history.
🔔 Detailed Alerts — fires on a Fade Long, a Fade Short, any fade signal, and on TP3 Hit, Partial TP Exit, and SL events, plus dedicated Extreme Up Burst and Extreme Down Burst alerts for maximum-stack over-extension, formatted for manual or automated use. The strength gate can restrict alerts to higher-conviction setups only.
🔧 Fully Customizable — every component is exposed: the basis source, basis type and length, ATR length, band width, ATR per stack step, max stack height, heat saturation, the closing-burst requirement and the bar-close confirmation switch; the minimum stack height, minimum magnitude, rejection-wick threshold, RSI gate and its levels, side permissions and the signal spacing; the stop basis and its swing lookback, ATR distance, stop buffer, max-risk cap and min-risk floor, the target ladder mode and its three R levels, the time-stop window, the universal zone width and the max historical tickets drawn; the minimum-stars gate, the alert threshold, and each of the seven strength weights; the dashboard position, size, gauge width, and every section toggle including the MTF strip and its two timeframes; all seven themes; and every signal label, star, line, box, level tag, and dashboard element.
🎯 Why this is different — most reversal tools flag an overbought oscillator or a long wick after the fact. This one treats the volatility over-extension and its exhaustion as the event, grades the over-travel in ATR notches rather than as a binary condition, scores how clean the burst-and-stall is across extension, stack, exhaustion, rejection, trend fit, regime and reversion room, and fires only when the burst stops expanding — catching the snap-back at its origin — then anchors invalidation beyond the burst extreme, ranks every setup on an objective 0–10 scale, and layers a live dashboard whose sliders let you watch the engine think in real time while counting stop-outs in full. You tune and judge it on real, current data from your own chart instead of a marketing number.
🚀 Where to use it — the engine was built and tuned on XAUUSD (gold) on intraday timeframes, where violent over-extensions and rapid mean reversion are a constant feature — but the mechanics are symbol-agnostic and rest on universal behaviour: every liquid market over-travels its own average and pays for it. It can be applied to FX majors and crosses, metals, indices, and crypto on intraday timeframes, with the ATR band and ATR-based stop adapting to each instrument's volatility. Because it fades exhaustion, it shines in ranges, at session extremes, and after news spikes, and demands more care in violent one-way trends where a burst can keep expanding rather than stall — the Trend Fit weight and the dashboard's tier table are there to tell you whether the logic suits the pair and timeframe before you commit.
🎯 How to trade it
▪️Apply it to a liquid symbol on an intraday timeframe and let the dashboard populate. Read the live win rate, profit factor, and average R for your symbol and timeframe first — if the logic doesn't suit that market, you'll see it.
Watch the sliders while the status reads BURSTING or ARMED — you can see extension, stack and exhaustion loading before anything prints, which tells you a fade is brewing rather than ambushing you.
▪️Wait for a labeled FADE LONG / FADE SHORT signal — it marks a confirmed close where the over-extension peaked and stopped expanding, with the strength, star tier, and full Entry / SL / TP1 / TP2 / TP3 already plotted.
▪️Read the star tier and the stack height for a fast conviction check — a deep stack with a decisive rejection wick and a higher tier means a more textbook fade.
▪️Manage the trade with the plotted levels — the ATR-clamped stop sits beyond the burst extreme and defines your risk, and TP1/2/3 sit at your chosen R multiples or at the band-to-basis reversion ladder. Bank or trail however suits your style.
▪️Use the Minimum Stack Height, the Minimum Stars floor, the rejection-wick threshold, the RSI gate and the signal spacing to set your tempo — stricter for fewer, more violent over-extensions; looser for more activity.
⚠️ Important — this is a decision-support tool, not a standalone buy/sell system, and it makes no performance guarantees. Default settings were chosen on historical gold data and behaviour will vary by symbol, timeframe, session, and configuration; the dashboard's statistics are historical and descriptive, not a forecast, and are simulated without spread, commission or slippage. The trade model resolves stop-first and books partial-target exits honestly, so some trades close for a fraction of a target rather than a full win — these are counted in full, which is honest but means win rate alone is misleading; always weigh it together with average R and profit factor, and resize the R targets to your own risk profile. Signals confirm on the closed bar and require one further bar to prove the burst has stopped expanding — so always wait for the labeled fade on a closed candle. Because the system fades a move, a genuine trend leg or a burst that keeps expanding can run straight through a stop — combine it with your own analysis and risk management, and test it on your market before trading it live. Indikator

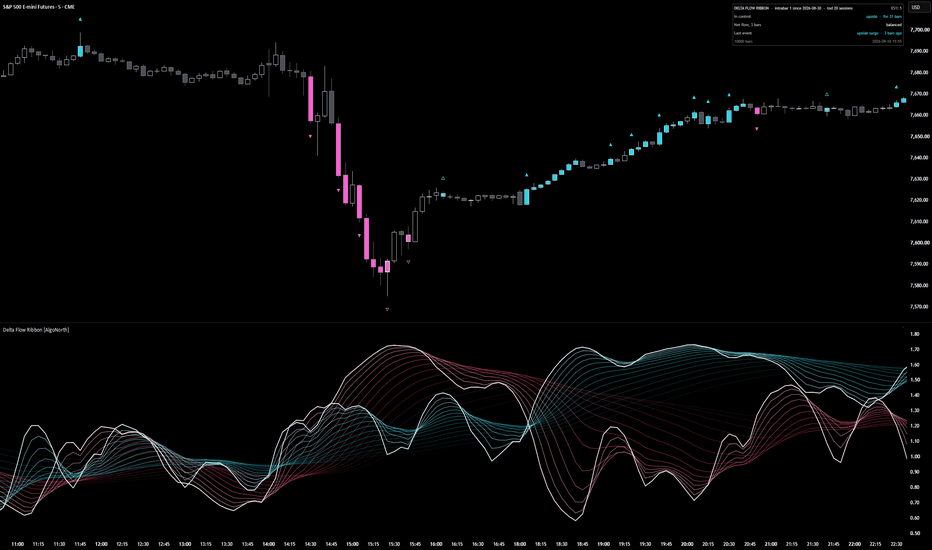
Advanced Support Resistance ZonesAdvanced Support Resistance Zone
www.tradingview.com
What This Indicator Is
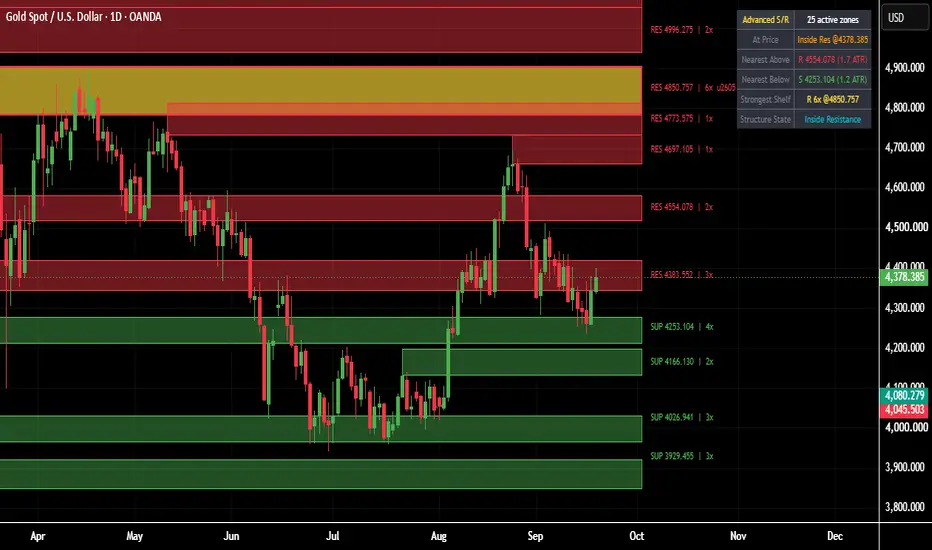
Advanced Support Resistance Zones is an automatic support and resistance tool that finds the real swing highs and lows on any chart and turns them into live, self-updating price zones instead of plain single-price lines. Each zone is a shaded band with a clear label showing whether it is resistance or support, the exact price level, and how many times price has reacted to it. The single most significant zone on the chart is highlighted separately so the strongest level always stands out. A live dashboard in the corner of the chart summarizes the current structure at a glance, so a trader does not need to manually count zones or measure distances.
Why It Was Built
Manually drawing support and resistance is slow, inconsistent, and different from one trader to the next. Two traders looking at the same chart often mark completely different levels depending on mood and experience. This indicator removes that inconsistency by using a fixed, repeatable method every single time: it looks only at confirmed swing highs and lows, groups nearby ones together into a single zone instead of drawing dozens of overlapping lines, and keeps a running count of how many times each zone has actually mattered to price. The goal is a clean, objective map of the levels that price itself has already proven are important, updated automatically as new data comes in.
How It Works
The engine watches for confirmed swing highs and swing lows using a standard pivot detection method. Every time a new swing high forms, it is treated as a resistance candidate; every new swing low is treated as a support candidate. Instead of creating a brand new zone for every single pivot, the script first checks whether the new pivot is close enough in price to an existing zone of the same type. If it is close enough, the two are merged together using a running weighted average, so the zone's price slowly centers itself on the true average of every touch, and its touch counter goes up by one. If nothing close enough exists yet, a brand new zone is created. Each zone is drawn as a shaded rectangle so its thickness reflects normal market noise around that level rather than being an impossibly thin, unrealistic line.
Every zone also tracks whether price is currently sitting inside it. A touch is only counted the moment price freshly enters the zone after having been outside it, which stops a slow, grinding move through a zone from being counted as dozens of touches. When price fully closes beyond a zone in the opposite direction, the zone is understood to be broken, and because a broken resistance level frequently goes on to act as support afterwards (and the same in reverse for a broken support level), the zone flips its role, resets its touch count, and continues tracking from there rather than disappearing outright. To keep the chart readable, only a limited number of zones are kept active at once; if that limit is ever exceeded, the zone that currently sits farthest away from the live price is removed first, since it is the least relevant to what is happening right now.
How To Read The Chart
Every zone is labeled directly on its own band. A red label reading RES followed by a price and a touch count is a resistance zone; a green label reading SUP followed by a price and a touch count is a support zone. The number before the small x is simply how many separate times price has reacted to that exact level since the zone was formed, so a zone showing a higher number has been tested and respected more often than one showing a low number. Exactly one zone at a time, the one with the highest touch count among everything currently active, is drawn in a distinct highlight color and marked with a star symbol next to its label, making the single most important level on the chart impossible to miss.
How To Use It For Analysis
Start by identifying where price currently sits relative to the nearest zones above and below it; this alone tells you whether the market has room to move or is already pressing against a meaningful level. When price approaches a zone with a high touch count, treat it with more respect than a fresh, barely-tested one, since it represents a level the market has already agreed on multiple times. Watch for a reaction at the zone, a stall, a wick rejection, or a reversal, as confirmation that the level is holding; a clean close through the zone instead signals that it has broken, at which point the same level flips role and becomes worth watching in the opposite direction going forward. The starred strongest zone deserves the closest attention of all, since it represents the single level the market has interacted with the most. Used this way, the indicator is not a standalone buy or sell signal generator, but a structural map that should be combined with your own entry timing, trend reading, and risk management.
What The Dashboard Shows
The dashboard sits in the corner of the chart and updates on every new bar. The first row shows how many zones are currently active on the chart. The row labeled At Price tells you immediately whether the current price is sitting inside a resistance zone, inside a support zone, or simply between zones with open space on both sides. The Nearest Above row shows the closest resistance zone sitting above the current price, along with how far away it is measured in multiples of average recent volatility, so the same reading means roughly the same thing on a calm day as on a wild one. The Nearest Below row shows the same information for the closest support zone underneath price. The Strongest Shelf row always reports whichever single zone currently has the highest touch count anywhere on the chart, together with its price, so you never have to hunt for it visually. The final row, Structure State, gives a one line plain English summary of the current situation, such as sitting inside resistance, sitting inside support, or ranging between zones.
Settings Worth Knowing Before Use
The pivot detection sensitivity, the average volatility length used to size and measure zones, how thick each zone band is drawn, how close a new pivot needs to be to merge into an existing zone, how many zones are kept active at once, and every color used can all be adjusted from the indicator's settings panel to suit different instruments, timeframes, and personal preferences.
Disclaimer
This indicator is a technical analysis tool and does not constitute financial advice. Touch counts describe how many times price has historically reacted to a level, not a guarantee that it will do so again. All trading involves risk, and past reactions to a level do not guarantee future results. Always use proper risk management and combine this tool with your own analysis before entering any trade.
Original Script Declaration
Script Name: Advanced Support Resistance Zones
Author: Michael_Fx_Trader
Publisher: Michael_Fx_Trader
Rights: Copyright Michael_Fx_Trader. All rights reserved.
Originality Statement: This is an original work, designed and coded from scratch by Michael_Fx_Trader. The pivot clustering zone detection engine, which converges each zone's center using a running weighted average rather than ever expanding boundaries, the touch count based strength tracking, the automatic role reversal logic that flips a broken resistance zone into a support zone and a broken support zone into a resistance zone, the strongest zone highlighting system, and the live information dashboard were all independently conceived and implemented for this publication. No proprietary source code, private scripts, or copyrighted material belonging to any other author has been copied, mashed up, or reused in any part of this script.
Author Verification and Declaration: I, Michael_Fx_Trader, am the sole author and publisher of this script. I hold full authorship rights over its source code, its underlying logic, and its visual presentation. Support and resistance analysis using swing pivots is a well known, generic technical analysis concept not owned by any individual author; only the specific detection, clustering, scoring, and dashboard logic built around it here is original to this script.
www.tradingview.com Indikator
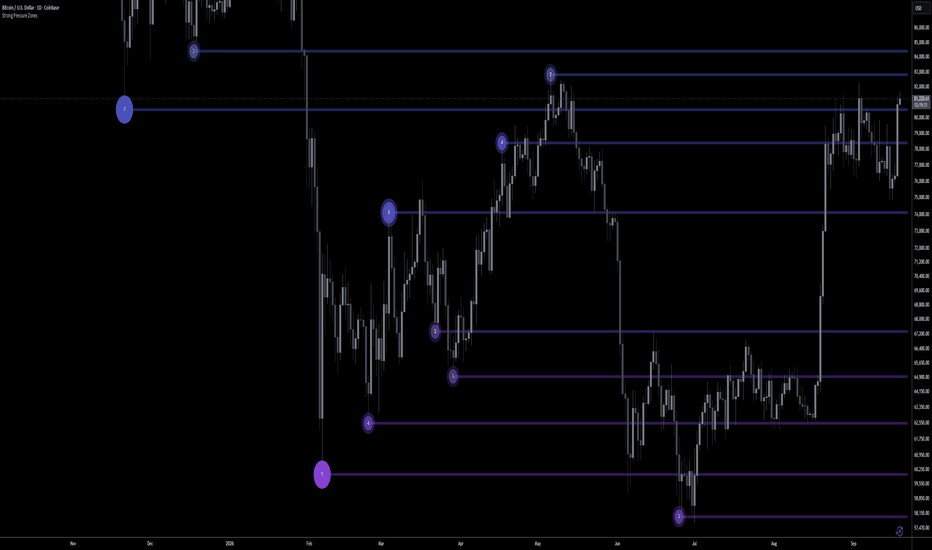
Strong Pressure Zones | ProjectSyndicateStrong Pressure Zones
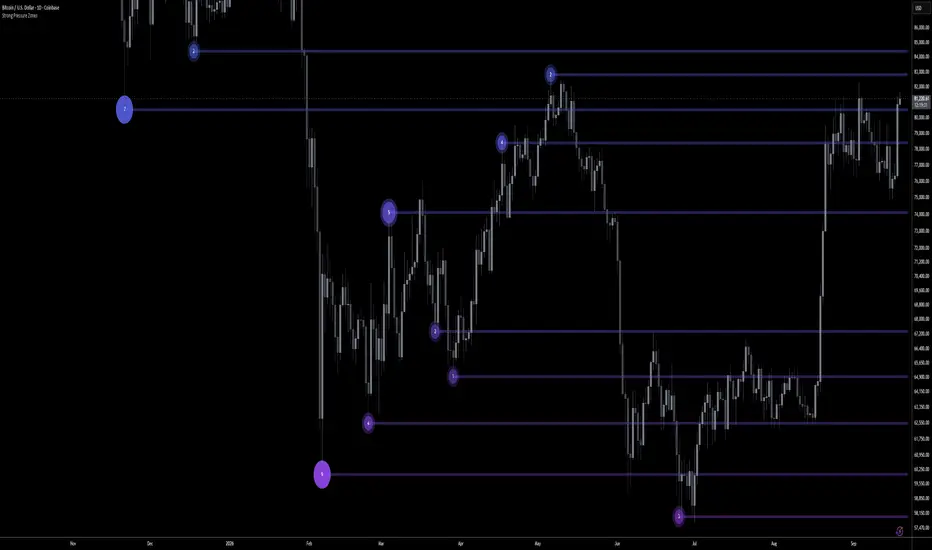
Strong Pressure Zones maps where market pressure is concentrated — then waits for the trap. Every swing pivot becomes a volume-weighted pressure pool, drawn as a round heat bubble sized by how much pressure sits there and stamped with a live 0–10 strength rank inside it. Then the engine watches for the one event that flips an ordinary level into a high-conviction reversal: a sweep of the zone (the liquidity grab) followed by a reclaim back through it (the failed break). A pressure pool swept below and reclaimed is a bear trap. A pool swept above and reclaimed is a bull trap. Your chart stays clean — bubbles, level bands and a number, nothing else — while the engine tracks every grab-and-reclaim underneath.
Most level tools trade the bounce or trade the break. This one grades the pressure behind the level, and trades the trap.
GBPUSD
🫧 Pressure Bubbles — the visual that carries the read
Each pressure pool is a filled circular bubble sitting on its level. Bubble size = pressure magnitude (volume × range concentrated there), so the heaviest pools are unmistakable at a glance. The number inside = live 0–10 strength. A soft glow halo gives every pool its heat. One look tells you where pressure is stacked, how heavy it is, and how strong the level rates — without reading a single line of text off to the side.
🌐 Pressure Fuel — native on every market, aggregated on BTC
On any symbol — Gold, Silver, Forex, Indices, Futures, stocks or crypto — pressure is measured from that market's own volume, so the read is correct everywhere out of the box. On Bitcoin pairs it goes a step further and aggregates Binance + Coinbase + Bitstamp into one deeper book, so BTC magnitude reflects the broader crypto tape instead of a single venue's slice. The switch is automatic: chart a BTC pair and the multi-exchange aggregation kicks in; chart anything else and it uses that instrument's native volume — nothing to toggle.
📊 Volume × Range Magnitude — real weight, not just a wick
A pool's magnitude is volume multiplied by the bar's range at formation — the classic footprint of a level where size actually traded and leveraged positions rest. Big participation on a wide bar builds a heavy pool; a thin, quiet pivot builds a light one. Magnitude is then ranked relative to the other live pools on your chart, so the heaviest pressure always reads at the top of the scale and the map re-ranks itself as new pools form.
🎯 The Reclaim Engine — the core
Each zone is treated as a pool of resting liquidity where the crowd parks its stops. A wick that pierces a zone border by your Min Sweep Depth is a sweep — a liquidity grab, not a normal touch. If price then closes back through the zone within the Reclaim Window, the breakout has failed: that's the reclaim, the contrarian event the whole tool is built around. Grab the stops, fail the break, reverse.
🟩🟥 Multi-Zone Pool — both sides, always live
Swing-low pivots build long-pressure pools below price (support); swing-high pivots build short-pressure pools above (resistance) — a full pool of levels tracked at once, not one per side. Overlap suppression keeps the read clean, a max-bubbles cap keeps it fast, and the oldest pools recycle automatically.
XTIUSD
🧲 Sweep vs. Hold — the separation that matters
A wick that dips into a zone and closes back inside is a hold — it strengthens the level (its retest count). A wick that pierces clean through it by the sweep depth is a grab. The engine never confuses the two, so a genuine liquidity raid is flagged the moment it happens.
♻️ Reclaim Confirmation — border, midline, or far side
Choose how far back through the zone price must close to confirm a reclaim: the near border (loose), the midline, or the far border (strict). Deeper confirmation means fewer, higher-quality reclaims. An optional RSI momentum-extreme filter only accepts a bullish reclaim while oversold and a bearish reclaim while overbought — strictly contrarian.
💥 Genuine Break & Flip — when it isn't a trap
If price accepts beyond the border — a decisive close through, or no reclaim inside the window — the level genuinely broke. The zone doesn't just vanish: it flips its side in place and becomes a breaker, ready for break-and-retest continuation.
⚡ Sweep-Defense Memory — defended levels get stronger
Every time a zone is swept, reclaims and holds, it logs a defended sweep and its strength rises. A pool that has trapped traders and survived is exactly the pool that matters — and the ranking reflects it. Defended counts persist; they never un-count to flatter the chart.
XAUUSD
🔢 0–10 Strength Ranking — printed inside every bubble
Each pool carries a live grade inside the bubble, blending its pressure magnitude (ranked against the other live pools) with defense quality — held retests, volume, rejection-wick depth and defended sweeps — with idle decay so stale, ignored levels fade back down. Magnitude is what makes a level matter even before it's tested; defense is what earns it the top of the scale. Set a strength floor and weak pools simply dim out, leaving only the levels that earned attention.
📏 Recent-Only Discipline — no stale rails from 90 bars ago
Pools older than your Max Level Age are removed, so the chart shows the pressure that's actually in play right now — not a graveyard of levels dragged forward as if they were still active. Widen it when you want deeper history; keep it tight for a pure recent read.
🎨 Fully Themed & Configurable
Vertical spectrum coloring by price height (the heat look) or clean by-side coloring (teal longs / magenta shorts); adjustable bubble size boost, score text size and number format; magnitude weight, contrast and lookback; strongest/weakest transparency and glow; thick level bands (width up to 10 so lines read as zones) with their own transparency, style and projection; plus the full detection, sweep/reclaim, strength-weight and decay controls.
🔒 Honest, Non-Repainting Core
Pools anchor to confirmed swing pivots — which, like all pivots, confirm a few bars after the fact; that is inherent, not a defect. A reclaim is evaluated on the reclaim bar's close and is fixed once that bar closes; on the live forming bar it can still flicker until close, as any close-based read does. Defended-sweep counts persist and never un-count. The 0–10 strength is a descriptive ranking framework for directing attention, not a backtested edge. Multi-exchange aggregation applies on BTC pairs; every other market ranks on its own native volume automatically.
NQ
🔔 Native Alerts
Proximity to a long/short pressure pool and to a strong pool, zone touch/retest, zone sweep (liquidity grab), zone break (accepted), and the headline events: Bullish Reclaim, Bearish Reclaim, and Any Reclaim.
🎯 Why this is different
Bounce tools fade every touch and get run over on the break. Breakout tools buy the break and get trapped on the reclaim. Strong Pressure Zones measures the pressure behind each level first, ranks the heaviest pools, then waits for the market to show its hand — the stop-raid and the failed break — and only then frames the reversal. You react to the trap, at the level that had the weight to matter.
🎯 How To Trade It — Two Approaches
Everything hinges on one read: did a heavy, high-strength pool just get swept and reclaimed?
◾ 1) Fade the trap — trade the reclaim (the core thesis)
Use when a large, high-strength pool is swept and price closes back through it.
▪️ Mark the strong pools (7+) — big bubble, high number. These are the levels with the weight worth defending.
▪️ Wait for the sweep: price wicks clean through the pool, grabbing the liquidity resting beyond it (Zone Sweep alert).
▪️ Trigger: price closes back through the pool within the reclaim window (Bullish / Bearish Reclaim alert). The breakout failed.
▪️ Entry: on the reclaim, in the reclaim's direction — long when a long-pressure pool is swept low and reclaims, short when a short-pressure pool is swept high and reclaims.
▪️ Stop: beyond the sweep extreme; if price re-breaks and accepts there, it was real acceptance, not a trap — stand aside.
▪️ Target: the opposite side of the pool first, then the next pool / unswept level in your direction.
⚖️ The cleanest version: a heavy long-pressure pool (big bubble, 8/10, already carrying a defended sweep) gets raided — price spears below it and stops out the longs — then snaps back and closes above it within a couple of bars on a volume surge, RSI stretched oversold. Grab, fail, reverse. That is the exact event this tool is built to frame.
◾ 2) Stand down — the map says wait
▪️ Clean acceptance, not a reclaim — price closed and held beyond the border (Zone Break alert). The level genuinely broke; don't fade it.
▪️ Light, weak pools only — small bubbles and low numbers everywhere means nothing heavy worth defending. Let structure develop.
▪️ No sweep yet — a pool being approached is not a pool being reclaimed. Wait for the grab and the close back through.
Rule of thumb: heavy pool + strong number + sweep + reclaim in the same direction → fade the trap toward the pool's far side. Genuine break/acceptance, light/weak pools, or no reclaim yet → stand down until the map agrees.
🚀 Markets & Timeframes
Works on every market, on any timeframe — Gold (XAUUSD), Silver, Forex, Indices, Futures, stocks and Crypto. The pressure-and-reclaim logic is symbol-agnostic: each instrument is ranked on its own volume, so you get the same clean read on gold, the DAX, EURUSD or an equity that you get on BTC. Bitcoin pairs additionally benefit from multi-exchange (Binance + Coinbase + Bitstamp) aggregation for a deeper pressure picture — applied automatically, nothing to switch. Where a symbol carries little or no volume, magnitude leans on range and the sweep-and-reclaim engine still works in full.
💡 Cleanest Setup
Raise Min Sweep Depth and set Reclaim Confirmation to Midline or Far Border for fewer, cleaner traps; keep Max Level Age tight so only live pressure shows; nudge Magnitude Weight toward 0.8 if you want size to dominate the ranking, or down toward 0.5 to reward defended levels more; and keep the RSI filter on when you want strictly contrarian reclaims. Indikator
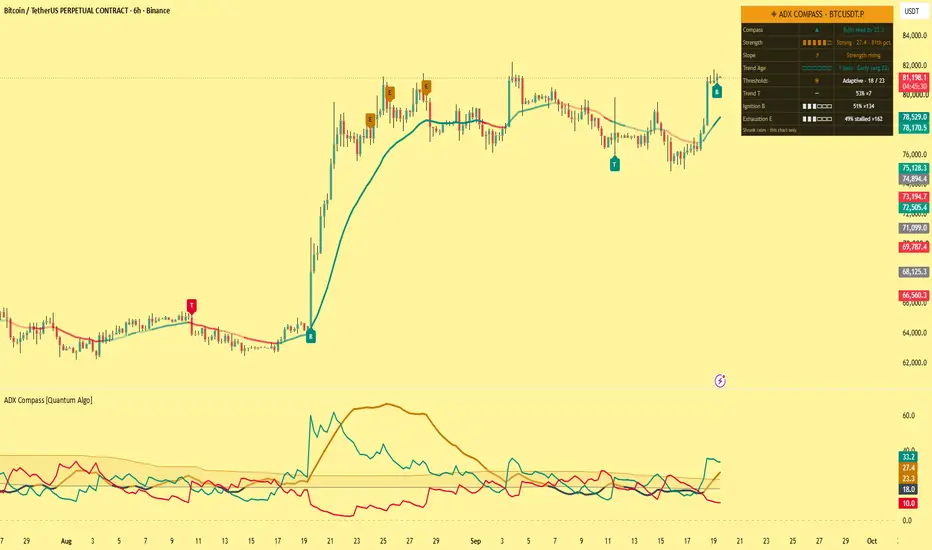
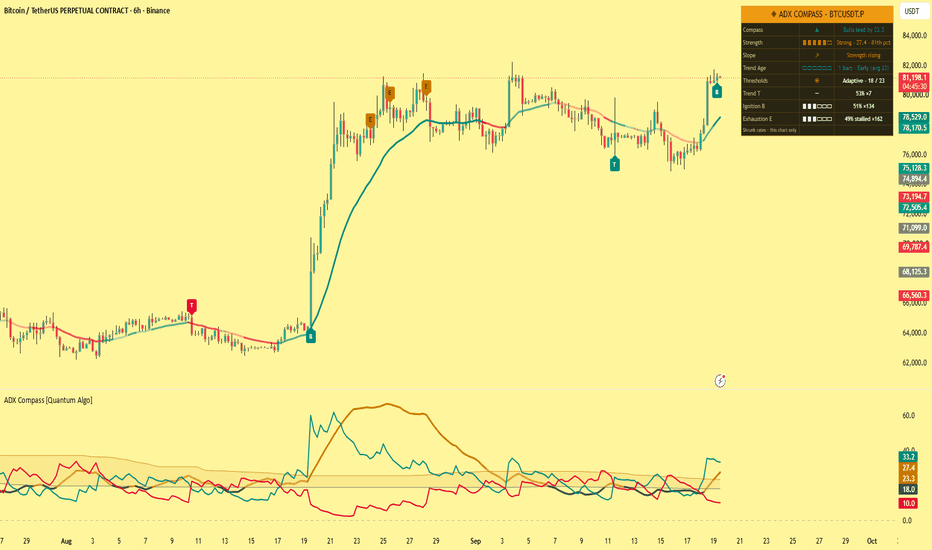
ADX Compass [Quantum Algo]ADX Compass
═══════════════════════════════════════════════
🔶 OVERVIEW
ADX Compass turns the Average Directional Index into an instrument you can steer by. It answers the four questions the raw index never answers cleanly: how strong is this trend for THIS symbol, which side is driving it, how old is it compared with this market's typical trend, and is it about to fail — and then paints the answers onto the price chart as a strength aura and a directional ribbon, so the reading lives on the candles.
The central upgrade is adaptive strength. Fixed levels like 20 and 25 mean different things on every symbol and timeframe. This tool ranks the index against its own recent history, so "weak" and "strong" are defined by the market you are actually looking at. On top of that it measures trend age against the symbol's own average trend lifespan, filters directional crosses by strength, detects exhaustion as the index turns from a strong peak, and scores each signal family on your exact chart.
═══════════════════════════════════════════════
🔶 WHAT IS THE ADX?
The Average Directional Index, created by J. Welles Wilder Jr., measures the STRENGTH of a trend without regard to its direction. It is derived from Directional Movement: +DI measures upward pressure, −DI measures downward pressure, and the index smooths the spread between them. A rising index means a trend — up or down — is gaining force; a falling index means it is losing force. Direction comes from which directional line is on top.
═══════════════════════════════════════════════
🔶 WHY FIXED ADX LEVELS FAIL
The traditional rule — above 25 means trending — was calibrated on the markets of its era. A quiet index may spend years rarely reaching 25 while a volatile pair lives above it in what is effectively a range. ADX Compass replaces the constant with a percentile rank inside the symbol's recent history: weak below the 30th percentile, building in between, strong above the 70th. The classic fixed levels remain available as a toggle, and the dashboard always shows the live thresholds in use.
═══════════════════════════════════════════════
🔶 WHY IS THIS ORIGINAL?
1. Adaptive strength ranking. Weak, Building and Strong are defined by the symbol's own distribution, never by a hard-coded number, with the live thresholds displayed.
2. Trend Age. When strength enters the strong zone a trend clock starts. Its reading is compared against the average lifespan of this symbol's recent trends and labeled Early, Mature or Late — a maturity gauge that warns before the index visibly rolls over.
3. Strength-filtered directional signals. The T family fires on a directional cross only when strength is already present and rising, removing the whipsaw crosses that make raw Directional Movement unusable in ranges.
4. Ignition and Exhaustion as first-class events. B marks the index breaking into its strong zone with the dominant side; E marks the index turning down from a strong peak — the earliest measurable sign a trend is losing force.
5. The reading on the price chart. A strength aura tints the background in the dominant side's color, intensifying with strength; a directional ribbon through price whose opacity IS the index — bold in strong trends, ghosted in chop.
6. Per-family statistics. Each family's ten-bar outcomes are tracked on your chart, shrunk toward neutral at small samples with a Wilson lower bound, and quoted in every signal's tooltip and on the dashboard.
═══════════════════════════════════════════════
🔶 HOW IT WORKS
— Directional Movement and the index are computed with Wilder's smoothing at configurable lengths.
— The index is ranked inside its history window to derive adaptive thresholds and the current percentile.
— A trend clock runs while strength is strong; completed trend lengths feed the average lifespan used for the maturity label.
— Signals are evaluated on confirmed bars: T on filtered directional crosses, B on strength ignition, E on a confirmed peak-turn in the strong zone.
— Every family feeds its own first-in-first-out outcome samples; the E family is scored on whether the trend actually stalled.
Signals do not repaint. All drawings are capped for performance.
═══════════════════════════════════════════════
🔶 HOW TO USE IT
— Trade the ribbon's opacity: bold ribbon and a full aura mean trend strategies are in their habitat; a ghosted ribbon means range tactics.
— Respect Trend Age: Early trends favor entries on pullbacks, Late trends favor tightening risk and taking profit; the E signal is the confirmation that a Late trend is failing.
— Use B as the regime trigger: strength ignition with the dominant side tells you a range just ended and which way.
— Read the family records before trusting a letter — they tell you how this symbol has historically honored each event.
— Works on all markets and timeframes; the adaptive thresholds recalibrate wherever you load it.
═══════════════════════════════════════════════
🔶 SETTINGS
— Directional Index: directional length, index smoothing, adaptive toggle, fixed levels, history window.
— Signals: visibility, cooldown.
— Statistics: sample cap, minimum samples, shrinkage strength, Wilson z-score.
— Visuals and dashboard: aura and ribbon toggles, ribbon length, full color and position control.
═══════════════════════════════════════════════
🔶 ALERTS
— Directional Cross — the directional lines crossed with strength present and rising.
— Strength Ignition — the index broke into its strong zone.
— Trend Exhaustion — the index turned down from a strong peak.
— Strong Trend Began — adaptive strength entered the strong zone.
═══════════════════════════════════════════════
🔶 FAQ
Q: Does it repaint?
A: No. Signals are evaluated on confirmed bars and never change once printed. The adaptive thresholds move slowly as the history window rolls, but past signals are not re-evaluated.
Q: Does the ADX show direction?
A: The index itself does not — it measures strength only. Direction comes from the directional lines, which this tool reads for you as the Compass row, the aura color and the ribbon color.
Q: Why does the ribbon fade?
A: Its opacity is tied to strength. A faint ribbon is not a bug — it is the tool telling you the trend has no force behind it.
Q: What does "Late" mean in Trend Age?
A: The current trend has already lasted longer than this symbol's average trend. It is not a sell signal; it is a maturity reading that raises the value of the exhaustion signal when it comes.
Q: What do the family percentages mean?
A: The share of past signals in that family after which price had moved favorably ten bars later (for E, the share after which the trend stalled), on the current symbol and timeframe, shrunk toward fifty percent at small samples. They describe history — they are not predictions.
═══════════════════════════════════════════════
🔶 CREDITS
The Average Directional Index, the Directional Movement system and the Average True Range are by J. Welles Wilder Jr. (New Concepts in Technical Trading Systems, 1978). The Wilson score interval is by Edwin B. Wilson (1927). The adaptive strength ranking, trend-age model, signal families, per-symbol statistics, on-chart rendering and all code in this script are original work — no third-party or open-source script code was reused.
═══════════════════════════════════════════════
🔶 LIMITATIONS
— The index is a smoothed, lagging measure; adaptive ranking sharpens its reading but cannot remove the lag.
— Trend Age needs several completed trends on the chart before the average lifespan is meaningful.
— Statistics describe the current chart's history only; past frequencies never guarantee future outcomes.
═══════════════════════════════════════════════
🔶 DISCLAIMER
This indicator is a research and charting tool provided for educational purposes. It is not financial advice, and nothing it displays is a recommendation to buy or sell any asset. Trading involves substantial risk of loss. Always do your own analysis and manage risk responsibly. Indikator
XAUUSD Ultimate Trading Suite - by Siwon Battambang CambodiaOverview :
This indicator is designed for XAUUSD (Gold) traders to identify high-probability swing pivots, institutional Order Blocks (Supply & Demand), Fair Value Gap (FVG) imbalances, dynamic Support/Resistance levels, intraday benchmark levels (Daily Open Price & Daily Pivot), and real-time short-term momentum shifts via a custom VWAP & EMA 9 Crossover Engine.
How It Works :
1. Swing Signals: Tracks price distance expansion ($15 move threshold by default) from local highs and lows to confirm true momentum shifts.
Double Diamonds: Signals major trend expansion when price moves across specified distance thresholds ($30 default).
2. Order Blocks & Dynamic S/R: Plots real-time supply/demand boxes and key support/resistance lines to help traders spot retest and rejection entries.
3. Fair Value Gaps (FVGs): Highlights market imbalances created during explosive price moves, providing high-probability re-entry and confluence zones.
4. Daily Open Price (OP) & Daily Pivot (P): Calculates key intraday benchmark levels directly on the chart to establish macro directional bias.
5. VWAP & EMA 9 Crossover Engine (New Feature): Plots real-time Volume Weighted Average Price (VWAP) and 9-period Exponential Moving Average (EMA 9) overlays. Crossovers trigger custom directional triangle arrows to signal early micro-momentum shifts:
Bullish Crossover (EMA 9 > VWAP): Plots a green triangle arrow below the candle bar.
Bearish Crossover (EMA 9 < VWAP): Plots a red triangle arrow above the candle bar.
Adjustable Arrow Scaling: Includes a dynamic user setting in the Inputs menu (Tiny, Small, Normal, Large, Huge) allowing complete customization of visual size on mobile or high-resolution desktop screens.
6. Daily Open Price (OP) vs. Daily Pivot (P) Explained :
Daily Open Price (OP): The exact starting price of the current trading day. It acts as the ultimate line in the sand for intraday buyer vs. seller control.
Daily Pivot (P): The mathematical average of the previous day’s High, Low, and Close . It acts as a central mean-reversion magnet and dynamic support/resistance level.
Establishing Trend Bias with Confluence
Uptrend Bias: When price trades above the Daily Open Price and Daily Pivot, the market is structurally bullish. Traders should prioritize Buy signals, bullish VWAP/EMA 9 crossovers, and look for retests off Demand Order Blocks or Support lines.
Downtrend Bias: When price trades below the Daily Open Price and Daily Pivot, the market is structurally bearish. Traders should prioritize Sell signals, bearish VWAP/EMA 9 crossovers, and look for rejections at Supply Order Blocks or Resistance lines.
How to Trade
Use the signals as directional filters. First, establish macro trend direction using the Daily Open Price and Daily Pivot. Second, wait for price to pull back to a structural zone (Order Block, FVG zone, or S/R line). Finally, look for candlestick rejection wicks alongside an EMA 9 / VWAP crossover arrow to confirm momentum before entering trades.
Open-Source Code & Community Release
This script is published as fully Open-Source to contribute to the TradingView community. Traders and developers are free to inspect the dynamic swing-distance calculation logic, modify parameters, and adapt the code to their personal trading systems. Indikator

Momentum Range Flip @MaxMaseratiMomentum Range Flip
Momentum Range Flip flags a body-close breakout candle, then tracks how far price runs from it before reversing back through the origin. While the range is open, it splits the volume traded inside it into estimated buy and sell volume per price level, then sorts those levels into a Point of Control, High Volume Nodes, and Low Volume Nodes.
─── RANGE ANCHOR AND EXPANSION ───
A momentum candle closes above the prior high or below the prior low, checked only on confirmed bars. Immediate Body Close anchors on that candle; Wait for NBC waits for one inside/balance candle to close first, then anchors back to the breakout candle. Once anchored, the range top and bottom track the highest high and lowest low seen so far. Expansion Method sets whether those bounds update live, tick by tick, or only on candle close. A close back outside the range in the opposite direction ends it.
─── DELTA VOLUME PROFILE, POC, HVN, AND LVN ───
Each bar inside the range splits its volume into buy and sell using:
buy % = clamp(0.5 + body-to-range ratio × 0.3 − wick ratio × 0.1, 0.1, 0.9)
That split is spread across price bins sized by Ticks per Bin. The single bin with the highest total volume becomes the Point of Control (POC). Any other bin at or above the HVN Threshold percent of that top bin is a High Volume Node — a price level heavy trading defended. Any bin at or below the LVN Threshold percent is a Low Volume Node — a price level trading passed through fast, with little resistance. POC, HVN, and LVN each have their own show/hide toggle and line width, so you can isolate any one layer.
─── HOW TO USE ───
1. Wait for the wedge box to appear — this marks a new momentum range, colored by its bullish or bearish bias.
2. Read the RH / RH TGT and RL / RL TGT labels for the current top and bottom of the range.
3. Find the thickest line — that is the POC, the price level with the most volume traded inside the range.
4. Check the High Volume Node lines for other price levels where volume built up; these tend to act as support or resistance if price returns.
5. Check the Low Volume Node lines for gaps in volume; price tends to move through these fast rather than stall.
6. A candle closing beyond the top or bottom line ends the range; treat that as invalidation of the current bias.
─── SETTINGS ───
Calculation Logic — choose the anchor trigger (Immediate vs Wait for NBC) and the expansion method (Live vs Wait for Candle Close).
Colors and Style — wedge fill transparency, bullish/bearish colors, extension line width.
Structure Targets — how far the target lines and labels extend, and their label size.
Delta Volume Profile and POC — toggle the profile, set bin size (Ticks per Bin) and max profile width, then independently toggle and set the line width for POC, HVN (with its own volume threshold), and LVN (with its own volume threshold). Buy/sell colors apply across all three.
─── NOTES ───
In Live (Tick-by-Tick) mode, the range bounds and volume profile update using unclosed, live wick prices and can shift before the bar closes. Switch to Wait for Candle Close for calculations that only use confirmed values. The buy/sell volume split is an estimate based on candle structure, not real order flow data. HVN and LVN thresholds are relative to the biggest bin in the current range, not a fixed volume number. Built for intraday futures charts (ES, NQ) but works on any liquid symbol with volume data. Indikator

TrendLock | Multi-Timeframe Supertrend Donchian BreakoutStrategy Explanation
TrendLock combines three independent confirmations before it will ever open a trade: a primary Supertrend for local trend direction, a higher-timeframe Supertrend that must agree before entries are allowed, and a Donchian channel breakout that times the actual entry once both trend layers align. A volume-spike filter adds a final check that real participation is behind the move, not just drift.
The idea is simple: most Supertrend scripts fire on every local flip and get chopped up in ranges. TrendLock only engages when the bigger picture and the immediate price action are both pointing the same way, and only pulls the trigger on a genuine breakout — not just a trend-line touch.
Exits are ATR-based (stop and target sized off current volatility, not fixed percentages), with an optional early exit if the primary Supertrend flips against the position.
Features
Dual-timeframe Supertrend agreement filter (toggle on/off)
Donchian channel breakout entry trigger, plotted with a shaded channel
Volume-spike confirmation filter
ATR-based stop loss and take profit
Optional trend-flip exit independent of the stop/target
Long-only, short-only, or both-direction modes
Background tint shows HTF/LTF agreement at a glance
Built-in alert conditions for long and short signals
Tips
Pick an HTF meaningfully above your trading timeframe (e.g. 15m chart → 4H filter, 1H chart → 1D filter). Too close and the filter does nothing; too far and setups become rare.
Test the HTF filter on and off separately — it should reduce trade count and whipsaws, not just trade count.
Donchian lookback and ATR lengths interact: a longer Donchian window means fewer, larger breakouts, so widen your ATR stop/target multipliers accordingly.
Try disabling the volume filter on lower-liquidity assets, where volume data can be noisy or unreliable.
Backtest across several unrelated symbols and timeframes using the same input values — if it only works on one chart, the settings are likely overfit rather than a real edge.
Warnings
This is a backtesting and research tool, not financial advice — past performance in the Strategy Tester does not predict future results.
request.security calls for the HTF Supertrend can behave differently between the visible chart and actual live execution; always forward-test on a paper account before risking real capital.
Breakout strategies are prone to false starts in choppy markets even with trend filters — expect a real losing-streak tail in the backtest, not just the equity curve's best stretch.
Commission, slippage, and order-fill assumptions in the Strategy Tester are approximations; verify against your actual broker/exchange fee schedule before sizing a live position.
The HTF filter and volume filter are optional and default to specific settings — review every input before deploying, don't assume the defaults suit your instrument or timeframe.
Strategi

Fisher Transform of Williams %R - DivergenceFisher Transform of Williams %R — Divergence
Overview
This indicator applies John Ehlers' Fisher Transform to Larry Williams' %R oscillator, then layers a pivot-based regular/hidden divergence engine and a Fisher/Trigger crossover signal on top of it. The goal is to combine the sharp, well-defined turning points that the Fisher Transform produces with the momentum context of Williams %R, so that reversals show up as cleaner, more clearly separated peaks and troughs than the raw oscillator gives you — and then to automatically flag price/oscillator divergences at those points.
Credits
The Fisher Transform is a statistical technique introduced to trading by John F. Ehlers (see his paper "Using The Fisher Transform," Stocks & Commodities magazine). It converts an oscillator's probability distribution into a roughly Gaussian (bell-curve) distribution, which sharpens turning points and reduces the ambiguity that flat, range-bound oscillator readings normally produce.
Williams %R is a momentum oscillator developed by Larry Williams, measuring the current close relative to the high-low range over a lookback period.
This script normalizes Williams %R to a 0–1 range and runs that normalized value through Ehlers' Fisher Transform formula, rather than applying the transform to raw price or to a different oscillator. The divergence engine, cross-signal logic, zone filtering, and signal-spacing controls are original additions built for this script.
How it works
Williams %R is calculated over Williams %R Length bars: 100 × (source − highest high) / (highest high − lowest low).
That value is normalized to a 0–1 range using the highest/lowest %R over Fisher Transform Length bars, then rescaled to −1…+1.
The normalized value is smoothed (0.66 × normalized + 0.67 × previous) and clamped to ±0.999 to keep the Fisher formula well-defined.
The Fisher Transform is applied: 0.5 × ln((1+x)/(1−x)) + 0.5 × previous Fisher value. This is the plotted "Fisher %R" line.
A one-bar-delayed copy of the Fisher line acts as the Trigger line, used for crossover signals.
Divergence detection: the script finds confirmed pivot highs/lows on the Fisher line (using Pivot Left/Right Lookback), then looks back within a Min/Max Lookback Range window for a prior pivot of the same type to compare against price:
Regular Bullish: price makes a lower low while Fisher makes a higher low (potential reversal up).
Hidden Bullish: price makes a higher low while Fisher makes a lower low (trend continuation up).
Regular Bearish / Hidden Bearish: mirror logic on pivot highs.
Cross signals: independent triangle markers plot whenever the Fisher line crosses above/below its own Trigger line — a faster, divergence-independent momentum confirmation.
Parameters
Williams %R Length — lookback for the base %R calculation; shorter = more responsive, noisier.
Fisher Transform Length — lookback used to normalize %R before the transform; controls how "stretched" the Fisher output is.
Source — price input for %R (default close).
Overbought / Oversold Level — Fisher levels used for the background zone and, optionally, to filter divergence signals.
Pivot Left/Right Lookback — bars required on each side to confirm a swing high/low on the Fisher line; larger values = fewer but more reliable pivots.
Max/Min Lookback Range — bar-distance window searched for a comparable prior pivot when checking divergence.
Min Bars Between Same-Type Signals — cooldown to suppress rapid repeat signals of the same type.
Show Regular/Hidden Divergence — toggle each divergence class independently.
Require OB/OS Zone for Divergence — when on, only fires divergence signals when the relevant pivot is inside the overbought/oversold zone, cutting down low-quality mid-range signals.
Show Fisher/Trigger Cross Signals — toggle the crossover triangles.
Color inputs — purely visual, no effect on signal logic.
How to use it
Watch the Fisher line relative to the Trigger line and the OB/OS zone the way you would any oscillator, but expect sharper, more decisive turns than plain Williams %R.
Solid divergence lines/labels ("Reg Bull," "Reg Bear") mark classic reversal-warning divergences; dashed ones ("Hdn Bull," "Hdn Bear") mark continuation divergences, useful for adding to an existing trend rather than fading it.
Triangle cross signals can be used as a faster, standalone trigger, or as confirmation once a divergence has printed.
All four divergence types and both cross directions have built-in alertcondition() calls, so alerts can be set directly from the "Create Alert" dialog without any manual configuration.
What it solves / how it differs from other tools
Plain Williams %R divergence detection is noisy because %R saturates near ±100 across a wide range of price action, blurring pivots. Running it through the Fisher Transform first compresses that noise into sharper, more Gaussian-shaped peaks, giving divergence detection a cleaner signal to work from than a raw-oscillator approach.
Unlike many public Fisher Transform scripts (which typically transform price directly, or transform RSI/Stochastic), this one is specifically built on Williams %R, giving a different — often earlier — read on exhaustion at range extremes.
The zone filter and same-type signal cooldown are both configurable, letting users trade off signal frequency against signal quality, which many divergence scripts don't expose.
Notes / Disclaimer
This indicator is a technical analysis tool and does not constitute financial advice. It repaints only in the sense that divergence lines/labels are drawn after pivot confirmation (lbR bars after the pivot bar), which is standard for any pivot-based divergence tool and is by design — the underlying Fisher/Trigger plot values themselves do not repaint. As with any oscillator, past signals do not guarantee future performance; test and combine with your own risk management before live use.
Indikator

MACD & RSI Long/Short IndicatorThis indicator generates momentum and trend-reversal alerts by combining standard MACD crossovers with RSI extreme zone breakouts. It relies on an internal state machine and an adjustable signal cooldown timer to filter out market noise and prevent rapid, repetitive entries on lower timeframes.
Core Logic & Indicators
RSI (Relative Strength Index): Triggers LE when crossing above the user-defined oversold line and Short signals when crossing below the overbought line.
MACD: Triggers LE and SE alerts based on the crossover of the MACD line and the Signal line.
EMAs: Plots customizable Moving Averages (9, 21, 50, 100, 200) strictly for visual trend context. EMAs do not dictate trade entries or exits.
Key Features
Modular Signal Routing: Independently toggle RSI or MACD Alerts. When both are enabled, the script executes based on whichever indicator fires first.
Signal Cooldown: A customizable bar delay limits how quickly a new signal can trigger after a previous execution, minimizing false Alerts in choppy conditions.
State Machine Guardrails: Enforces a strict 1-LE / 1-SE alternation rule to prevent multiple overlapping orders in the same direction.
Risk Management: Includes native percentage-based Stop Loss (SL) and Take Profit (TP) parameters.
Date Range Filter: Allows users to restrict execution to specific calendar periods.
How to Use
Select your preferred signal source (RSI, MACD, or both) in the settings panel. Adjust the "Signal Cooldown" parameter based on your specific chart timeframe to filter out immediate whipsaws (higher timeframes may require shorter cooldowns). Use the Enable LE/SE checkboxes to test directional bias independently, and calibrate the percentage inputs to establish your SL/TP risk framework. Indikator
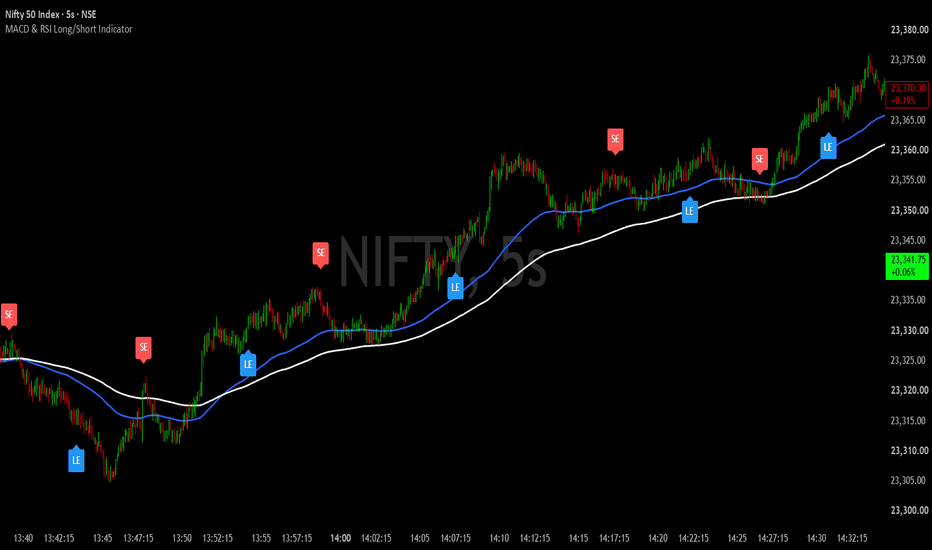
Strategi

THMATHMA MTF
This indicator plots the Triangular Hull Moving Average (THMA), a smooth and responsive moving average based on the Hull concept. The formula follows the standard THMA definition used across multiple public TradingView scripts and libraries:
THMA = WMA( 3*WMA(src, L/3) - WMA(src, L/2) - WMA(src, L), L )
The idea behind THMA comes from the broader Hull Moving Average family, adapted with a triangular weighting scheme to reduce lag while keeping the line smooth. This implementation is my own Pine Script version, built from publicly available documentation and open-source THMA scripts on TradingView.
Features:
- Source and length are configurable (default length: 21).
- Line color changes depending on price position:
- Green when close is above THMA.
- Red when close is below THMA.
- Optional higher timeframe mode: you can calculate THMA on a higher timeframe (e.g., 5 min, 15 min, 1h) and display it on your current chart.
Use it as a trend filter or dynamic support/resistance level. As with any indicator, it’s best combined with your own price action and risk management rules. Indikator

EMA200 REGIME + BOS/CHoCH + 2x FVG StrategyEMA200 Regime + BOS/CHoCH + 2x FVG Strategy
Overview
EMA200 Regime + BOS/CHoCH + 2x FVG Strategy is a rule-based TradingView strategy designed primarily for 2-minute intraday trading.
The strategy combines four core concepts:
EMA200 directional regime
Market Structure: BOS and CHoCH
Two-FVG confirmation logic
Limit entry at 50% of the body of the signal candle
The main objective is to identify continuation or reversal setups that develop while price remains on the correct side of the EMA200.
Unlike a simple EMA crossover strategy, the EMA200 is used mainly as a directional regime filter. A crossover activates either LONG or SHORT mode, but the strategy still requires market structure and Fair Value Gap confirmation before an entry can be created.
This script is a full strategy() implementation and is intended for use with TradingView's Strategy Tester.
1. EMA200 Regime Logic
The EMA200 determines the allowed trading direction.
SHORT regime
A SHORT regime begins when price crosses the EMA200 from above to below.
The regime remains active as long as price continues to close below the EMA200.
A SHORT regime is cancelled when:
Close > EMA200
A wick above the EMA200 alone does not necessarily invalidate the regime when structure confirmation is based on candle close.
During an active SHORT regime, the strategy searches for:
bearish BOS or bearish CHoCH
bearish 2x FVG
a valid signal candle
a retracement to the calculated limit-entry price
LONG regime
A LONG regime begins when price crosses the EMA200 from below to above.
The regime remains active while price closes above the EMA200.
The LONG regime is cancelled when:
Close < EMA200
During the active LONG regime, the strategy searches for:
bullish BOS or bullish CHoCH
bullish 2x FVG
a valid signal candle
a retracement to the limit-entry price
Important
The EMA regime does not expire after a fixed number of candles.
For example, if price remains below the EMA200 for 40 candles on the 2-minute chart, the SHORT regime may remain active for the entire period.
This is intentional.
The time limit applies to the relationship between the market-structure event and the 2x FVG confirmation, not to the EMA regime itself.
2. Market Structure
The strategy uses confirmed swing highs and swing lows to detect market-structure breaks.
Swing sensitivity is controlled by:
Swing Length
The default value is:
5
The script uses confirmed pivots and therefore does not require future data beyond the normal pivot-confirmation process.
3. BOS — Break of Structure
A bullish structure break occurs when price breaks above the most recent valid swing high.
A bearish structure break occurs when price breaks below the most recent valid swing low.
The user can select whether a structure break is confirmed using:
Close
Wick
The default setting is:
Close
This means that by default a wick through a swing level is not enough. The selected confirmation source must actually break the swing level.
Bullish BOS
If the current market structure is already bullish and another swing high is broken, the event is classified as:
Bullish BOS
Bearish BOS
If the current market structure is already bearish and another swing low is broken, the event is classified as:
Bearish BOS
4. CHoCH — Change of Character
CHoCH represents a break against the previously established market-structure direction.
Bullish CHoCH
If the previous structure was bearish and price breaks a valid swing high, the strategy classifies the event as:
Bullish CHoCH
Bearish CHoCH
If the previous structure was bullish and price breaks a valid swing low, the event is classified as:
Bearish CHoCH
The structure engine also handles newly confirmed pivots that may already have been broken by the time the pivot becomes confirmed.
This helps keep the strategy's BOS/CHoCH logic consistent with the structure displayed on the chart.
5. Fair Value Gap Definition
The strategy uses a classic three-candle FVG definition.
Bullish FVG
A bullish FVG exists when:
low > high
This means that the current candle's low is above the high from two candles earlier.
The gap is located between:
high and low
Bearish FVG
A bearish FVG exists when:
high < low
The gap is located between:
high and low
An optional minimum FVG-size filter can also be enabled.
The minimum size can be expressed in:
points
ticks
6. 2x FVG Logic
The strategy does not simply count every two consecutive FVG labels as a valid 2x FVG.
Instead, same-direction FVGs are grouped into clusters.
For example, several bullish FVGs that overlap each other can be treated as part of the same imbalance cluster.
A new same-direction FVG that does not overlap the existing cluster, while still occurring within the allowed number of bars, creates the second imbalance required for the:
2x FVG condition
The maximum allowed distance is controlled by:
Max bars between FVG
Default:
5
This approach is intended to prevent several overlapping gaps from being incorrectly counted as multiple independent imbalances.
7. Matching BOS/CHoCH With 2x FVG
During an active EMA regime, the strategy remembers the most recent valid structure event and 2x FVG event in the same direction.
For SHORT:
bearish BOS or bearish CHoCH
bearish 2x FVG
For LONG:
bullish BOS or bullish CHoCH
bullish 2x FVG
The two events must occur within the user-defined setup window.
Default:
Max bars: BOS/CHoCH ↔ 2x FVG = 15
On a 2-minute chart this represents a maximum separation of approximately:
30 minutes
Importantly, the two conditions do not have to occur in one fixed order.
Both sequences may qualify:
BOS/CHoCH → 2x FVG
or:
2x FVG → BOS/CHoCH
The script compares the distance between the two events.
If they are sufficiently close, the setup becomes:
SETUP READY
8. Signal Candle
Once the structure condition and 2x FVG condition have both been completed, the strategy waits for the next candle to close.
That candle becomes the:
Signal Candle
The strategy does not enter during an unfinished signal candle.
This avoids using information that would not have been known at the time.
9. Entry Price
The entry is calculated from the body of the signal candle.
The formula is:
Entry = (Open + Close) / 2
This is the midpoint of the candle body.
It is not:
(High + Low) / 2
After the signal candle closes, the strategy submits a LIMIT order at this body midpoint.
Example:
Open:
25,020
Close:
25,000
Entry:
25,010
The entry price is fixed after the signal candle closes and is not moved afterward.
10. Limit Order Validity
The market must retrace back to the calculated 50% body level.
The pending order remains valid for:
LIMIT Entry Validity Bars
Default:
5
If price does not reach the entry level during this period, the pending setup expires.
Importantly, expiration of the individual setup does not cancel the entire EMA regime.
For example:
price remains below EMA200
SHORT mode remains active
one limit entry expires
the strategy can continue searching for a new bearish BOS/CHoCH + 2x FVG setup
11. Multiple Setups Inside One EMA Regime
The strategy can detect more than one trade during the same directional EMA regime.
Example:
Price crosses below EMA200
↓
SHORT MODE
↓
Bearish BOS + bearish 2x FVG
↓
Trade #1
↓
Trade closes
↓
SHORT MODE remains active
↓
New bearish BOS/CHoCH + bearish 2x FVG
↓
Trade #2
This continues until the directional regime is invalidated.
For SHORT:
Close > EMA200
For LONG:
Close < EMA200
12. GOLD Preset
When the selected market is:
GOLD
the default values are:
Take Profit: 20 points
Stop Loss: 10 points
Break-Even Trigger: +15 points
Break-Even Offset: 0
Example SHORT:
Entry:
3800
Stop:
3810
Target:
3780
Break-even activates when price reaches:
3785
The stop is then moved to the entry price when the default BE Offset is zero.
13. NASDAQ Preset
When the selected market is:
NASDAQ
the default values are:
Take Profit: 100 points
Stop Loss: 50 points
Break-Even Trigger: +50 points
Break-Even Offset: 0
Example SHORT:
Entry:
25,000
Stop:
25,050
Target:
24,900
Break-even trigger:
24,950
These values represent actual price points, not ticks.
14. CUSTOM Market Mode
The CUSTOM preset allows manual configuration of:
Take Profit
Stop Loss
Break-Even Trigger
Break-Even Offset
This allows the strategy to be tested on other instruments or with different risk parameters.
15. Break-Even Logic
Break-even is handled automatically.
SHORT
If price reaches:
Entry - BE Trigger
the stop is moved to:
Entry + BE Offset
With:
BE Offset = 0
the stop moves exactly to the entry price.
LONG
If price reaches:
Entry + BE Trigger
the stop is moved to:
Entry - BE Offset
Once break-even has been activated, the stop is not intentionally moved back to the original stop-loss level.
16. TP1
The strategy also calculates an intermediate TP1 level.
Default:
50% of the distance between Entry and final Target
Example NASDAQ:
Main Target:
100 points
TP1:
50 points
Example GOLD:
Main Target:
20 points
TP1:
10 points
By default TP1 can be used as a visual reference.
The optional:
Enable Partial TP1
setting allows part of the position to be closed at TP1.
The percentage is controlled by:
TP1 Quantity %
17. Position Visualization
Active trades can be displayed using a risk/reward style box.
The visual structure includes:
Stop area
Entry line
TP1 line
Break-even trigger line
Main target
Trade labels
The STOP area is displayed above a SHORT entry and below a LONG entry.
The TARGET area is displayed below a SHORT entry and above a LONG entry.
The visualization is intended to resemble the logic of TradingView's Long/Short Position drawing tool.
18. Trade Direction
The strategy supports three directional modes:
SHORT ONLY
Only bearish setups are traded.
LONG ONLY
Only bullish setups are traded.
BOTH
Both bullish and bearish setups are allowed.
Default:
BOTH
19. Recommended Timeframe
The strategy is designed primarily around the:
2-minute timeframe
A visual warning can appear if another timeframe is selected.
The script is not technically locked to 2 minutes, but changing the timeframe changes the meaning of parameters expressed in bars.
For example:
15 bars
represents:
30 minutes on 2M
75 minutes on 5M
225 minutes on 15M
Users should therefore retest all parameters when changing timeframe.
20. Debug Mode
Debug Mode can be enabled to inspect the internal setup process.
It can show events such as:
SHORT MODE
LONG MODE
SETUP READY
LIMIT CREATED
The debug table can also display the current state of:
timeframe
EMA regime
BOS/CHoCH confirmation
2x FVG confirmation
setup readiness
pending limit
active position
This is particularly useful when reviewing historical setups that appear visually valid but did not produce a trade.
21. Backtesting
This script uses:
strategy()
rather than:
indicator()
and is therefore designed for TradingView's Strategy Tester.
It includes:
fixed contract quantity
configurable date range
stop loss
take profit
break-even
optional partial TP1
limit entries
Strategy Tester trade statistics
The strategy also uses:
calc_on_order_fills = true
calc_on_every_tick = true
use_bar_magnifier = true
Bar Magnifier can improve the realism of historical order execution when lower-timeframe data is available.
However, historical backtests can never perfectly reproduce live execution.
22. Futures Margin Configuration
The strategy includes:
margin_long = 10
and:
margin_short = 10
This represents a 10% simulated margin requirement in TradingView's broker emulator.
This setting is included primarily so that futures contracts with a high notional value are not automatically rejected simply because the simulated account does not contain 100% of the contract's notional value.
This is a backtesting configuration only.
It does not represent a specific broker's real margin requirement.
23. Non-Repainting Principles
The strategy is designed to avoid using future information for its trading decisions.
Important rules include:
structure breaks are evaluated only using available information
pivots are used only after confirmation
the signal candle must close before its midpoint can be calculated
the limit order is created only after the signal candle has closed
historical entry prices are not moved backward to make the backtest look better
the script does not intentionally use lookahead data
A confirmed pivot naturally requires candles to form after the actual swing point. This is standard pivot confirmation and should not be confused with repainting.
24. Entry Sequence Summary
SHORT
Price crosses below EMA200
↓
SHORT regime becomes active
↓
Bearish BOS or bearish CHoCH
↓
Bearish 2x FVG
↓
Conditions must be within allowed setup distance
↓
Next candle closes
↓
Entry = 50% of signal candle body
↓
SHORT limit order
↓
Price retraces to entry
↓
Position opened
↓
SL / BE / TP management
LONG
Price crosses above EMA200
↓
LONG regime becomes active
↓
Bullish BOS or bullish CHoCH
↓
Bullish 2x FVG
↓
Conditions must be within allowed setup distance
↓
Next candle closes
↓
Entry = 50% of signal candle body
↓
LONG limit order
↓
Price retraces to entry
↓
Position opened
↓
SL / BE / TP management
25. Main Inputs
Market Settings
Market
Trade Direction
Contracts
GOLD TP / SL / BE
NASDAQ TP / SL / BE
CUSTOM parameters
EMA Settings
Show EMA200
EMA Length
EMA Color
EMA Width
Structure Settings
Enable BOS
Enable CHoCH
Swing Length
Structure Break Confirmation
Structure labels
Structure lines
FVG Settings
Enable FVG
Show FVG
Maximum bars between FVGs
Minimum FVG filter
FVG size
FVG units
FVG colors
2x FVG markers
Setup Settings
Max bars between BOS/CHoCH and 2x FVG
Pre-cross event lookback
Entry Settings
LIMIT Entry Validity Bars
Risk Management
TP1 position
Partial TP1
TP1 quantity
Same-bar historical BE behavior
Visual Settings
Position box
Trade labels
EMA regime background
timeframe warning
26. Intended Use
This strategy is intended as a structured framework for researching a specific intraday trading model based on:
trend regime + market structure + imbalance + retracement entry
It is particularly useful for studying whether BOS/CHoCH and multiple Fair Value Gaps provide meaningful confirmation after price establishes direction relative to the EMA200.
The purpose of the script is not to predict every market move.
It is designed to convert a discretionary chart-reading process into explicit and testable rules. Strategi
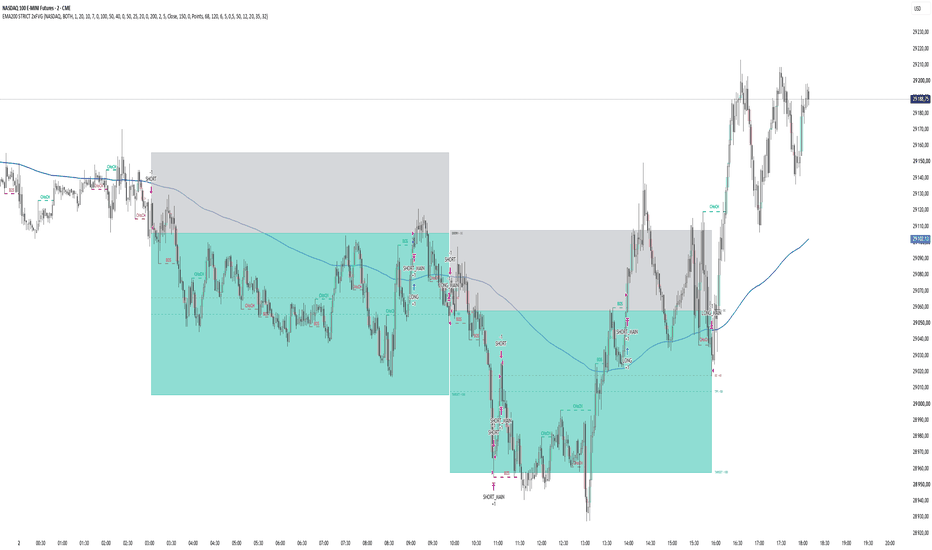
Monte Carlo Simulation BuilderMonte Carlo Simulation Introduction:
Monte Carlo simulation in the context of financial markets is an economic forecasting model that combines stochastics and probability theory to predict potential future price moves. The simulation uses price data that is already available to generate various future price paths. Once the price paths are generated, a probability distribution produces an interval containing the simulated price paths between the minimum and maximum future price returns and defines a mean price return as the most likely expected future price at the point in time defined by the time period utilized in the simulation.
Step-by-Step Guide on Applying the Monte Carlo Simulation Builder:
1. Choose an underlying symbol and timeframe to simulate: Every symbol that operates with price bars can be simulated. However, for a sufficient simulation, there should be enough bars in the historical period. A stock that just had its IPO some hours or days ago may not have the necessary number of historical bars for a sufficient simulation.
2. Define the Historical Bar Levels and Projected Bar Levels: For every simulation, the Historical Bar Levels and Projected Bar Levels can be chosen. A smaller amount of Historical Bar Levels would be sufficient for short-term and local trends (choosing a smaller amount of Historical Bar Levels would not be ideal for a long-term simulation). A higher amount of Historical Bar Levels would be more sufficient for middle-to-longer term analysis (Example: A 3-year simulation could be based on 10-year Historical Bar Levels).
3. Define the Number of Simulations and Path/Curves Display: In the Monte Carlo Simulation Builder, the Number of Simulations defines how many simulations will be calculated. The Path Transparency regulates how transparent the paths will appear in the simulation. A lower Path Transparency will show the simulated price paths in a higher color density. The Path Width regulates how thick the statistical interval curves of the Monte Carlo Simulation will be displayed. The Statistical Curves displayed can also be modified, including which curves should be shown and how thick the curves should be displayed.
4. Run the Simulation: Once the simulation is played, the visualization of the simulation defines a practical range of the most likely outcomes of the future price action considered for the underlying asset and time period. The Statistical Curves help to define possible outcomes. For example, the minimum curve can be used to calculate the maximum drawdown for the underlying period. You can efficiently modify the simulations and see if a similar range results from different assumptions.
4-Chart Split Screen Demonstration With 4 Selected Monte Carlo Simulations:
The Statistical Element Results Explained:
Current Price: Price from which the historical returns are calculated and from which the Monte Carlo Simulation will project the future return paths and statistical curves.
Timeframe: Current timeframe perspective for which the indicator uses the historical and predictive bar amounts. (Examples: Monthly timeframe = monthly bars used in simulation, Weekly timeframe = weekly bars used in simulation).
Historical Bar Levels = The number of historical returns represented as bars that are entered in the Monte Carlo Simulation Builder tab.
Projected Bar Levels = The number of future returns represented as bars that are projected in the Monte Carlo Simulation chart price action beginning from the current price.
Mean Return / Bar = The average historical logarithmic returns for all of the bar returns of the historical bar time period (Example: Daily average return of the historical bar time period when a daily timeframe is set).
Volatility / Bar = The historical sample standard deviation of log returns for all bars of the historical time period (Example: Total sample standard deviation of the historical weekly bars when weekly historical bar levels are set).
Historical Period Return = The actual price return of the historical period beginning set by the Historical Bar levels till the current price bar.
Maximum = Highest possible upper price return outcome implied by the Monte Carlo Simulation.
95th percentile = Price below which, on average, 95% of the expected upcoming price action predicted by the Monte Carlo Simulation will lie.
75th percentile = Price below which, on average, 75% of the expected upcoming price action predicted by the Monte Carlo Simulation will lie.
Mean = The most likely expected upcoming average price according to the Monte Carlo Simulation.
Median = Half of the expected upcoming prices will lie on or below this value according to the Monte Carlo Simulation.
25th percentile = Price below which, on average, 25% of the expected upcoming price action predicted by the Monte Carlo Simulation will lie.
5th percentile = Price below which, on average, 5% of the expected upcoming price action predicted by the Monte Carlo Simulation will lie.
Minimum = Lowest possible lower price return outcome implied by the Monte Carlo Simulation.
Mean Projected Return = The expected percentage return from the current price to the most likely expected upcoming average price (mean).
Probability > Current = The probability that the upcoming price return implied by the Monte Carlo Simulation will be higher than the current price.
Probability < Current = The probability that the upcoming price return implied by the Monte Carlo Simulation will be lower than the current price.
Summary
The Monte Carlo Simulation Builder is an ideal indicator to simulate future price returns by analyzing historical price returns. It helps traders and investors predict future price scenarios and set up a trading strategy that considers maximum drawdowns, average returns, and the highest possible profits based on historical price returns. By considering the probability of higher or lower prices in the future in comparison to the current underlying symbol price, traders and investors can set up their trading or investing strategy around the potential probabilities. Indikator
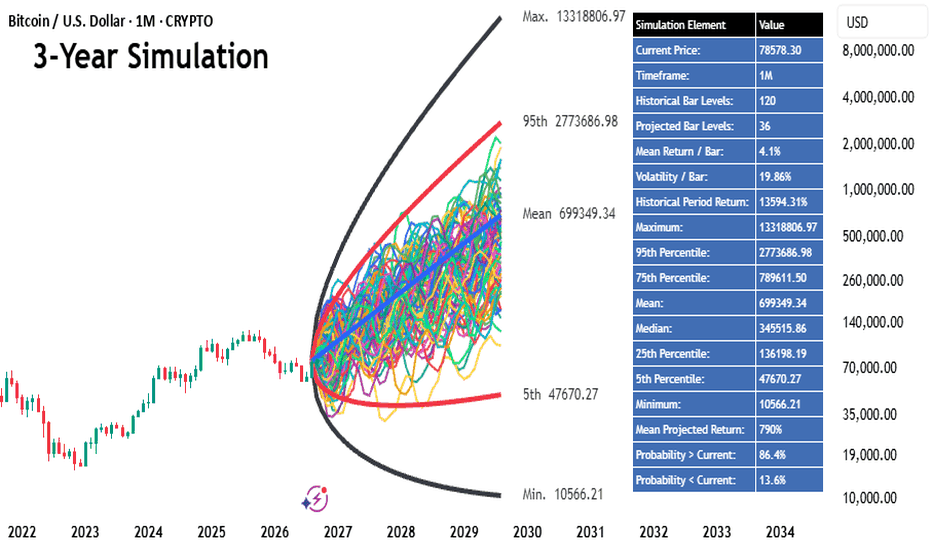
Confirmed Close MTPI SPXCONFIRMED CLOSE MTPI SPX
WHAT THIS IS
This is a trend indicator for the S&P 500. It answers one question: is the
index in an uptrend or a downtrend right now?
It does that by running twelve separate trend indicators at once and taking a
vote. Each of the twelve looks at the chart in its own way and says either
"up" or "down". The score you see is simply the average of those twelve votes.
All twelve agreeing up gives +1.00. All twelve agreeing down gives -1.00. Six
against six gives 0.00.
Because twelve votes average out, the score can only land on thirteen values,
one sixth apart: -1.00, -0.83, -0.67 and so on up to +1.00.
This approach is usually called a Trend Probability Indicator, or TPI. The
point is that no single indicator is reliable on its own. Any one of them will
whipsaw you. A group of twelve disagreeing with each other is information, and
the score tells you how much of that group agrees.
WHY "CONFIRMED CLOSE"
A lot of indicators change their mind while the current candle is still
forming, then change back before it closes. That is called repainting and it
makes an indicator untradeable, because the signal you acted on may not be
there an hour later.
This one does not do that. While today's candle is still open, the indicator
shows you yesterday's confirmed reading. The state only changes when a daily
candle actually closes. What you see is what you could have traded.
On an index this matters more than it does on a 24 hour market. A US equity
session runs for six and a half hours and the index can travel a long way
inside one of them. A reading taken at 11am is a reading of an unfinished
candle. This script will not give you one.
HOW TO READ IT
On the price chart:
- Candles are painted cyan while the score is above zero and magenta while it
is below. This is the state, at a glance.
- A cyan triangle with the word BULLISH below it marks the candle where the
score turned positive. A magenta triangle with BEARISH above it marks the
turn down. These are the moments that matter.
- Two moving averages, a 12 period and a 21 period EMA, are drawn as a
reference. They are a crude version of the same question and they are there
so you can see how much smoother the twelve indicator version is.
- Bars are tinted amber where the twelve indicator score and the simple 12/21
cross disagree. Those are the bars where the crude version would have put
you on the wrong side.
In the separate pane below:
- The stepped line is the score, from -1.00 to +1.00, filled to the zero line
and coloured by state.
- Dotted lines at +0.5 and -0.5 give you a sense of how strong the agreement
is. A score of +1.00 is twelve out of twelve. A score of +0.17 is seven
against five, which is a trend barely holding together.
The dashboard, bottom right by default:
- The big number is the current score, with the state next to it.
- The bar beside it is a gauge. It fills outward from the middle, right and
cyan for bullish, left and magenta for bearish.
- The twelve indicators are listed in two columns, the six trend-following
ones on the left and the six oscillators on the right, each showing its own
vote. This is where you see WHY the score is what it is.
- "12/21 agree" is the share of days where the twelve indicator score and the
simple EMA cross pointed the same way, measured across all the history your
chart has loaded. Read it as a rough measure of how often the crude version
would have agreed with the careful one. It is measured against the raw cross
with no filtering, so treat it as an indication rather than a precise
statistic.
- "Regime" is how many days the current state has lasted. It turns amber below
eight days, because a trend that has not lasted eight days has a habit of
being noise.
A cyan and magenta pair was chosen on purpose rather than the usual green and
red. It separates on the blue and the red channel, so it stays readable with
red green colour blindness, and it tells this script apart from the others in
the set at a glance. If you would rather have green and red, there is a toggle
in the settings.
HOW TO USE IT
The simplest use is the one it was built for. When the score is above zero,
equities are in an uptrend and you hold them. When it is below zero, they are
not, and you do not. You act on the close, and you execute on the open of the
next session. Anything earlier is acting on a candle that has not finished
forming.
Set an alert if you do not want to watch it. The script exposes two alert
conditions, one for the turn up and one for the turn down, and both fire only
on a confirmed daily close.
Read the twelve rows when the score is near zero. A score of -0.67 that is
being held off the floor by two oscillators is a very different situation from
a -0.67 where the trend-following group is turning. The individual votes tell
you which one you are in.
THE WIDER SYSTEM THIS BELONGS TO
This indicator is one rung of a ladder. The idea is that you are always
holding the strongest available thing, and that the decision is made in steps
rather than all at once.
Step one. A TPI on the total crypto market cap. If it is positive, you stay in
crypto and you go to step two. If it is negative, you leave crypto and go to
step three.
Step two, only when crypto is bullish. An ETH/BTC ratio TPI decides which of
the two majors leads. From there a further layer of ratio TPIs compares mid
caps against whichever major won, and the ones that are outperforming get a
share of the book.
Step three, when crypto is bearish. A gold TPI. If gold is in an uptrend, that
is where the money sits.
Step four, when gold is not working either. This indicator. If equities are
trending up, that is the holding.
Step five, when nothing is trending. Cash, and a EUR/USD TPI decides whether
that cash is better held in euros or in dollars.
Each rung is its own TPI, built the same way: twelve indicators, one vote
each, tuned separately for that market. The ladder simply asks them in order.
This rung is the quiet one. In a long crypto bull market it never gets asked,
because the ladder stops at step one or two. It earns its place in the years
when crypto and gold are both dead and something still has to be held.
A SET, NOT A SINGLE SCRIPT
This is the fourth published piece of that set, after the total market cap, the
ETH/BTC ratio and gold. The remaining rung is built and running and will follow
as its own publication, reading the same way so you only have to learn the
layout once.
ABOUT THE SETTINGS
The twelve indicators and their periods are visible in the settings and in the
source. They were tuned for this specific market against a cleaned 12/21 EMA
reference on daily data from January 2023 onward, with regimes shorter than
eight days treated as noise and removed before the tuning was scored. The
symbol itself has daily history back to 2005 if you want to look further back.
Those numbers are right for the S&P 500. They are not automatically right for
anything else, and they are deliberately not the numbers the other scripts in
this set use. If you put this on another symbol, expect to retune. That is the
honest answer, and it is why each market in the set gets its own publication
rather than one script with a symbol dropdown.
Two of the twelve are read on a smoothed line rather than the raw one, which
is deliberate: the CCI is scored on its EMA 5 smoothing and the RSI on its
EMA 10. The Awesome Oscillator is scored on its raw line. Those choices are in
the code and commented.
HOW FAITHFUL THE REBUILD IS
Because seven of the twelve are rewritten from other people's published
formulas rather than called directly, the obvious question is whether they
behave the same. They do. Every one of the twelve votes was compared bar by bar
against the original indicator running on the same chart, across 5,365 daily
bars going back to May 2005. Zero disagreements on any of the twelve, and the
combined score matched on every single bar.
That check is worth repeating if you change a setting, and it is why each vote
is exposed as a hidden plot in the script rather than kept internal.
CREDIT WHERE IT IS DUE
Seven of the twelve components are reimplementations of open-source community
scripts, written from their published formulas so they could all live in one
indicator and be scored consistently. Full credit to the original authors:
- Gaussian Channel by DonovanWall
- Optimized Trend Tracker by KivancOzbilgic
- Awesome Oscillator v2 by KivancOzbilgic
- Hull Suite by InSilico
- SSL Channel by ErwinBeckers
- Coral Trend Indicator by LazyBear
- WaveTrend by LazyBear
The remaining five are standard: ALMA, CCI, RSI, Coppock Curve and the
Detrended Price Oscillator.
What is added here is the aggregation into a single score, the confirmed close
behaviour, the per indicator breakdown, the agreement measurement against the
reference, and the ladder logic this is built to serve.
LIMITATIONS AND A PLAIN WARNING
This is a trend indicator. It is late by design. It will not catch the exact
top or the exact bottom, and it is not supposed to. It will be wrong in a
sideways market, which is what the eight day regime warning is there to tell
you.
A negative reading does not mean the index is about to fall, and a positive one
does not mean it is about to rise. It reports what has already been happening.
Equities also carry something the other rungs do not: gaps. An index can close
on a confirmed uptrend and open several percent lower on news, and no daily
trend indicator will protect you from that. Size accordingly.
Nothing here is financial advice. It is a tool for reading a chart. Past
behaviour of any indicator tells you nothing reliable about the future. Do
your own work and size your positions so that being wrong is survivable.
Indikator

CQ_(9)_Phases Counter + Adaptive Projection v2================================================================================
CQ_(9)_Phases Counter + Adaptive Projection v2
FUNCTIONALITY DESCRIPTION AND USER MANUAL
Pine Script v6 | TradingView | Overlay indicator
================================================================================
TABLE OF CONTENTS
PART 1 - FUNCTIONALITY DESCRIPTION
1. Purpose and overview
2. Feature summary
3. How the script works (engine walkthrough)
3.1 ZigZag engine
3.2 ZigZag drawing (confirmed / unconfirmed / active legs)
3.3 Adaptive Projection engine
3.4 Leg (phase) numbering engine
3.5 Phase Statistics table engine
3.6 Table padding frame
4. Data model (internal arrays and state)
5. Repainting, timing and performance notes
PART 2 - USER MANUAL
6. Quick start
7. Setting up the phase counter (anchors) step by step
8. Settings reference (every input, by group)
9. Reading the chart
10. Reading the Phase Statistics table (every metric explained)
11. Recommended workflows
12. Troubleshooting and FAQ
13. Known limitations and behaviors worth knowing
14. Glossary
################################################################################
# PART 1 - FUNCTIONALITY DESCRIPTION
################################################################################
--------------------------------------------------------------------------------
1. PURPOSE AND OVERVIEW
--------------------------------------------------------------------------------
This indicator turns raw price action into a structured "phase" map. It:
a) Builds a ZigZag of alternating swing highs and swing lows using a single
lookback period.
b) Draws the ZigZag legs on the chart, with the two most recent legs styled
differently from the settled history.
c) Numbers each leg 1-2-3-4-5 in a repeating cycle, anchored to a pivot whose
phase number YOU verify manually (one saved anchor per timeframe).
d) Projects a two-segment "adaptive" path forward from the current price,
based on the average size, slope and direction of all past legs on the
chart.
e) Displays a Phase Statistics table with per-leg metrics: direction,
high/low, growth, bars, retracement, velocity, comparison to averages,
ATR-normalized size, ratio to the prior leg, plus Fibonacci-style
retracement and extension price targets.
Everything is driven by ONE structural setting, the ZigZag Period. Changing it
changes the pivots, the numbering, the averages behind the projection, and every
number in the table.
The indicator is an analysis/visualization tool. It does not place orders, does
not generate alerts, and does not plot any series (the script ends with
plot(na), which only satisfies TradingView's requirement of having a plot).
--------------------------------------------------------------------------------
2. FEATURE SUMMARY
--------------------------------------------------------------------------------
- ZigZag with adjustable period (10-100, default 45)
- Three leg states, each with its own line style:
Confirmed (older, settled legs)
Unconfirmed (most recent completed pivot-to-pivot leg)
Active (live leg from the latest pivot to the current price)
- Optional circle markers at both ends of the Active and Unconfirmed legs
- Adaptive Projection: 2 dotted segments (continue current leg, then reverse)
- Phase numbering 1-5, repeating, forward and backward from a user anchor
- Separate saved anchors for 1H, 4H, 1D, 1W and 1M charts
- Manual or Automatic anchor-timeframe selection
- Six numbering glyph styles
- Label placement on the pivot or at the leg midpoint
- Anchor marker (anchor symbol) showing which pivot was snapped to
- Phase Statistics table, vertical or horizontal, 1-10 legs
- 40/50/60% retracement targets and 127.2/161.8/200% extension targets, with
"reached" markers
- Three cell coloring styles for the table
- Invisible padding frame to fine-tune table position on screen
--------------------------------------------------------------------------------
3. HOW THE SCRIPT WORKS (ENGINE WALKTHROUGH)
--------------------------------------------------------------------------------
3.1 ZIGZAG ENGINE
----------------------------------------------------------------------
Pivot detection uses the ZigZag Period (N):
A bar is a pivot HIGH candidate if its high is the highest high of the
last N bars.
A bar is a pivot LOW candidate if its low is the lowest low of the last
N bars.
The current direction (dir) is +1 (up) or -1 (down). Direction flips when a bar
is a pivot high but not a pivot low (dir becomes +1) or a pivot low but not a
pivot high (dir becomes -1). If a bar is both or neither, direction is kept.
Pivot storage:
- On a direction change, a NEW pivot is added at the front of the pivot list.
- If direction has not changed and a more extreme candidate appears (a higher
high in an up move, or a lower low in a down move), the CURRENT (front)
pivot is UPDATED in place (its price, time and bar index are replaced).
- The ATR(20) value at the moment a pivot is created or updated is stored
alongside it (used later for the xATR metric).
The pivot list is stored newest-first. Index 0 is the most recent pivot (the
start of the currently forming leg), index 1 the one before it, and so on.
Because the newest pivot can keep moving while price makes new extremes, the
most recent leg is not final until a new opposite pivot forms.
3.2 ZIGZAG DRAWING
----------------------------------------------------------------------
Whenever at least two legs' worth of data exists (4+ stored values), all
ZigZag lines are deleted and redrawn from the stored pivots:
- The most recent completed leg (pivot 1 -> pivot 0 pair) uses the
"Unconfirmed Leg Style".
- All older legs use the "Confirmed Style".
- Leg color: bullish color if the leg ended higher than it started,
bearish color otherwise.
- If "Mark Unconfirmed Leg Start/End" is on, two circle markers are placed at
that leg's endpoints, in the leg's color.
The ACTIVE leg is drawn on the last bar only: a line from the latest pivot to
the current close, using the "Active Leg Style". Its color is bullish when
close is above the latest pivot's price, otherwise bearish. If "Mark Active
Leg Start/End" is on, circle markers are drawn at both ends.
All lines are positioned by bar TIME (xloc.bar_time), so they align to the
chart regardless of scrolling.
3.3 ADAPTIVE PROJECTION ENGINE
----------------------------------------------------------------------
Step 1 - Collect statistics from EVERY leg in the stored pivot history:
For each leg the script records: length ($), slope ($ per unit time), and
duration (bars). Legs are separated into bullish and bearish groups.
It then computes: average bullish/bearish length, slope and bars.
Step 2 - Describe the live leg:
current_direction : +1 if close > latest pivot price, otherwise -1
current_length : |close - latest pivot price|
current_slope : (close - latest pivot price) / time elapsed
Step 3 - Build the projection from the current price:
Segment 1 ("finish the leg"):
If the current leg is shorter than the average leg length in the same
direction, draw a line continuing at the CURRENT leg's slope until the
leg would reach the average length. Color follows the current
direction.
Segment 2 ("reversal"):
Draw a line in the OPPOSITE direction using the average length and
average slope of past legs in that opposite direction. It starts where
Segment 1 ends.
If the current leg is ALREADY as long as or longer than the average,
Segment 1 is skipped and only Segment 2 is drawn, starting at the current
price.
Safety cap: the projection never extends more than 500 bars (of the chart's
timeframe) into the future, in total.
Only the projection lines from the latest bar are kept; earlier copies are
deleted each time the script recalculates.
3.4 LEG (PHASE) NUMBERING ENGINE
----------------------------------------------------------------------
Goal: label every pivot with a phase number 1-5 in a repeating cycle that
matches a numbering YOU have verified.
Inputs: for each supported timeframe (1h, 4h, 1d, 1w, 1m) there is an anchor
date/time and a phase number (1-5).
Selecting the active anchor:
- Manual mode: the "Anchor Timeframe (Manual)" dropdown decides which saved
anchor is used.
- Automatic mode: the script detects the chart's timeframe (must be exactly
60m, 240m, 1D, 1W or 1M) and uses that timeframe's saved anchor. On any
other timeframe there is no saved anchor and the counter stays silent.
The counter DISPLAYS only when the chart timeframe actually matches the active
anchor timeframe (tf_matches). Otherwise labels and anchor marker are hidden,
keeping other timeframes uncluttered.
Seeding (runs once, on the last bar, when at least 4 pivot values exist):
1. The script finds the stored pivot whose timestamp is closest to the anchor
date/time you entered ("snap to nearest pivot"). The newest pivot (the one
still forming) is excluded from this search.
2. That pivot receives the phase number you entered.
3. Pivots NEWER than the anchor count up (…, n, n+1, …, wrapping 5 -> 1).
Pivots OLDER than the anchor count down (…, n-1, n-2, …, wrapping 1 -> 5).
4. The result is stored in three parallel lists: bar time, price, number.
Auto-extension: after seeding, each time a new pivot becomes frozen (a newer
opposite pivot forms), the next number in the cycle is appended automatically.
You do not need to renumber by hand as the chart advances.
Label placement: each label is drawn on the last bar.
- "Pivot": label sits on the pivot itself.
- "Leg Midpoint": label sits halfway (in time and price) between that pivot
and the next numbered pivot. The newest label uses the live current price
as its far endpoint, so it drifts until the leg is confirmed.
Label colors: with Auto-Color on, the label text uses bullish or bearish color
according to whether the next pivot's price is higher or lower than this
pivot's price; the background is the same color faded by the Fade %. With
Auto-Color off, custom background and text colors are used.
Anchor marker: an anchor-symbol label is placed above (if the anchor pivot was
a high) or below (if a low) the anchor pivot, offset by 2x ATR(20). It shows
the anchor's phase number and timeframe, for example "anchor 5 1d".
3.5 PHASE STATISTICS TABLE ENGINE
----------------------------------------------------------------------
The table is rebuilt on the last bar. Legs shown = Active + Previous
(Unconfirmed) + (Legs Shown - 2) older confirmed legs, up to 10 total.
Each leg is a column (Vertical orientation) or a row (Horizontal). Column order
left to right (Vertical): oldest historical leg ... newest historical leg,
Previous (Unconfirmed), Active (Projected).
Per-leg metric sources:
- Historical legs: computed from fixed pivot-to-pivot data.
- Previous leg: computed from the leg's pivot window through the current
bar, plus live retracement information.
- Active leg: computed from the latest pivot through the current bar.
Full definitions of every metric are in Section 10.
Cell coloring is controlled by "Value Cell Style":
- White: flat background, flat text.
- Tendency Color: text colored by the leg's direction.
- Tendency Background: the cell background colored by direction with a flat
text color on top.
On the Rtd and Ext target rows, the direction color is INVERTED (a bullish leg's
targets are drawn in the bearish color and vice versa), because those targets
are prices price would reach by moving against (retracing) or beyond (extending)
the leg.
3.6 TABLE PADDING FRAME
----------------------------------------------------------------------
The table has an extra outer row above and below, and an extra column left and
right of the real content. Each of these four padding areas is a single merged,
fully transparent cell. Their sizes are user inputs (0-100). Since the table is
anchored to a chart edge or corner, growing a padding cell shifts the visible
content away from that anchor, giving fine position control beyond the nine
presets.
--------------------------------------------------------------------------------
4. DATA MODEL (INTERNAL ARRAYS AND STATE)
--------------------------------------------------------------------------------
z Pivot list, newest first, stored as pairs: . Index 0 = newest pivot price, index 1 = its time.
zbar Pivot bar indices, newest first.
zatr ATR(20) captured at each pivot, newest first.
leg_bar_arr / leg_price_arr / leg_num_arr
Numbered pivots, OLDEST first (opposite order from z). Filled at
seeding and extended as pivots freeze.
seeded true once the counter has been seeded.
last_recorded_bar bar index of the last pivot already numbered.
last_assigned_num the phase number given to that pivot.
anchor_*_saved memory of which pivot was snapped to (for the marker).
avg_bullish_length, avg_bearish_length
avg_bullish_slope, avg_bearish_slope
avg_bullish_bars, avg_bearish_bars
Averages used by both the projection and the table's
"vs Avg" metrics.
Drawing object pools (lines, labels, table) are kept in persistent
variables and deleted/recreated so old objects never pile up.
--------------------------------------------------------------------------------
5. REPAINTING, TIMING AND PERFORMANCE NOTES
--------------------------------------------------------------------------------
- The newest ZigZag pivot repaints by design: it moves as price makes new
extremes in the current direction. The most recent completed leg is
therefore labeled "Unconfirmed".
- Older pivots do not change unless you change the ZigZag Period.
- Labels, the projection, the table, the active leg and the anchor marker are
only (re)drawn on the last bar of the chart, so they update on each new
tick/bar of the latest candle.
- The script is limited to 500 lines and 500 labels. With very small ZigZag
Periods on long histories, the oldest legs may be dropped by TradingView.
- The projection average is calculated over the whole stored pivot history
each time a pivot is added, so it adapts as more legs form.
################################################################################
# PART 2 - USER MANUAL
################################################################################
--------------------------------------------------------------------------------
6. QUICK START
--------------------------------------------------------------------------------
1. Add the indicator to a chart on one of the supported timeframes:
1H, 4H, 1D, 1W or 1M.
2. Open Settings. Leave ZigZag Period at 45 for a first look.
3. Under "Leg Numbering", set "Anchor Timeframe Selection" to Automatic (so
the right saved anchor is used per chart), or leave Manual and pick the
matching timeframe.
4. Set the anchor date/time (Pivot anchor) and phase number for that
timeframe (see Section 7).
5. Look at the chart: ZigZag legs, numbered labels, a dotted projection from
the current price, and the Phase Statistics table at the bottom left.
6. Adjust colors, sizes and table position to taste.
If you see legs and the table but NO numbers, the chart timeframe does not
match the active anchor timeframe (see Troubleshooting, Q1).
--------------------------------------------------------------------------------
7. SETTING UP THE PHASE COUNTER (ANCHORS) STEP BY STEP
--------------------------------------------------------------------------------
The counter needs one reliable reference: "this specific pivot is phase N".
1. Decide which pivot you consider a known phase, based on your own analysis.
2. Note its date and time on that timeframe's chart.
3. In the "Leg Numbering" group, find the row for that timeframe, for
example "Pivot (1D)".
4. Enter the pivot's date/time in the date field.
5. Enter its phase number (1-5) in the small numeric box on the same row.
6. Make sure the active timeframe (Manual pick or Automatic detection) equals
the chart timeframe.
7. Enable "Mark Anchor Pivot". An anchor marker should appear above or below
a pivot. Verify it sits on the pivot you intended.
8. If the marker is on the wrong pivot, adjust the date/time to sit closer to
the intended pivot. The script always snaps to the NEAREST pivot in time.
Tips:
- The anchor only needs to be near the pivot in time, not exact to the bar,
but if two pivots are close together, be precise.
- Re-check the anchor if you change the ZigZag Period: a different Period may
produce different pivots, so the snapped pivot can change.
- Each timeframe keeps its own anchor. Setting the 1D anchor does not affect
the 4H anchor.
- The anchor pivot must exist in the loaded chart history. If you scroll too
little history or use a very large Period, the anchor pivot might not
exist, and the snap will pick the nearest one that does.
--------------------------------------------------------------------------------
8. SETTINGS REFERENCE (EVERY INPUT, BY GROUP)
--------------------------------------------------------------------------------
GROUP: Phases (ZigZag)
----------------------
Period (10-100, default 45)
ZigZag lookback in bars. Higher = fewer, larger, later-confirming legs.
Lower = more, smaller, faster legs. Drives everything else.
Bullish Leg / Bearish Leg (colors)
Colors for upward / downward legs, including the active leg and its
markers.
Confirmed Style (Solid/Dashed/Dotted) and Width (1-8)
Style for settled older legs. Width applies to ALL legs.
Active Leg Style (default Dotted)
Style of the live leg to the current price.
Unconfirmed Leg Style (default Dashed)
Style of the most recent completed leg.
Mark Active Leg Start/End + size (Tiny..Huge)
Circle markers at both ends of the Active leg.
Mark Unconfirmed Leg Start/End + size (Tiny..Huge)
Circle markers at both ends of the Unconfirmed leg.
GROUP: Adaptive Projection
--------------------------
Show Projection
Master switch for the two projection segments.
Bullish Projection / Bearish Projection (colors)
Colors for upward / downward projection segments.
Style and Width (1-5)
Line style and width for both segments (default Dotted, width 1).
GROUP: Leg Numbering
--------------------
Pivot (1H / 4H / 1D / 1W / 1M) - date/time + phase number (1-5)
The five saved anchors. Only the active timeframe's anchor is used.
Anchor Timeframe Selection (Manual / Automatic)
Manual: uses the dropdown below regardless of the chart.
Automatic: uses the chart's own timeframe (1h/4h/1d/1w/1m only).
Anchor Timeframe (Manual)
Which saved anchor to use in Manual mode. The counter displays only when
the chart is on this timeframe.
Mark Anchor Pivot
Shows the anchor marker on the snapped pivot.
Numbering Style
Glyph set for phase numbers: circled, filled circled, Roman numerals,
keycap emoji, subscript parentheses, or parenthesized. Rendering varies
by OS/browser/font.
Label Size (Tiny..Huge, default Huge)
Size of the number labels on the chart (not the table).
Auto-Color by Leg Direction
On: labels use the Bullish/Bearish Label colors below.
Off: labels use the custom colors below.
Bullish Label Color / Bearish Label Color
Also the bullish/bearish colors used throughout the Phase Statistics
table (tendency text, tendency background lookup, inverted target rows).
Custom Label Background Color / Custom Label Text Color
Used only when Auto-Color is off.
Label Background Fade % (0-100, default 90)
0 = opaque background, 100 = fully transparent (only the glyph shows).
Overrides any transparency of the picked colors.
Label Position (Pivot / Leg Midpoint, default Leg Midpoint)
Where each number sits relative to its leg.
GROUP: Phase Statistics Table
-----------------------------
Show Table
Master switch. Table appears once at least two pivots exist.
Orientation (Vertical / Horizontal)
Vertical: legs are columns, metrics are rows.
Horizontal: legs are rows, metrics are columns.
Position (nine presets)
Chart corner/edge anchor. Default Bottom Left.
Text Size (Tiny..Huge)
Table text. Single-line leg headers are always Normal size; the
Unconfirmed/Projected two-line headers follow this setting.
Header Background / Header Text
Colors for title bar, corner cell, leg headers and metric labels.
Cell Background / Cell Text
Value-cell colors for the White style, and the fallback otherwise.
Value Cell Style (White / Tendency Color / Tendency Background)
How value cells are colored (see Section 3.5).
Tendency BG: Bullish / Bearish / Text Color
Used only with the Tendency Background style.
Border Color
Grid line color. Use a transparent color for a borderless table.
Retracement Bar Glyphs
Four filled/empty glyph pairs for the 10-segment retracement bar.
Show Retracement Progress Bar
Adds a "Rtd %" row/column with the 10-segment bar.
Legs Shown (2-10, default 7)
Total legs displayed (Active + Previous + older).
Show Retracement % Targets
Adds Rtd 40%, 50%, 60% price targets per leg.
Mark Reached Retracement Levels + Reached Marker Glyph
Appends a marker (one of four glyphs) to a target price once price has
retraced at least that far.
Show Velocity, Show Size vs Avg, Show Bars vs Avg, Show ATR-Normalized Size
(xATR), Show Ratio to Prior Leg
Toggle the advanced metrics (Section 10).
Show Extension % Targets (127/162/200%)
Adds Ext 127%, 162%, 200% price targets per leg.
GROUP: Table Position Fine Tunning
----------------------------------
Four padding inputs (top, bottom, left, right; 0-100 each, default 0).
Adds invisible, merged, fully transparent space on that side of the
table so the visible content shifts away from its anchor corner.
Example: anchored Bottom Left, raising the bottom padding lifts the
table up; raising the left padding pushes it right.
--------------------------------------------------------------------------------
9. READING THE CHART
--------------------------------------------------------------------------------
ZigZag legs
Teal legs (default) go up; orange legs (default) go down.
Dashed = the most recent completed leg (may still shift).
Dotted = the live leg running to the current price.
Solid = older, settled legs.
Circle markers
Small circles mark the start and end of the Active and Unconfirmed legs.
Number labels
Each pivot/leg carries a 1-5 phase number. When Label Position is "Leg
Midpoint", the number sits mid-leg. The newest number drifts with price
until its leg is confirmed.
Anchor marker
Shows which pivot your anchor snapped to, with its phase number and
timeframe.
Projection
Dotted two-part line from the current price. Segment 1 = expected
continuation of the current leg to the average length; Segment 2 =
expected reversal by the average opposite-leg length and slope. It is a
statistical average of past behavior on this chart, not a forecast.
--------------------------------------------------------------------------------
10. READING THE PHASE STATISTICS TABLE (EVERY METRIC EXPLAINED)
--------------------------------------------------------------------------------
Column headers
- Historical legs: the leg's phase number (or "Leg-N" if not numbered).
- Previous leg: phase number + "Unconfirmed".
- Active leg: phase number + "Projected".
Metrics
Dir
UP or DN: the leg's direction.
High / Low
Highest and lowest price of the leg.
Historical legs: their two pivot prices.
Previous leg: highest/lowest from the older pivot through the latest bar.
Active leg: highest/lowest from the latest pivot through the latest bar.
Growth
Size of the leg in dollars (high minus low, per the definitions above).
Bars
Number of bars the leg lasted (pivot to pivot). For the Active leg, bars
since the latest pivot.
Retraced
Two lines: percent and dollars.
Historical legs: how much of that leg the NEXT (more recent) confirmed
leg gave back.
Previous leg: distance from the current close to that leg's end pivot,
relative to the confirmed leg before it.
Active leg: distance from the current close to the latest pivot, relative
to the previous leg's size.
Rtd %
A 10-segment progress bar of the retracement percentage (one segment per
10%). Optional.
Velocity
Growth divided by Bars, shown as dollars per bar.
vs Avg Size
The leg's Growth compared with the average leg of the same direction on
the chart. Signed percent: +18% means 18% larger than average.
vs Avg Bars
The leg's duration compared with the average duration of same-direction
legs. Signed percent.
xATR
Growth divided by the ATR(20) recorded at the leg's starting pivot.
Makes sizes comparable across volatility regimes (shown as "1.8x ATR").
Ratio to Prior
The leg's size divided by the size of the leg immediately before it.
Tagged with the nearest Fibonacci ratio if within tolerance, for example
"0.62x (~.618)". Recognized tags: .382, .5, .618, .786, 1.0, 1.272,
1.618, 2.0, 2.618.
Rtd 40% / 50% / 60%
Prices at 40/50/60% retracement of that leg's own range, measured from
the leg's more recent pivot back toward its older pivot. A marker is
appended if price has retraced at least that far (see Marker settings).
The Previous leg uses the live Active retracement %.
The Active column shows a dash: its own targets are not yet defined.
Ext 127% / 162% / 200%
Prices at 127.2%, 161.8% and 200% of the leg's range, projected beyond
the leg's older end in the same direction as the leg. Same marker rules;
the Active column shows a dash.
Color inversion
On Rtd and Ext rows, a bullish leg's values use the bearish color (and
vice versa), since they describe where price would go relative to the
leg's direction.
Price formatting
Prices are rounded to whole dollars with thousands separators ($12,345).
This suits high-priced assets. For assets that trade in cents or a few
dollars, the table values will look rounded/coarse (see Section 13).
--------------------------------------------------------------------------------
11. RECOMMENDED WORKFLOWS
--------------------------------------------------------------------------------
A) Multi-timeframe counting
Set Anchor Timeframe Selection to Automatic. Save an anchor for each of
1H/4H/1D/1W/1M once. Then simply switch chart timeframe; the counter
switches anchors automatically. Timeframes such as 15m or 2D show no
numbering.
B) Using the table as a checklist
Keep Legs Shown at 7. Watch the Active column for Retraced % and the Rtd
bar. Compare the Active leg's "vs Avg Size / Bars" to see if the current
move is stretched or young relative to history.
C) Target planning
Use the Previous (Unconfirmed) column for live Rtd 40/50/60 and Ext
127/162/200 prices, and the "reached" marker to see what has already been
touched.
D) Cleaner chart
Turn off marker circles and the projection; set Label Background Fade to
100 so only the glyphs show; or switch the table to Horizontal and reduce
Legs Shown.
E) Tuning the Period
Start with 45. Raise it for macro swings on lower timeframes; lower it for
more responsive legs. Re-verify your anchor afterwards.
--------------------------------------------------------------------------------
12. TROUBLESHOOTING AND FAQ
--------------------------------------------------------------------------------
Q1. I see legs and the table but no number labels or anchor marker.
The chart timeframe does not match the active anchor timeframe. In Manual
mode, set "Anchor Timeframe (Manual)" to the chart's timeframe. In
Automatic mode, use exactly 1h, 4h, 1D, 1W or 1M (60m/240m/D/W/M).
Q2. The anchor marker is on the wrong pivot.
The script snaps to the pivot nearest in time to your date/time. Move the
date/time closer to the intended pivot. If you changed the ZigZag Period,
pivots have changed; re-check.
Q3. Numbers changed after I changed the ZigZag Period.
Expected. Different Period = different pivots = different sequence. Re-set
the anchor.
Q4. The last pivot keeps moving.
Expected. The newest pivot follows price while direction persists; that is
why the latest completed leg is called Unconfirmed.
Q5. The projection has only one segment.
The current leg already meets or exceeds the average same-direction leg, so
only the reversal segment is drawn from the current price.
Q6. No projection at all.
Check "Show Projection", and make sure at least two pivots exist (a longer
history or a smaller Period).
Q7. The table does not appear.
Check "Show Table". It also requires enough pivots to exist. If the table
was moved off-screen with large padding values, reduce them.
Q8. Some legs/labels are missing on long histories.
TradingView limits this script to 500 lines and 500 labels. Increase the
Period so fewer legs are produced.
Q9. Emoji or glyphs render oddly.
Glyph rendering depends on your OS/browser/font. Try another Numbering
Style or Retracement Bar Glyph set.
Q10. Numbers on some older legs are "Leg-N" instead of a glyph.
Those older table legs have no phase number assigned, for instance when
the counter has not seeded yet.
--------------------------------------------------------------------------------
13. KNOWN LIMITATIONS AND BEHAVIORS WORTH KNOWING
--------------------------------------------------------------------------------
1. Seeding happens once, on the first last-bar calculation where enough
pivots exist. Changing a setting recalculates the script and reseeds.
2. Numbering labels are only displayed when the chart timeframe matches the
active anchor timeframe. The table's header glyphs use the numbering data
whenever it has been seeded, even if labels are hidden for a timeframe
mismatch.
3. The newest phase label always uses the bullish label color (there is no
later pivot yet to compare against for direction).
4. The Previous (Unconfirmed) column's High/Low and Growth are measured from
the older pivot through the current bar, so they can include movement
from the Active leg. Historical columns use fixed pivot-to-pivot values.
5. The Adaptive Projection is based on averages, so a few very large or very
small legs can skew it. It is a statistical tool, not a prediction.
6. Table prices are rounded to whole dollars, which suits high-priced assets
(for example Bitcoin) and can look coarse on low-priced instruments.
7. Anchors exist only for 1h, 4h, 1d, 1w and 1m. Other timeframes have no
saved anchor and no numbering.
8. No alerts are provided.
9. Because the pivot direction logic uses one lookback in both directions,
a bar that is simultaneously the highest high and lowest low of the window
(an extreme outside bar) does not change direction.
--------------------------------------------------------------------------------
14. GLOSSARY
--------------------------------------------------------------------------------
Active leg Live line from the latest pivot to the current price.
Anchor A pivot you nominate as having a known phase number.
ATR(20) Average True Range over 20 bars, used for volatility scaling.
Confirmed leg A settled older leg that no longer changes.
Extension A price projected beyond a leg's range in its own direction.
Leg The move between two consecutive ZigZag pivots.
Phase The repeating 1-2-3-4-5 label given to each leg.
Pivot A swing high or low detected by the ZigZag Period.
Retracement The fraction of a leg that the following move gives back.
Snap Choosing the stored pivot closest in time to your anchor
date/time.
Unconfirmed leg The most recent completed leg, whose end pivot may still move.
ZigZag Period The lookback (in bars) that decides what counts as a pivot.
================================================================================
END OF DOCUMENT
================================================================================ Indikator

Confirmed Close MTPI TOTALESWHAT THIS IS
This is a trend indicator for the total crypto market cap excluding stablecoins (CRYPTOCAP:TOTALES). It answers one question: is the crypto market in an uptrend or a downtrend right now?
It does that by running twelve separate trend indicators at once and taking a vote. Each of the twelve looks at the chart in its own way and says either "up" or "down". The score you see is simply the average of those twelve votes. All twelve agreeing up gives +1.00. All twelve agreeing down gives -1.00. Six against six gives 0.00.
Because twelve votes average out, the score can only land on thirteen values, one sixth apart: -1.00, -0.83, -0.67 and so on up to +1.00.
This approach is usually called a Trend Probability Indicator, or TPI. The point is that no single indicator is reliable on its own. Any one of them will whipsaw you. A group of twelve disagreeing with each other is information, and the score tells you how much of that group agrees.
WHY "CONFIRMED CLOSE"
A lot of indicators change their mind while the current candle is still forming, then change back before it closes. That is called repainting and it makes an indicator untradeable, because the signal you acted on may not be there an hour later.
This one does not do that. While today's candle is still open, the indicator shows you yesterday's confirmed reading. The state only changes when a daily candle actually closes. What you see is what you could have traded.
HOW TO READ IT
On the price chart:
- Candles are painted green while the score is above zero and red while it is below. This is the state, at a glance.
- A green triangle with the word BULLISH below it marks the candle where the score turned positive. A red triangle with BEARISH above it marks the turn down. These are the moments that matter.
- Two moving averages, a 12 period and a 21 period EMA, are drawn as a reference. They are a crude version of the same question and they are there so you can see how much smoother the twelve indicator version is.
- Bars are tinted amber where the twelve indicator score and the simple 12/21 cross disagree. Those are the bars where the crude version would have put you on the wrong side.
In the separate pane below:
- The stepped line is the score, from -1.00 to +1.00, filled to the zero line and coloured by state.
- Dotted lines at +0.5 and -0.5 give you a sense of how strong the agreement is. A score of +1.00 is twelve out of twelve. A score of +0.17 is seven against five, which is a trend barely holding together.
The dashboard, bottom right by default:
- The big number is the current score, with the state next to it.
- The bar beside it is a gauge. It fills outward from the middle, right and green for bullish, left and red for bearish.
- The twelve indicators are listed in two columns, the six trend-following ones on the left and the six oscillators on the right, each showing its own vote. This is where you see WHY the score is what it is.
- "12/21 agree" is the share of days where the twelve indicator score and the simple EMA cross pointed the same way, measured across all the history your chart has loaded. Read it as a rough measure of how often the crude version would have agreed with the careful one. It is measured against the raw cross with no filtering, so treat it as an indication rather than a precise statistic.
- "Regime" is how many days the current state has lasted. It turns amber below eight days, because a trend that has not lasted eight days has a habit of being noise.
HOW TO USE IT
The simplest use is the one it was built for. When the score is above zero, the crypto market is in an uptrend and you hold risk. When it is below zero, it is not, and you do not. You act on the close, and you execute on the open of the next candle. Anything earlier is acting on a candle that has not finished forming.
Set an alert if you do not want to watch it. The script exposes two alert conditions, one for the turn up and one for the turn down, and both fire only on a confirmed daily close.
Read the twelve rows when the score is near zero. A score of +0.17 that is being held up by two oscillators is a very different situation from a +0.17 where the trend-following group is turning. The individual votes tell you which one you are in.
THE WIDER SYSTEM THIS BELONGS TO
This indicator is one rung of a ladder. The idea is that you are always holding the strongest available thing, and that the decision is made in steps rather than all at once.
Step one. This indicator, on the total crypto market cap. If it is positive, you stay in crypto and you go to step two. If it is negative, you leave crypto and go to step three.
Step two, only when crypto is bullish. An ETH/BTC ratio TPI decides which of the two majors leads. Positive means ether is outperforming and ether is the base holding. Negative means bitcoin is. From there a further layer of ratio TPIs compares mid caps against whichever major won, and the ones that are outperforming get a share of the book.
Step three, when crypto is bearish. A gold TPI. If gold is in an uptrend, that is where the money sits.
Step four, when gold is not working either. An index TPI on the S&P 500. If equities are trending up, that is the holding.
Step five, when nothing is trending. Cash, and a EUR/USD TPI decides whether that cash is better held in euros or in dollars.
Each rung is its own TPI, built the same way: twelve indicators, one vote each, tuned separately for that market. The ladder simply asks them in order.
A SET, NOT A SINGLE SCRIPT
This is the first published piece of that set. The other rungs are built and running and will follow as separate publications, each one an indicator for its own market, all reading the same way so you only have to learn the layout once.
ABOUT THE SETTINGS
The twelve indicators and their periods are visible in the settings and in the source. They were tuned for this specific market against a cleaned 12/21 EMA reference on daily data from January 2023 onward, with regimes shorter than eight days treated as noise and removed before the tuning was scored. The symbol itself has daily history back to March 2014 if you want to look further back.
Those numbers are right for the total crypto market cap. They are not automatically right for anything else. If you put this on another symbol, expect to retune. That is the honest answer, and it is why each market in the set gets its own publication rather than one script with a symbol dropdown.
Two of the twelve are read on a smoothed line rather than the raw one, which is deliberate: the CCI is scored on its EMA 5 smoothing and the RSI on its EMA 9. The Awesome Oscillator is scored on its raw line. Those choices are in the code and commented.
HOW FAITHFUL THE REBUILD IS
Because seven of the twelve are rewritten from other people's published formulas rather than called directly, the obvious question is whether they behave the same. They do. Every one of the twelve votes was compared bar by bar against the original indicator running on the same chart, across the full loaded history. Zero disagreements on any of the twelve, and the combined score matched on every single bar.
That check is worth repeating if you change a setting, and it is why each vote is exposed as a hidden plot in the script rather than kept internal.
CREDIT WHERE IT IS DUE
Seven of the twelve components are reimplementations of open-source community scripts, written from their published formulas so they could all live in one indicator and be scored consistently. Full credit to the original authors:
- Gaussian Channel by DonovanWall
- Optimized Trend Tracker by KivancOzbilgic
- Awesome Oscillator v2 by KivancOzbilgic
- Hull Suite by InSilico
- SSL Channel by ErwinBeckers
- Follow Line Indicator by Dreadblitz
- WaveTrend by LazyBear
The remaining five are standard: ALMA, CCI, RSI, Coppock Curve and the Fisher Transform.
What is added here is the aggregation into a single score, the confirmed close behaviour, the per indicator breakdown, the agreement measurement against the reference, and the ladder logic this is built to serve.
LIMITATIONS AND A PLAIN WARNING
This is a trend indicator. It is late by design. It will not catch the exact top or the exact bottom, and it is not supposed to. It will be wrong in a sideways market, which is what the eight day regime warning is there to tell you.
Nothing here is financial advice. It is a tool for reading a chart. Past behaviour of any indicator tells you nothing reliable about the future. Do your own work and size your positions so that being wrong is survivable.
Indikator

C-Power OscillatorThis script is an advanced momentum and volume-flow oscillator named the "C-Power Oscillator".
It is specifically designed to work collaboratively with the primary C-Power indicator by operating as a lower-panel confirmation tool. While the main indicator tracks price structures on the chart, this oscillator uses mathematical statistics and volume to measure the exact strength of buyers (demand) against sellers (supply) on a scale from 0 to 100%.
How the script functions:
1. Volume Spike FilterThe oscillator factors in trading volume but protects itself against anomalous volume anomalies (such as sudden news spikes) that could distort the reading. If the volume of the current candle exceeds the average volume of the analysis period by more than 3.5 times, it is artificially capped at that maximum allowed threshold.
2. Advanced Volatility Modeling (Garman-Klass)Instead of using a standard ATR (Average True Range), this script uses the sophisticated Garman-Klass volatility estimator. This model:
- Evaluates Open, High, Low, and Close prices simultaneously.
- Integrates a gap-adjustment feature to account for overnight or sharp price gaps.
- Provides a highly precise calculation of true market variance within the specified period.
3. Statistical Probability (Z-Score & Gaussian CDF)This is the core engine of the oscillator. The script measures the distance between the current close and the midpoint of the price action (calculated from the open and the previous close).
- It computes a Z-score by dividing this price imbalance by the Garman-Klass volatility.
- Using a built-in mathematical approximation of the Gaussian CDF (Cumulative Distribution Function), it translates the Z-score into a directional probability percentage. This determines whether a price move is statistically significant or just random market noise.
4. Volume/Power Split (Buy Percent Calculation)
- The calculated directional probability is multiplied by the filtered volume, creating distinct series for buyers (buyPowerSeries) and sellers (sellPowerSeries).
- The script sums these forces over the chosen analysis period (default: 10 bars) to calculate what percentage of total market power belongs to the buyers.
- A value of 50% represents perfect equilibrium. Values closer to 100% indicate absolute buyer dominance, while values near 0% indicate absolute seller dominance.
5. ALMA SmoothingTo prevent the indicator line from becoming too jagged and generating false whipsaws, the final percentage is smoothed using an ALMA (Arnaud Legoux Moving Average). ALMA uses a Gaussian distribution filter to eliminate noise and provide a clean line while maintaining minimal lag compared to traditional moving averages.
6. Noise Reduction (Deadzone) & VisualsThe script implements a Deadzone (neutral zone) around the 50% balance line (defaulting to a width of 5%, or 47.5% to 52.5%). If the market power fluctuates within this narrow band, the oscillator flattens the line to exactly 50.0, signaling a clear "no-trend / consolidation" state.
Visual Indicators On Your Panel:
- Line above 50%: The market is controlled by buyers (colored green), accompanied by a green background fill.
- Line below 50%: The market is controlled by sellers (colored red), accompanied by a red background fill.
- Overbought (default: 60) & Oversold (default: 40) Levels: When the line breaches these thresholds, it changes to a bright neon color (bright green or bright red), warning that the current market move is overextended.
Summary - acting as the perfect companion to the C-Power indicator, this oscillator removes the guesswork from volume analysis. By combining price location, statistical probability, and volume filtering, it provides a clean, lag-reduced confirmation of which side actually controls the order flow.
What exactly is the C-Power Oscillator? It’s essentially a "Money Flow Index on steroids"—one that relies not on the visual geometry of candlesticks, but on statistics and probability distribution. Indikator

Round Number Levels - Response and ControlRound Number Levels - Response and Control
Round Number Levels - Response and Control draws a fixed round-number grid and examines what confirmed closes do after price contacts its levels. Two shifted reference grids provide a comparison, using contacts matched by time, approach direction and pre-contact market context.
Use it to keep price levels visible and investigate whether their observed response differs from nearby, equally spaced references. Negative differences, disagreement between the references and insufficient data are all possible results. The indicator does not assume that round numbers must act as support or resistance.
GETTING STARTED
Use a standard time-based chart and check the Interval value before interpreting any statistics. The default interval is 200 minimum ticks, not 200 pips and not a universal setting for every market. This equals 0.200 when the minimum tick is 0.001, or 0.00200 when the minimum tick is 0.00001. Manual price mode lets you specify the interval directly in price units, rounded to whole minimum ticks.
Keep the Compact panel for the main comparison. Standard adds coverage information; Research exposes the detailed sample, individual references and exact-level history. Hover over panel rows and badges for definitions and counts. A Low N or Partial status is information about the available sample, not an instruction to search for settings that produce a preferred result.
For a repeatable study, set the price interval, date window and observation rules before evaluating the displayed differences. Display-only settings, including badge sizes, colors, marker limits and panel detail, do not change the research.
THE FIXED PRICE GRID
ROUND levels are integer multiples of the chosen interval, measured from price zero. The levels are defined before their reactions are observed; the script does not move them toward historical pivots or keep only levels that previously worked.
By default, cyan marks ordinary levels, yellow emphasizes every fifth interval, green marks the enclosing lower level, and pink marks the enclosing upper level. The enclosing colors take priority when a level also qualifies as a major level. The panel shows the exact enclosing prices, tick distances and position within that interval. Optional half-interval guides appear only when the interval contains an even number of ticks. These subdivisions and visual emphasis do not create additional research cohorts.
The opaque price badges use compact, bold monospace digits: 13 points for ordinary round numbers and 14 points for major or enclosing levels. Their fill follows the level color, with automatically selected black or white text. An opaque dark background is also available. Font sizes remain independently adjustable. The default text contains the price only; L/U and major-level prefixes can be restored.
Badges retain the exact level in their text even when displaced for readability. Optional connectors join them to the corresponding horizontal line. The default position is to the left of the line segment, with an additional twelve-bar horizontal gap and a small vertical offset. Badge placement does not change the line price. Very tight spacing or strong chart compression can still cause visual overlap.
Two automatic preview modes choose a 1-2-5 interval once from the first usable prior range or price context. The panel explicitly identifies PREVIEW because the choice can change with the loaded starting history. Copy its displayed interval into Manual price to fix the interval for a repeatable study.
REFERENCE A AND REFERENCE B
Reference A is shifted by 37% of the interval by default, rounded to minimum ticks. Reference B uses the exact complementary tick offset, normally close to 63%. Both references have the same spacing as ROUND. Their lines are optional and hidden by default, but research continues while they are hidden.
All three contact bands must be separate. Overlapping bands pause the comparison rather than creating indistinguishable cohorts. Shifted prices can still be round numbers at a finer scale. These are observational reference grids, not randomized placebos.
CONTACTS AND CONFIRMED OUTCOMES
A contact occurs when a candle's high-low range intersects the band around one grid level. The default half-width is 4% of the interval, with a one-tick minimum. The preceding close must be outside that band by the required clearance; the default clearance is 12% of the interval, with a minimum of one tick beyond the band.
The same bar-quality exclusion applies to all grids. If the opening gap crosses an entire band in any grid, or the candle touches more than one level band in any grid, none of the three grids admits a new contact on that bar. Already active observations continue. This avoids assigning a precise new contact to ambiguous OHLC data.
Every eligible contact is tracked, including contacts that start while earlier ones are unresolved. There is no outcome-dependent busy state or cooldown. A contact is not discarded merely because an earlier observation is taking longer to resolve.
The response distance is fixed at contact. It can be a fraction of the grid interval or a multiple of the preceding finite mean true range. The default is 20% of the interval. The threshold is at least one tick beyond the contact band and does not move with subsequent volatility.
The contact candle is excluded from outcome testing. Subsequent confirmed closes determine the result:
R, Return: the configured number of consecutive closes is at or beyond the threshold on the side from which price approached.
T, Through: the configured number of consecutive closes is at or beyond the threshold on the opposite side.
U, Unresolved: neither condition has been confirmed by the end of the full observation horizon.
Each consecutive-close counter resets when its own condition is not satisfied. The first confirmed R or T result is fixed. A confirmation on the last allowed bar takes precedence over U. Defaults are two consecutive closes within twelve bars after contact; the effective horizon is never shorter than the confirmation count.
These outcomes are not intrabar first touches, executions or trade returns. No entry, stop, target, spread, fee or position-sizing model is applied.
HOW THE MATCHED COMPARISON IS BUILT
The panel does not compare three independently truncated latest-N lists. Its main sample consists of triplets containing one ROUND contact, one A contact and one B contact.
Time is divided into fixed elapsed-time blocks anchored to the Unix epoch. The default block is 128 chart periods, equivalent to 640 elapsed minutes on a five-minute chart. Blocks are not exchange sessions and do not count only traded bars. Loading more preceding history does not move their boundaries. Weekly and monthly chart periods use the platform's seconds conversion rather than calendar-aligned week or month boundaries.
Within a block, contacts are grouped by approach side and optional prior context. The default Side + range + trend mode uses three range groups and three trend groups, separately for approaches from above and below. Side only and Side + range are also available.
Range grouping uses the preceding finite mean true range divided by the fixed interval, with default boundaries of 0.25 and 0.75. Values below 0.25 enter the low group, values from 0.25 to below 0.75 enter the middle group, and values at or above 0.75 enter the high group.
Trend grouping uses the preceding close minus the close ten bars before it. The default neutral band is plus or minus 0.5 times the preceding mean range; values on either boundary remain neutral. All context inputs come from preceding bars, not subsequent outcomes.
Inside each block and context group, the first eligible ROUND, A and B contacts are assigned together, then the second contacts, and so on. The default matching cap is the first eight contacts per grid, context group and block. Later contacts are still observed and exported, but do not enter matching. Their exclusion is counted separately.
A complete triplet must satisfy a fixed maximum spread between its earliest and latest contact times, defaulting to half a block. Failed triplets are not reassigned to different partners. Neither matching nor this time filter consults R/T/U results or resolution speed.
EVERY CONTACT RECEIVES THE SAME HORIZON
Early confirmation does not produce early inclusion in the comparison. Every observation must receive the full configured horizon before contributing, including results already known after only a few bars.
Only complete time blocks whose contacts have all had that horizon enter the panel. Blocks cut by the study dates or the beginning of usable history are excluded. The default window contains the latest twenty-four mature elapsed-time blocks. The study start is inclusive and the study end is exclusive; already admitted contacts continue to receive their horizon after the end date.
Matching gives the three cohorts identical counts by time block, approach side and context group. It does not make their price paths identical. Context groups remain broad, contact horizons can overlap, and unmeasured conditions can differ. Standard and Research show how much of the full contact population the matched sample covers.
READING THE COMPACT PANEL
The default panel has fourteen rows. The MATCHED section uses the same triplets for every main-sample percentage and difference.
N each grid shows the actual denominator: ROUND on the left and A / B on the right. All three numbers are equal. They are neither storage capacities nor counts of visible markers.
Return, Through and Unresolved show the ROUND share and the arithmetic mean of the A and B shares. U stays in the denominator. Hover over a row to see the separate A and B values and underlying counts.
R delta A / B shows ROUND's return share minus A's on the left, and ROUND's return share minus B's on the right. Values are percentage points, not percentage changes or predicted probabilities.
Mean / A-B shows the arithmetic mean of those two differences and their sign relationship. Both + means both are positive; Both - means both are negative. SPLIT means they have opposite signs. Has zero means one or both differences is exactly zero. A positive mean never hides a SPLIT. These labels describe signs, not statistical significance or confidence.
Early / Late splits the retained clock window into two contiguous halves. Each half has its own smaller matched denominator, shown in the tooltip. This is a historical period comparison, not a held-out test.
Main differences require at least thirty matched triplets, five from each approach side and three contributing blocks by default. Half-window comparisons use their own smaller guards. Below the requirements, counts and outcome shares remain visible while the affected differences are withheld. The guards prevent very small comparisons from looking definitive; they are not significance tests.
Standard has twenty-two rows and adds all mature contacts, matched coverage, over-cap contacts, contributing blocks, time spread and window coverage. Research has thirty-two rows and adds matched history at the exact enclosing levels, side counts, separate A/B outcomes, shared exclusions and reproduction details.
MARKERS, LIVE CONTEXT AND ALERTS
R/T/U markers appear on the confirmed bar when an outcome becomes known. Their time is never moved back to the contact bar. Default placement is outside the outcome candle and two preceding candles, plus a range-based margin. The vertical location is for readability, not the studied price or an execution price.
Several outcomes can resolve on one bar. The displayed badge represents the oldest contact resolving there; a plus sign, such as R+, means additional outcomes exist. The tooltip lists the R/T/U counts for that bar. Marker thinning and the maximum marker count affect drawing only.
Markers describe eligible ROUND outcomes before matching. The panel describes matched, fully mature triplets. Counting the chart markers therefore cannot reproduce the panel denominator. Optional threshold lines show only the latest unresolved ROUND contact to limit clutter; other observations continue independently.
The live reference price, enclosing levels, distances and cell shading can update during an open candle. Observation results are updated only on confirmed bars. The panel's matched sample uses closed, fully mature clock blocks, so it does not necessarily change on every new candle.
Four alert conditions are available: a newly admitted ROUND contact, one or more confirmed Return outcomes, one or more confirmed Through outcomes, and one or more Unresolved outcomes. They describe observation events rather than trade instructions. More than one outcome type can occur on the same bar, independently of which representative marker is visible. Create the required alerts in the alert dialog. Recreate existing alerts after changing research settings so that they use the intended configuration.
REPRODUCIBILITY AND NUMERIC RECORDS
Research uses a finite simple mean of tick-quantized true range rather than recursively seeded Wilder ATR. With manual spacing, the same settings and sufficient identical preceding OHLC, extra earlier history does not shift the later context calculations or epoch-based block boundaries. Data revisions, sessions, price adjustments and missing bars can still change results.
Require full start-date context pauses research unless loaded history crosses the requested start with adequate preceding context. Otherwise, the initial partial block is excluded and incomplete coverage is reported. Fixed / full describes coverage of the displayed window; it does not certify the entire requested history or statistical validity.
The RN6_ Data Window outputs retain research protocol 6001. They expose the settings, reported clock window, actual matched N, A/B differences, their mean, sign status and a non-cryptographic OHLC checksum. Equivalent records are emitted for all three grids: contact time, level in ticks, approach side, fixed threshold, result, first confirmation age, context group and ordinal.
Each record is emitted exactly H bars after contact. This permits at most one complete record per grid per bar, even when several early outcomes resolve together. Unmatched and over-cap contacts are still recorded. A negative ordinal marks a partial or date-cut block excluded from panel statistics. Pending contacts are not presented as completed records.
For recomputation, preserve the source, settings and native OHLC export, including sufficient context before the window and the following horizon. The checksum helps identify differences in included data; it is not a cryptographic signature. The optional Pine Logs recipe is a convenience for personal editor copies, not a requirement for using the published indicator.
DESIGN PURPOSE AND LIMITATIONS
The research layer is designed to test a fixed price reference rather than select levels after seeing their reactions. Its contribution is the combination of concurrent observation, shared admission rules, prior-context ordinal matching, a time-spread limit, uniform maturity, identical displayed denominators, explicit disagreement between two references, and symmetrical records for independent recomputation.
This remains observational analysis. Repeated contacts are not independent trials; matching can retain only part of the full population; the first-K limit and context boundaries affect the subset being studied. Changing the interval, period or rules after inspecting results introduces selection risk. Small, negative or inconsistent differences are legitimate findings.
The indicator is free and open-source. It places no orders, fetches no external data and requires no external service. Research is limited to standard time-based charts. Non-standard and tick charts retain the price grid without the research comparison. Neither a positive difference nor a Both + status proves a causal round-number effect, forecasts a future reversal or establishes a profitable trading strategy. Indikator

Adaptive Path Efficiency ProfileOVERVIEW
Adaptive Path Efficiency Profile is a price-region analysis tool designed to study how efficiently price has historically traveled through different areas of the chart.
Instead of treating every price level equally, the indicator evaluates completed price paths and organizes their behavior spatially. Its purpose is to distinguish regions associated with relatively efficient directional travel from regions associated with greater rotation or churn.
The central question is:
Where has price historically moved efficiently, and where has movement required more path activity to produce less directional progress?
CORE METHODOLOGY
The framework follows this sequence:
Completed Price Path → Path Distance → Net Displacement → Path Efficiency → Spatial Mapping → Efficiency/Churn Profile → Core Regions
For each completed observation window, the script measures the total distance traveled by price and compares it with the net displacement produced over the same path.
A relatively direct path produces higher efficiency.
A path containing more back-and-forth movement relative to its net displacement produces greater churn.
The observations are then distributed across the price regions traversed by those paths, creating a spatial profile of historical behavior.
PATH EFFICIENCY
Efficiency describes the relationship between net directional displacement and the cumulative distance traveled by price.
Higher readings indicate that, within the analyzed sample, price paths have tended to convert more of their movement into directional progress.
Lower readings indicate that a greater portion of movement has been consumed by rotation or back-and-forth travel.
Efficiency is a behavioral measurement. It is not a probability, win rate, or prediction of future price direction.
CHURN
Churn represents the complementary side of path efficiency.
Higher churn indicates regions where historical paths contained more rotational movement relative to their resulting displacement.
This can help distinguish structurally different price environments without classifying either condition as inherently bullish or bearish.
DISPLACEMENT CONTEXT
The engine also normalizes path displacement relative to ATR.
This prevents raw price movement from being interpreted identically across instruments with different volatility and price scales.
Displacement contributes context to the profile rather than functioning as an independent directional signal.
SPATIAL PROFILE
Historical path observations are mapped into price rows according to the regions they traversed.
The visual profile uses three contextual states:
Teal — efficiency-dominant regions
Rose — churn-dominant regions
Violet — mixed or transitional regions
Profile width represents the relative strength of the corresponding behavioral evidence within the current observation window.
EFFICIENCY CORE
The Efficiency Core identifies the price region containing the strongest combination of path efficiency, displacement context, and accumulated evidence within the analyzed sample.
It should be interpreted as a historical behavioral reference rather than support, resistance, or a price target.
CHURN CORE
The Churn Core identifies the region where rotational behavior is most pronounced relative to the available sample.
Comparing current price with the Efficiency Core and Churn Core provides additional spatial context for the dashboard.
REGIME CLASSIFICATION
The dashboard summarizes the aggregate path environment as:
DIRECTIONAL — efficiency is comparatively dominant.
ROTATIONAL — churn is comparatively dominant.
TRANSITION — neither condition is sufficiently dominant.
The dashboard also reports Efficiency, Churn, normalized Displacement, and the current price position relative to the two core regions.
HOW TO USE
The indicator is designed primarily as a market-context tool.
Users can examine whether current price is interacting with historically efficient or rotational regions, compare behavioral structure across instruments, and observe how the profile changes as new completed paths enter the observation window.
The profile can also provide context alongside independent market-structure, trend, volatility, or risk analysis.
No individual profile region should be interpreted as a standalone entry or exit instruction.
CONFIRMATION AND LIMITATIONS
The indicator uses chart-derived OHLC data and ATR normalization. It does not use exchange order-book liquidity, transaction-level footprint data, or future information.
Its profile describes behavior observed within a rolling historical sample. As that sample changes, profile regions and core locations can also change.
Efficiency does not imply that price will continue moving efficiently through the same region in the future. Churn does not guarantee consolidation or reversal.
The classifications are analytical descriptions of historical path behavior, not probabilities or performance forecasts.
ORIGINALITY
Adaptive Path Efficiency Profile was independently developed as a spatial path-behavior framework.
Rather than displaying conventional volume-at-price or combining common trend indicators, it maps completed price-path efficiency and rotational behavior back into the price regions those paths traversed.
Its distinctive analytical structure is:
Path Geometry → Normalized Displacement → Regional Evidence → Efficiency/Churn Competition → Core Extraction → Market Regime
The resulting profile is intended to provide a different representation of how efficiently price has historically moved through market structure. Indikator

BTC Power-Law Ladder (Point-in-Time)WHAT IT DOES
Divides Bitcoin's daily close by a power-law trend line fitted to the lower edge
of its own price history, then sorts the result into five labelled rungs. The
reading answers one question: how far is price stretched above the floor that
has historically held it?
This is a risk-framing tool. It is not an entry signal and it is not advice.
THE TREND LINE
line(d) = 10^a * d^b d = days since the genesis block, 2009-01-03
The coefficients come from a quantile regression through the 1% lower quantile
of log price against log days — a line that tracks the bottom edge of the
distribution rather than its middle.
What makes this version different: the line is refit every January, and each
year is drawn with the coefficients that were available in that year. The 2016
fit uses only data through 2015-12-31. The 2020 fit uses only data through
2019-12-31. Thirteen vintages are stored, 2014 through 2026. Nothing on the
chart was fitted on the history it is being drawn over.
Most published power-law charts use a single set of constants fitted across the
entire history, then plot them back over that same history. Those charts show
you a line that knew how every cycle ended. This one does not.
Because a hard coefficient switch on January 1 would move the line — and
therefore the ratio — overnight with no price action behind it, each new vintage
is phased in over the first 21 bars of the year (adjustable). Both fits are
known on January 1, so the blend introduces no future information. The 2016
vintage sits 43% below the 2015 vintage; without the blend that single step
would jump the ratio by 77% and could trip a rung change on its own.
THE RUNGS
Fixed at 1.0x, 1.6x, 2.5x and 4.0x. These boundaries do not move when you change
the de-risk settings, because the statistics below were measured at these
specific values.
What followed each rung, 2014-01-01 to 2026-09-16 (4,642 daily closes, medians):
rung days 2-yr median positive next-yr drawdown P(dd < -50%)
below 1.0 445 9.77x 100% -30% 0%
1.0 - 1.6 1,544 4.31x 100% -30% 14%
1.6 - 2.5 1,162 2.05x 89% -49% 46%
2.5 - 4.0 764 1.60x 76% -62% 90%
above 4.0 727 0.74x 28% -72% 97%
Read the day counts as overlapping windows, not as independent observations. The
ratio's one-day autocorrelation is 0.997, so consecutive days in the same rung
are very nearly the same observation counted again.
THE DE-RISK STATE MACHINE
Optional markers for a hysteresis rule: reduce exposure when the ratio closes
above 2.5, restore when it closes below 1.6. The band between the two levels
prevents the state from flipping on noise. The machine only evaluates confirmed
closes, so what you see on the chart is what the rule would have done, not what
an intrabar wick briefly suggested.
Over the same window, with costs and exposure lagged one day:
buy and hold Sharpe 0.88 max drawdown -83.6% 101x
the rule Sharpe 1.16 max drawdown -55.9% 260x 6 round trips
Tested against 5,000 random vetoes of the same six durations at random dates:
p = 0.0022 (Sharpe), 0.0006 (drawdown), 0.0142 (terminal multiple).
WHAT THIS IS NOT — READ THIS PART
Six completed round trips is far below any reasonable evidence threshold. My assessment of this rule is "insufficient evidence — tracked, not
rejected." It is not a validated edge, and it is presented here as a framework
for thinking about risk, not as a system to trade.
One specific failure: the 2017 episode alone accounts for 57.9% of the rule's
entire gross profit. It also gave up a 67.6% rally between the cut at $2,258 and
the restore at $3,783. A track record resting on one event is a track record you
do not yet understand.
The threshold grid used for robustness testing is not independent evidence.
Adjacent thresholds fire within days of each other on a signal with 0.997
autocorrelation, so a cut at 2.4 and a cut at 2.6 trade the same six episodes.
The grid shows the result is not balanced on a knife edge; it does not multiply
the evidence.
The point-in-time refits remove coefficient hindsight, not specification
hindsight. The 2014 coefficients use only pre-2014 data — but the decision to
fit a power law to the 1% lower quantile of log-log Bitcoin history was made by
people who had already seen that history. That choice was not available in 2014.
Coefficients for 2027 and later fall back to the most recent fit and are flagged
"provisional" in the readout table. They will be replaced as new vintages become
available.
SETTINGS
Line — Real-time (the point-in-time vintages, default, starts 2014), Published
constants (the widely-quoted full-history fit, for comparison), or Custom.
January blend length — bars over which a new vintage phases in. Default 21. Set
to 1 for a hard switch.
De-risk above / Restore below — the operative rule levels. Moving them off
2.5 / 1.6 takes the rule off the tested configuration; the readout table flags
this. The rung boundaries stay fixed regardless.
Markers — rung tint, boundary lines, de-risk and restore triangles, trailing
one-year lows, halving shading, and a readout table (four corner positions).
Five alert conditions are available: crossing the de-risk level, crossing the
restore level, losing the trend line, reclaiming it, and a new trailing
one-year low.
REQUIREMENTS
Bitcoin, daily timeframe, log price scale. The trend line is defined on days
since the genesis block and is not meaningful on other timeframes or symbols;
the script will tell you so rather than silently drawing nothing.
DISCLAIMER
This indicator is a research and risk-framing tool. It is not financial advice,
not a recommendation to buy or sell any asset, and not a trading system.
Every statistic shown describes what has already happened across a single asset
over roughly twelve years containing four market cycles. Bitcoin's history is
short, its regime has changed repeatedly, and nothing about the past behaviour of
this ratio guarantees or implies anything about its future behaviour. A power-law
floor holds until it does not, and there is no mechanism that obliges it to hold
at all.
The de-risk rule shown here is explicitly rated as having insufficient evidence
by its own author. It is published so that its logic and its weaknesses are both
visible, not because it has been demonstrated to work.
Trading digital assets involves substantial risk of loss. You are responsible for
your own decisions and should consult a qualified professional regarding your
particular circumstances. Indikator
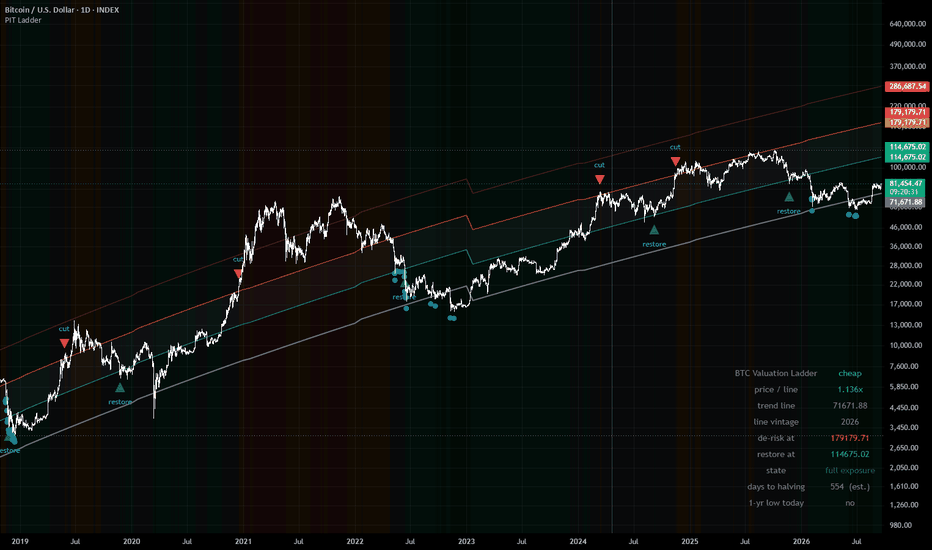
Indikator