Zero Lag ADX [jwammo12]This uses Zero lag principles to ADX. The cyan line is the zero lag line and the grey line is the traditional ADXIndikatoroleh jwammo12Diupdate 132
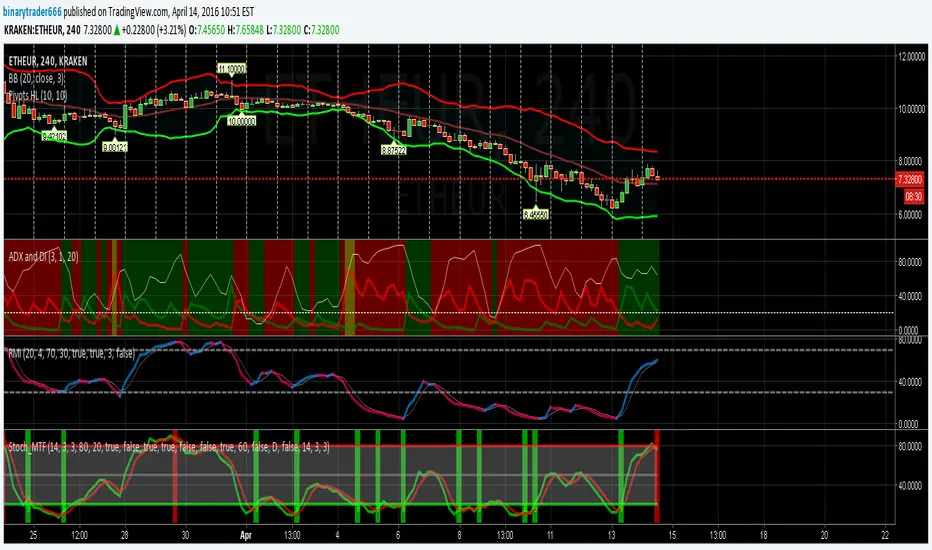
ADX & DI in one lineThis is the standard ADX & DI indicator, but combined in a single line, changing color when a trend changes and changing value when the trend is strong.Indikatoroleh laptevmaxim92Diupdate 360
ADX +- DiThis Adx +-Di is just a complete version of what the ADX is supposed to signal. So you have: 15 (contraction), 20 (threshold), 30 (expansion), 40 (resistance) levels. Below 20 the price is not trending Above 30 the price is trending Below 15 price has been in contraction for too long Between 20 and 30 price is in a "transition zone". I finally added a "Resistance" level (40), which has to be adapted to best represent the historical levels where price usually encounters resistance, and where thIndikatoroleh MauriceEverthin109
ADX & DI HistogramThis bad boy shows the same info as a normal ADX & DI but I've endeavoured to remove a lot of the confusion. I also added red/green colour gradients to show how much ADX is trending, the darker the colour, the stronger the trend. This should help to avoid the upsidedowniness and confusion I've always found with the original. I made this a while ago and have made a few changes recently but I can't remember where I go the basic ADX code from, so credit to whoever that was. EnjoyIndikatoroleh scarf38 2 K
ADX & DI trend exhaustionAn EMA is applied to the ADX in order to catch the exhaustion of a trend (i.e. ADX line crossunder EMAADX line) or the possible formation of a new one. In the first case, we would wait a confirmation signal, which happens when the crossunder has a value greater then 50. A new trend is created when the difference between the ADX and the EMAADX is positive, with ADX greater then 20. As confirmation, we would have the DI+ greater then 20 e the DI- smaller then 20 (this would trigger a bullish sentiIndikatoroleh SimoneNovo4235
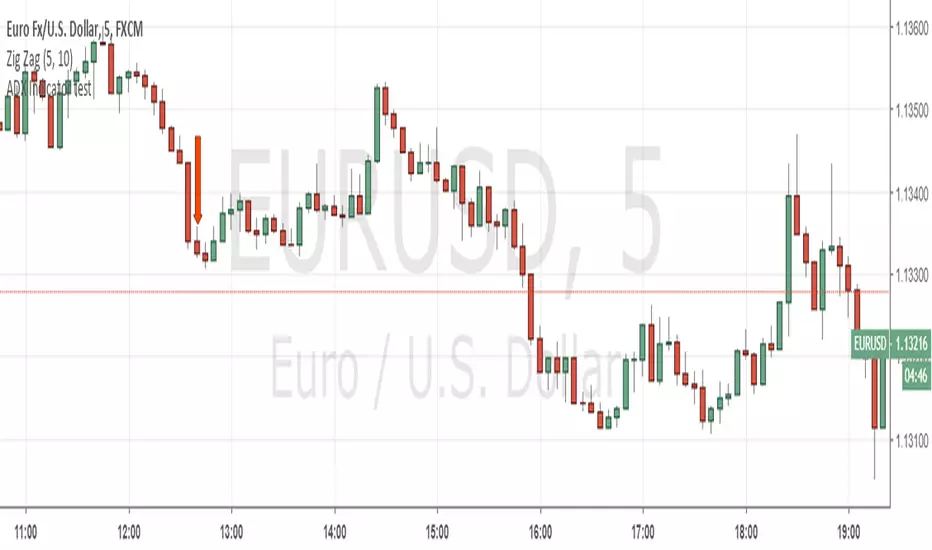
ADX Indicator testADX 14 is below 20 and 20 period EMA cross 90 periodIndikatoroleh MikhailAntropov28
Average Directional Index-BuschiA simple modification of the built-in "Average Directional Index": To identify wether there is an uptrend or a downtrend, the function color is conditional: no trend: black small uptrend (weak threshold): light green big uptrend (strong threshold): green small downtrend (weak threshold): light red big downtrend (strong threshold): red Indikatoroleh MagicEinsDiupdate 3530
DMI ADX TREND 2.0 (edit by GeertVD)Edit of the popular script by @TraderR0BERT New features: - horizontal colored areas, indication weak/medium/strong trend - vertical bars, signaling trend/momentum changes - DI+ vs DI- contraction/expansion histogram (to measure the DI volatility)Indikatoroleh GeertVDDiupdate 10 1.2 K
5 in 1 (rsi,aroon,stoch,macd,adx di)5 indicators in 1. You can choose wich one you want to see (rsi ,aroon,macd,stoch or adx di) Usefull to save space for other indicators Indikatoroleh MarcoValente16 1.9 K
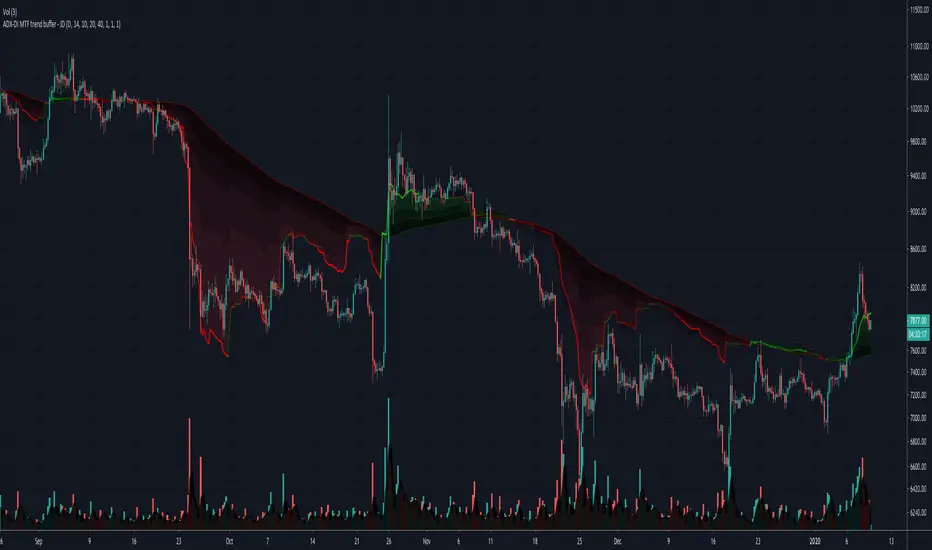
ADX-DI MTF trend buffer - JDThe indicator gives a multiplication of ADX and the DI+ and DI-values, color coded for bullish or bearish momentum the indicator was optimised for use with HA-candles, but works with regular candles as well and shows general market direction en divergence in a simpler visual way than the normal ADX-DI lines a threshold mask can be shown or omitted as preferred version 3. the indicator is now plotted relative to the 200 ema and can be seen as a "buffer" against price reversal The timeframe of tIndikatoroleh DuyckDiupdate 2368
Linda Raschke's Holy GrailAnother script based on Linda Raschke's strategy with the same name from her book about swing trading. Strategioleh Tr0sTDiupdate 10889
ADX-DI MTF trend indication - JD version 2Version 2 added support for MTF, to see the trend direction on the lower or higher timeframe. As an example to see the difference, the indicator is added three times, one time for the current TF, one set at the higher and one at the lower TF. Cudo's to Chris Moody for the MTF-switching-code!! JD.Indikatoroleh Duyck9572
ADX-DI trend indication - JDThis indicator is based on the formulas in the original "ADX and DI" script of Masa Nakamuro The indicator gives a multiplication of ADX and the DI+ and DI-values, color coded for bullish or bearish momentum. The indicator was optimised for use with HA-candles, but works with regular candles as well and shows general market direction en divergence in a simpler visual way than the normal ADX-DI lines. A threshold mask and the actual DI-lines kan be shown or omitted as preferred JD.Indikatoroleh Duyck2376
ADX-DI trend indication - JDThis indicator is based on the formulas in the original "ADX and DI" script of Masa Nakamuro The indicator gives a multiplication of ADX and the DI+ and DI- values, color coded for bullish or bearish momentum. The indicator was optimised for use with HA-candles, but works with regular candles as well and shows general market direction en divergence in a simpler visual way than the normal ADX-DI lines. A threshold mask and the actual DI-lines kan be shown or omitted as preferred JD.Indikatoroleh Duyck1418
ADX and DI (Average Directional Index) - CORRECT FORMULASo... the popular version of "ADX and DI" shown on tradingview by masanakamura uses some wacky and incorrect formula for DI and uses SMA instead of the Wilder's MA that ADX/DI is supposed to use, and doesn't give the correct ADX and DI values. The Tradingview "Average Directional Index" uses the correct calculation but doesn't show DI+ and DI-. So, here it is with the DI+ and DI- visible. Enjoy!Indikatoroleh cryptographic116 1.2 K
Vertical Horizontal FilterVertical Horizontal Filter indicator script. This indicator was originally developed by Adam White.Indikatoroleh evergetDiupdate 144
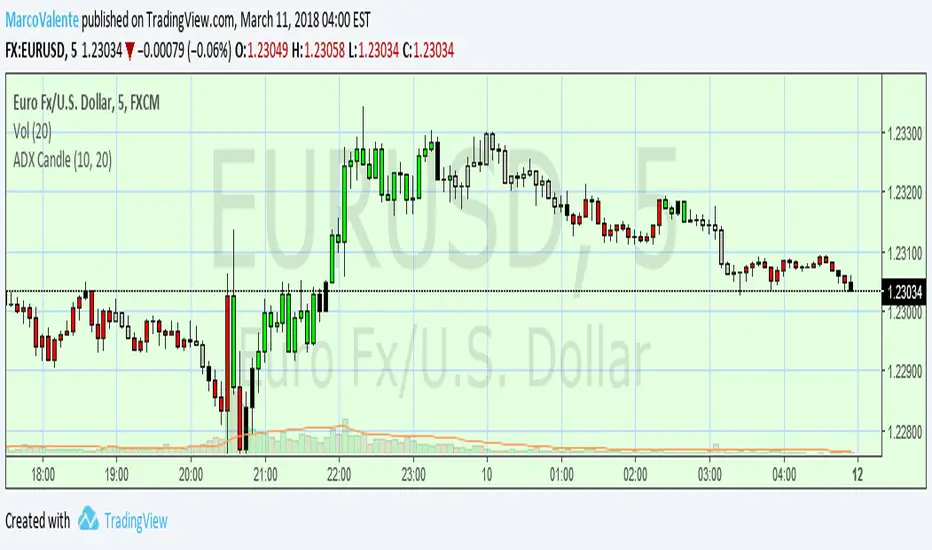
ADX CandleCandles colors based on ADX and DI strength. How to read: ADX is less then 20 (adjustable value) is SILVER (no trend) ADX >0 and DI delta (DI plus - DI minus) is >0 color LIME (trend up) ADX>0 and DI delta <0 color RED (trend down) ADX cross ADX Index ( adx+adx 14 period back)/2 color is BLACK and means start/end trend Indikatoroleh MarcoValente3652
Money Flow Indicator (Chaikin Oscillator) Strategy Indicator plots Money Flow Indicator (Chaikin). This indicator looks to improve on Larry William's Accumulation Distribution formula that compared the closing price with the opening price. In the early 1970's, opening prices for stocks stopped being transmitted by the exchanges. This made it difficult to calculate Williams' formula. The Chaikin Oscillator uses the average price of the bar calculated as follows (High + Low) /2 instead of the Open. The indicatIndikatoroleh HPotter1261
[naoligo] Simple ADXI'm publishing this indicator just for study purposes, because the result is exactly the same as DMI without the smoothing factor. It is exactly the same as ADX Wilder from MT5. I was looking for the algorithm all over and it was a pain to find the right formula, meaning: one that would match with the built-in ones. After several study and comparison, I still didn't find the algorithm that match with the MT5's built-in simple ADX ... Enjoy!Indikatoroleh naoligo3118
Average Directional Movement Index Rating The Average Directional Movement Index Rating (ADXR) measures the strength of the Average Directional Movement Index (ADX). It's calculated by taking the average of the current ADX and the ADX from one time period before (time periods can vary, but the most typical period used is 14 days). Like the ADX, the ADXR ranges from values of 0 to 100 and reflects strengthening and weakening trends. However, because it represents an average of ADX, values don't fluctuate as dramatically and sIndikatoroleh HPotter2403
KK_Average Directional Index (ADX) Higher TFHey guys, sometimes you just want to plot an Indicator value from a higher Timeframe on your Chart. For most Indicators this is pretty straightforward however there is one Indicator that has been giving me quite a headache while trying to do this: The Average Directional Index . Anyway after going through almost 200 versions of this script I finally found a solution that works and thought I would share this with you, since I'm sure some of you have encountered the same problem. How it works Indikatoroleh Kurbelklaus296
ADX Color Easy [Dravya]Script #1 So, here is my first script. This is the normal 14 period ADX, but with a color twist, to make it extremely easy on eyes. and then, easily spot the strength. ADX, as you know, shows the strength of the trend. As short term traders, we need price movement and a strong trend. How to use this script ? 1. We don't trade when ADX is in the red zone (0-20) 2. We get ready for trading when it enters the blue zone (20-30) 3. We trade when the ADX enters the green zone Indikatoroleh dravya7319
Average Directional Index with DI+ and DI-Average Directional Index with DI+ and DI-Indikatoroleh robertkowalski2 2.1 K