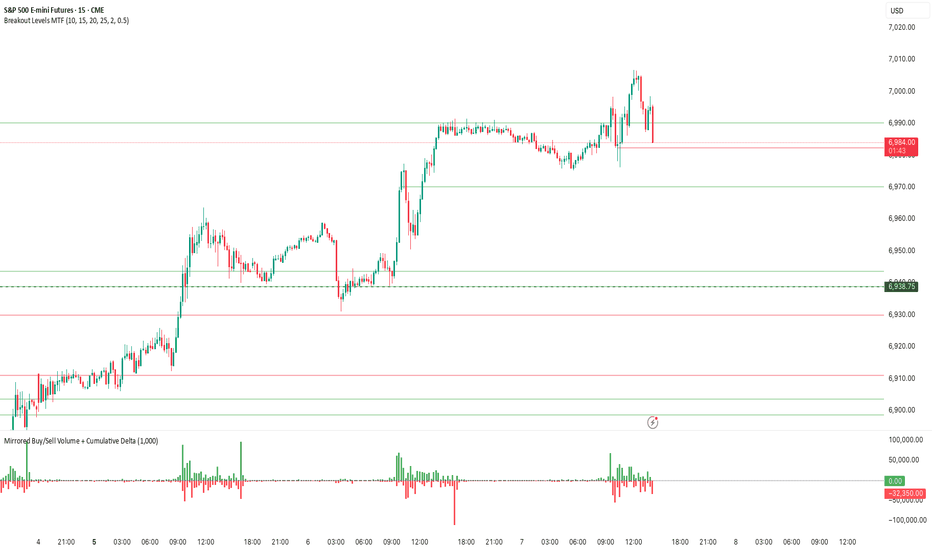
Breakout LevelsBreakout Levels - User Guide
Overview
The Breakout Levels indicator automatically detects and displays significant breakout candles across multiple timeframes. A breakout occurs when price makes a strong, decisive move - identified by candles with unusually large bodies relative to average volatility.
These breakout levels often act as future support/resistance zones, making them valuable reference points for trading decisions.
What is a Breakout?
A breakout is detected when a candle's body size (the distance between open and close) is significantly larger than normal. By default, the script looks for candles that are 2x the ATR (Average True Range) or larger.
Example:
If the 14-period ATR is $5, a candle with a $10+ body would qualify as a breakout
These represent strong, committed moves by the market
The script marks the high of bullish breakouts and the low of bearish breakouts
Settings Guide
Timeframes
Toggle which timeframes to monitor for breakouts:
Show Daily Breakouts - Green/Red levels from daily chart breakouts
Show 4H Breakouts - 4-hour timeframe breakouts
Show 1H Breakouts - 1-hour timeframe breakouts
Show 15M Breakouts - 15-minute timeframe breakouts
Tip: When running on a 15-minute chart, you can see breakouts from all higher timeframes simultaneously.
Lookback (How Far Back to Display)
Controls how many bars back to show levels for each timeframe:
TimeframeDefaultWhat it Means15M50 bars~12.5 hours of breakout history1H200 bars~8 days of breakout history4H250 bars~42 days of breakout historyDaily300 bars~300 days (nearly 1 year)
Why adjust this?
Increase to see more historical levels (may clutter chart)
Decrease to focus only on recent breakouts
Older levels are still stored, just not displayed
Detection Settings
Breakout Candle Size (x ATR)
Default: 2.0
Range: 1.0 to 5.0
What it does: Multiplier for what qualifies as a "big" candle
SettingSensitivityUse Case1.0-1.5Very sensitiveCatches more breakouts, but may include false moves2.0Balanced (default)Good mix of quality and quantity3.0-5.0Very selectiveOnly the most explosive moves
Recommendation: Start with 2.0 and adjust based on your market and trading style.
Visual Settings
Bullish Breakout Color
Default: Green with 60% transparency
Marks levels where price broke upward strongly
Bearish Breakout Color
Default: Red with 60% transparency
Marks levels where price broke downward strongly
Show Labels
Toggle labels on/off
Labels display: BO
Example: "4H BO 150.25"
Turn OFF for cleaner charts when you just want the lines
How to Use This Indicator
1. Identify Key Breakout Zones
Breakout levels often become magnets where price returns later:
Former resistance (where price broke up) becomes future support
Former support (where price broke down) becomes future resistance
2. Look for Confluence
When multiple timeframe breakouts cluster near the same price:
15M + 1H + 4H breakouts all near $150 = strong level
More confluence = more significant level
3. Watch for Retests
After a breakout, price often returns to test that level:
Bullish breakout retest from above = potential long entry
Bearish breakout retest from below = potential short entry
4. Combine with Other Analysis
Use breakout levels alongside:
Your own support/resistance analysis
Volume profiles
Fibonacci levels
Candlestick patterns at these levels
Practical Examples
Example 1: Clean Breakout and Retest
Daily candle closes up with a huge body (2.5x ATR)
Green line drawn at the high of that candle
Price pulls back 3 days later and bounces exactly off that green line
Trade opportunity: Long entry at the retest with stop below
Example 2: Failed Breakout
4H bearish breakout draws a red line at the low
Price immediately reverses back above the level
Signal: The breakout was false - consider this a stop hunt zone
Example 3: Multi-Timeframe Confluence
Daily breakout at $100
4H breakout at $100.50
1H breakout at $99.80
Strong cluster zone: $99.80-$100.50 becomes a major decision point
Best Practices
DO:
✅ Start with default settings (2.0x ATR, default lookbacks)
✅ Use on a 15-minute chart to see all timeframes
✅ Look for price reactions at these levels before trading
✅ Combine with volume - breakouts with high volume are more reliable
✅ Turn off labels when chart gets too busy
DON'T:
❌ Treat every line as guaranteed support/resistance
❌ Set breakout multiplier too low (<1.5) - creates noise
❌ Ignore the context - check what's happening in the broader market
❌ Trade blindly at these levels without confirmation
Troubleshooting
"Too many lines on my chart"
Reduce the lookback settings
Turn off some timeframes (maybe just show Daily + 4H)
Increase the breakout multiplier to 2.5 or 3.0
"Not showing any levels"
Lower the breakout multiplier to 1.5
Increase lookback settings
Check that at least one timeframe toggle is ON
Verify the market had actual volatility during the period
"Labels are cluttering the chart"
Turn off "Show Labels" in settings
Lines will remain, labels disappear
Technical Notes
ATR Period: 14 (industry standard, not adjustable in this version)
Max Lines: 500 (Pine Script limitation)
Duplicate Filter: Levels within 0.3% of ATR are considered duplicates and filtered
Chart Type: Works on any chart timeframe, optimized for 15-minute
Asset Type: Works on stocks, forex, crypto, futures
Summary
The Breakout Levels indicator gives you a systematic way to identify where strong, committed market moves occurred. These levels often act as future decision points. Use them as reference zones to watch for price reactions, not as automatic trade signals.
Quick Start:
Add indicator to a 15-minute chart
Leave default settings (2.0x ATR)
Watch how price interacts with the levels over the next few days
Adjust sensitivity based on your observations
Happy trading! 📈 Indikator
Indikator

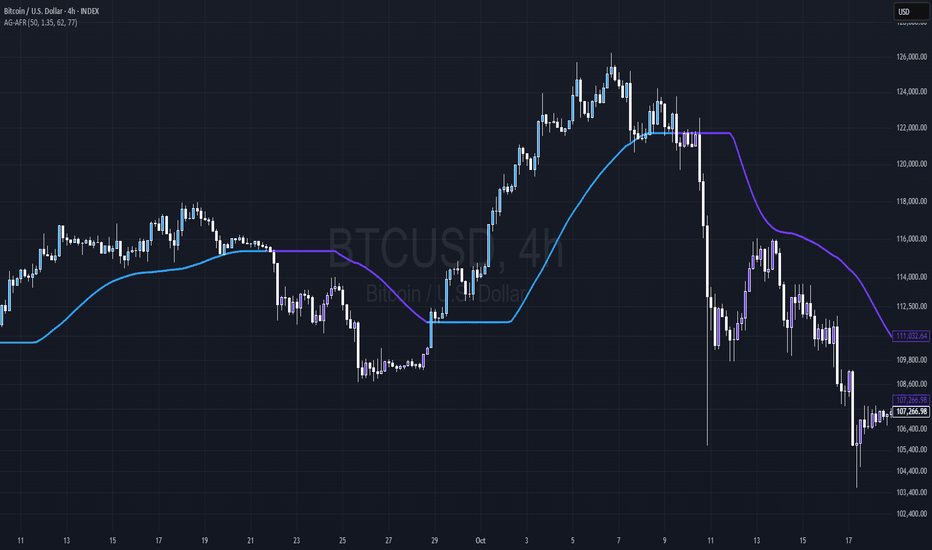
Adaptive Gaussian AFR# Adaptive Gaussian AFR (Average Filtering Range)
The **Adaptive Gaussian AFR** is a sophisticated trend-following overlay designed to provide a "cleaner" perspective on market structure. It synthesizes advanced signal processing with volatility-adjusted trailing logic to create a perpetual trend indicator that filters noise while maintaining extreme responsiveness during momentum breakouts.
## How It Works
This indicator combines three distinct mathematical principles to analyze and visualize price action:
### 1. 4-Pole Gaussian Smoothing
Standard moving averages often suffer from a trade-off between smoothness and lag. By employing a **4-pole Gaussian filter**, the indicator applies a bell-curve weighting to price data. This results in a curve that is mathematically smoother than an EMA but reacts more sharply to significant price shocks.
### 2. Adaptive Volatility Scaling
Unlike static indicators, this script utilizes a **Volatility Ratio** (comparing short-term ATR to long-term ATR).
- **Expansion:** When volatility spikes, the Gaussian filter automatically shortens its lookback to "catch" the breakout.
- **Contraction:** When the market consolidates, it lengthens the lookback to prevent "whipsaws" and false signals.
### 3. AFR (Average Filtering Range) Logic
The "step-ladder" behavior is driven by the AFR logic. It calculates volatility-based boundaries (using an ATR factor). The trend line only moves higher if the price exceeds the current floor, and only moves lower if the price breaks the ceiling, creating a "perpetual" support and resistance level.
## Visual Interface & Branding
The script features a high-visibility sentiment map using a custom brand color scheme:
- **Bullish State (Blue - rgb(45, 162, 252)):** Triggered when price is trading above the Adaptive Gaussian mean and the AFR floor.
- **Bearish State (Purple - rgb(113, 59, 249)):** Triggered when price breaks below the mean and the AFR ceiling.
- **Brand Candles:** Price bars are automatically colored to match the trend state for immediate visual confirmation.
## Why This is Unique
Most trend followers are "fixed"—they perform well in trending markets but fail in sideways chop. The uniqueness of the **Adaptive Gaussian AFR** lies in its ability to "breathe." Because the Gaussian engine is adaptive, it attempts to solve the "lag vs. noise" problem by becoming more rigid when the market is indecisive and more fluid when a trend is confirmed.
## Great inventions require great Care
**This is not a standalone trading system.** While the Adaptive Gaussian AFR provides a highly refined view of the trend, it should be used in conjunction with other analysis tools.
- **Lag:** Like all indicators based on historical data, the filter is inherently lagging and cannot predict future price movements.
- **No Standalone Use:** Do not use this as your sole reason for entering or exiting a trade. It is best used as a **Trend Filter** or a **Volatility-Adjusted Entry/Exit Strategy in confluence with other tools**.
- **Context Matters:** It does not account for fundamental news, higher-timeframe resistance, or volume profiles.
Enjoy!
Indikator
Indikator

VWATR Stop-Loss BandsPurpose
The script provides an adaptive stop‑loss framework built from VWATR, it anchors protective levels to price extremes and scales them with both volatility and volume. The objective is to create stop‑loss zones that reflect real market intensity rather than arbitrary fixed distances.
How it works
The script computes true range, multiplies it by volume, and smooths both the volume‑weighted range and raw volume using the selected moving average, their ratio forms VWATR, a volatility measure normalized by traded volume. It then calculates the standard deviation of VWATR to capture volatility‑of‑volatility. Stop‑loss levels are constructed by offsetting the low and high by one VWATR, with additional layers created by adding or subtracting one to five standard deviations. The plots use strong colors for core levels and progressively lighter tones for outer layers, establishing a clear visual hierarchy.
Rationale
This structure gives the trader stop‑loss levels that adapt to changing market conditions, expanding during high‑energy phases and contracting during quiet periods, which reduces premature stop‑outs and aligns risk with actual volatility. The standard deviation layers provide a graded map of volatility stress, allowing the user to assess how far price must travel to breach increasingly extreme thresholds. The result is a stop‑loss system that is both reactive and context‑aware, offering more informed decision‑making than static offsets. Indikator

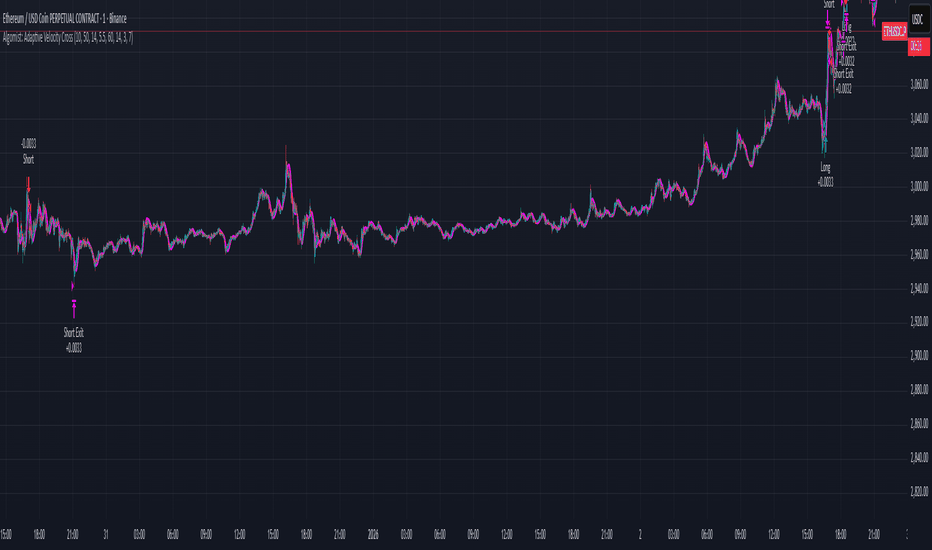
Algomist.app v1.0🚀 WMA Crossover Momentum Scalper: Algomist.app AUTO-EXECUTION
This strategy is a momentum-based trend-following system optimized for fully automated, high-frequency trade execution via algomist.app webhooks. It systematically enters trades based on a powerful moving average crossover, confirmed by both volume and volatility filters.
⚙️ Core Strategy Logic
This script is designed to capture short- to medium-term moves in trending markets by combining three key indicators:
Trend Confirmation (WMA Crossover): The primary signal is generated when a Fast WMA (50-period) crosses the Slow WMA (100-period). This crossover confirms the shift in the prevailing trend direction.
Volume Filter (VWAP): The trade is only taken if the price is trading above the VWAP for Long entries, or below the VWAP for Short entries. This ensures the trade is aligned with the asset's average price relative to trading volume.
Volatility Filter (ATR): A minimum Average True Range (ATR) filter is applied. This is critical for avoiding entries during periods of extreme low volatility ("chop"), ensuring the market has enough movement to justify the trade.
🔗 Algomist.app Automation Ready
This is the most important feature. The script contains custom-coded alert() functions that output a perfect JSON payload, making it 100% compatible with the algomist.app webhook infrastructure.
Seamless Execution: The strategy instantly transmits all required parameters—symbol, side, entry_price, dynamic stop_loss, and dynamic take_profit—directly to your MT5 terminal through the algomist.app connector.
Simple Setup: To enable live automation, you only need to configure a TradingView alert using the provided webhook URL and the {{strategy.order.alert_message}} placeholder on the bar's close.
Default Asset: The webhook is pre-configured to trade the ETHUSDC symbol. This can be easily adapted to other crypto or Forex pairs within the algomist.app settings.
🛡️ Dynamic Risk Management (ATR-Based)
Risk management is dynamic, ensuring the Stop Loss and Take Profit levels automatically adapt to current market volatility:
Stop Loss (SL): Placed at a customizable (x) * ATR distance from the entry price. The default setting is 3.0x ATR.
Take Profit (TP): Placed at a customizable (x) * ATR distance from the entry price. The default setting is 9.0x ATR, offering a fixed Reward-to-Risk ratio of 3:1 (9.0 / 3.0).
Position Sizing: The script uses strategy.percent_of_equity = 10% for backtesting, but the algomist.app execution is based on an internal calculation using a small percentage (e.g., 5%) of a leveraged notional value for illustrative purposes. Users must set their risk size within the algomist.app platform.
Disclaimer: This script is provided as an example for Algomist.app users and is NOT financial advice. Backtest thoroughly across various assets and timeframes. Past performance is not indicative of future results. The user assumes all responsibility for live trading risk. Strategi
Indikator
Indikator
Volume Weighted ATRThis script implements a Volume‑Weighted Average True Range (VWATR) indicator, a variation of ATR that incorporates trading volume into the volatility calculation. Instead of treating all price movements equally, it amplifies true range during high‑volume periods and dampens it during low‑volume periods, producing a volatility measure that adapts to liquidity conditions. The script begins by allowing the user to choose a lookback length and a smoothing method, offering RMA, SMA, EMA, or WMA for flexibility in how responsive the indicator should be.
The core of the calculation starts with the standard true range, which captures the most meaningful price movement of each bar. This true range is then multiplied by volume, creating a volume‑weighted true range that gives more importance to bars where market participation is higher. To ensure consistency, the script defines a custom moving‑average function that applies the selected smoothing method to any input series. This function is used twice: once to smooth the volume‑weighted true range and once to smooth volume itself.
The final VWATR value is obtained by dividing the smoothed volume‑weighted true range by the smoothed volume. Mathematically, this produces a volume‑weighted mean of true range, making the indicator more sensitive to volatility expansions that occur with strong participation and less reactive to low‑volume noise. The script concludes by plotting this VWATR line, giving traders a clean, adaptive measure of volatility that can be used for regime detection, breakout confirmation, or dynamic stop sizing
Indikator
Indikator

Indikator
Indikator

Indikator

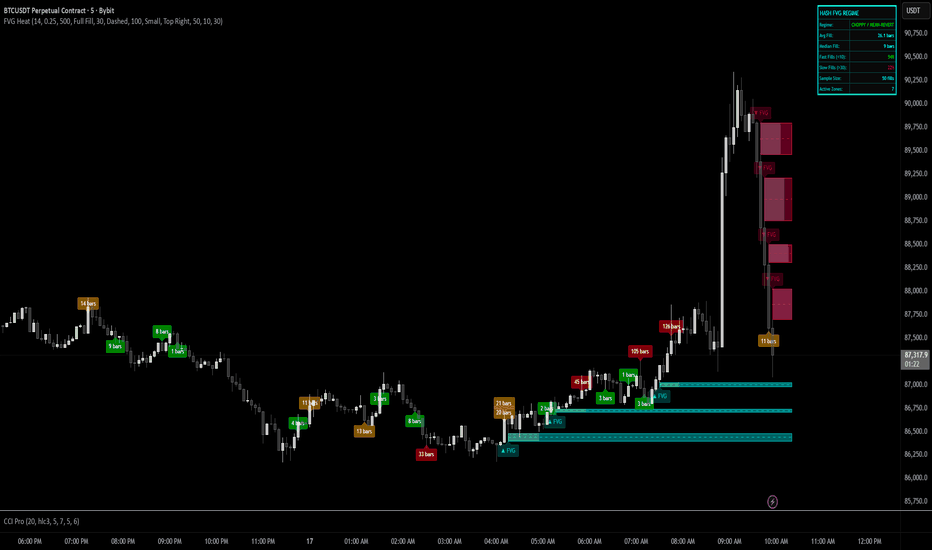
FVG Heatmap [Hash Capital Research]FVG Map
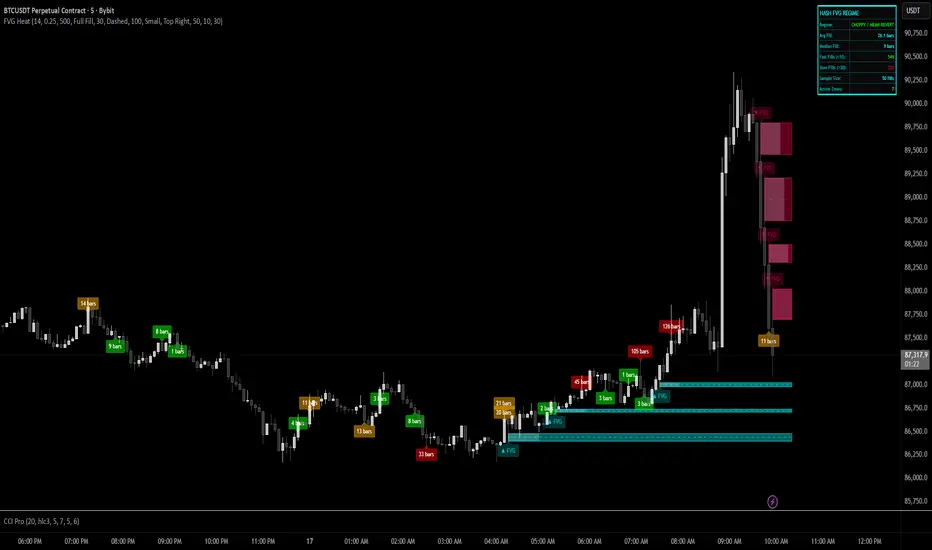
FVG Map is a visual Fair Value Gap (FVG) mapping tool built to make displacement imbalances easy to see and manage in real time. It detects 3-candle FVG zones, plots them as clean heatmap boxes, tracks partial mitigation (how much of the zone has been filled), and summarizes recent “fill speed” behavior in a small regime dashboard.
This is an indicator (not a strategy). It does not place trades and it does not publish performance claims. It is a market-structure visualization tool intended to support discretionary or systematic workflows.
What this script detects
Bullish FVG (gap below price)
A bullish FVG is detected when the candle from two bars ago has a high below the current candle’s low.
The zone spans from that prior high up to the current low.
Bearish FVG (gap above price)
A bearish FVG is detected when the candle from two bars ago has a low above the current candle’s high.
The zone spans from the current high up to that prior low.
What makes it useful
Heatmap zones (clean, readable FVG boxes)
Bullish zones plot below price. Bearish zones plot above price.
Partial fill tracking (mitigation progress)
As price trades back into a zone, the script visually shows how much of the zone has been filled.
Mitigation modes (your definition of “filled”)
• Full Fill: price fully trades through the zone
• 50% Fill: price reaches the midpoint of the zone
• First Touch: price touches the zone one time
Optional auto-cleanup
Optionally remove zones once they’re mitigated to keep the chart clean.
Fill-Speed Regime Dashboard
When zones get mitigated, the script records how many bars it took to fill and summarizes the recent environment:
• Average fill time
• Median fill time
• % fast fills vs % slow fills
• Regime label: choppy/mean-revert, trending/displacement, or mixed
How to use
Use FVG zones as structure, not guaranteed signals.
• Bullish zones are often watched as potential support on pullbacks.
• Bearish zones are often watched as potential resistance on rallies.
The fill-speed dashboard helps provide context: fast fills tend to appear in more rotational conditions, while slow fills tend to appear in stronger trend/displacement conditions.
Alerts
Bullish FVG Created
Bearish FVG Created
Notes
FVGs are not guaranteed reversal points. Fill-speed/regime is descriptive of recent behavior and should be treated as context, not prediction. On realtime candles, visuals may update as the bar forms. Indikator
Indikator

TRV & nTRV - Trimmed Range VolatilityGrid bots require stable volatility measurement - ATR becomes misleading when gaps and sudden spikes distort the average. TRV (Trimmed Range Volatility) is an advanced version of ATR: it filters outliers at the extremes (highest and lowest ranges) and remains unaffected by gaps. This provides real-time, accurate volatility measurement for grid bot setup.Grid bots require stable volatility measurement - ATR becomes misleading when gaps and sudden spikes distort the average. TRV (Trimmed Range Volatility) is an advanced version of ATR: it filters outliers at the extremes (highest and lowest ranges) and remains unaffected by gaps. This provides real-time, accurate volatility measurement for grid bot setup.
Why We Developed TRV?
When a gap or sudden spike occurs in the morning, this extreme movement affects standard ATR calculations for an extended period. Even if the price moves sideways for the rest of the day, ATR remains elevated. This causes grid bots to operate with unnecessarily wide spacing and execute fewer trades.
TRV Advantages:
✅ Unaffected by Gaps: Opening gaps don't distort the calculation
✅ Extreme Point Elimination: Filters the largest and smallest outlier candles
✅ Real-Time Accuracy: Shows current market volatility
✅ Grid Bot Optimization: Enables tighter and more efficient grid spacing
✅ Comparison Capability: Compare different stocks and timeframes with nTRV
Grid Bot Usage:
The TRV value is used directly to calculate the number of grid lines:
(Resistance - Support) / TRV = Number of Grid Lines
Example:
Resistance: $110
Support: $90
TRV: $2
Grid Count: (110-90)/2 = 10 grid lines
Features:
Two Filtering Modes: Manual (enter number) or Percentage-Based (automatic ratio)
Four Indicators in One: nTRV, TRV, ATR, and nATR all displayed on the same panel
nTRV: Normalized value (percentage-based, for stock comparison)
TRV: Absolute value (currency-based, for grid calculation)
ATR & nATR Included: Standard ATR and nATR for direct comparison with TRV
Comprehensive Analysis: Compare filtered (TRV) vs unfiltered (ATR) volatility side-by-side
Default: 10% top, 10% bottom outlier elimination
Conclusion:
TRV is an advanced version of ATR specifically designed for grid bot traders. By filtering outlier movements, it provides more stable and reliable volatility measurement. The indicator includes both TRV (filtered) and ATR (unfiltered) on the same chart, giving traders a comprehensive view to make informed decisions. This dual-display approach enables more efficient grid strategies and increased trading frequency. Indikator

Trinity Real Move Detector DashboardRelease Notes (critical)
1. This code "will" require tweaks for different timeframes to the multiplier, do not assume the data in the table is accurate, cross check it with the Trinity Real Move Detector or another ATR tool, to validate the values in the table and ensure you have set the correct values.
2. I mention this below. But please understand that pine code has a limitation in the number of security calls (40 request.security() calls per script). This code is on the limit of that threshold and I would encourage developers to see if they can find a way around this to improve the script and release further updates.
What do we have...
The Trinity Real Move Detector Dashboard is a powerful TradingView indicator designed to scan multiple assets at once and show when each one has genuine short-term volatility "energy" — the kind that makes directional options trades (especially 0DTE or short-dated) have a high probability of follow-through, and can be used for swing trading as well. It combines a simple ATR-based volatility filter with a SuperTrend-style bias to tell you not only if the market is "awake" but also in which direction the momentum is leaning.
At its core, the indicator calculates the current ATR on your chosen timeframe and compares it to a user-defined percentage of the asset's daily ATR. When the short-term ATR spikes above that threshold, it signals "enough energy" — meaning the underlying is moving with real force rather than choppy noise. The SuperTrend logic then determines bullish or bearish bias, so the status shows "BULLISH ENERGY" (green) or "BEARISH ENERGY" (red) when energy is on, or "WAIT" when it's not. It also counts how many bars the energy has been active and shows the current ATR vs threshold for quick visual confirmation.
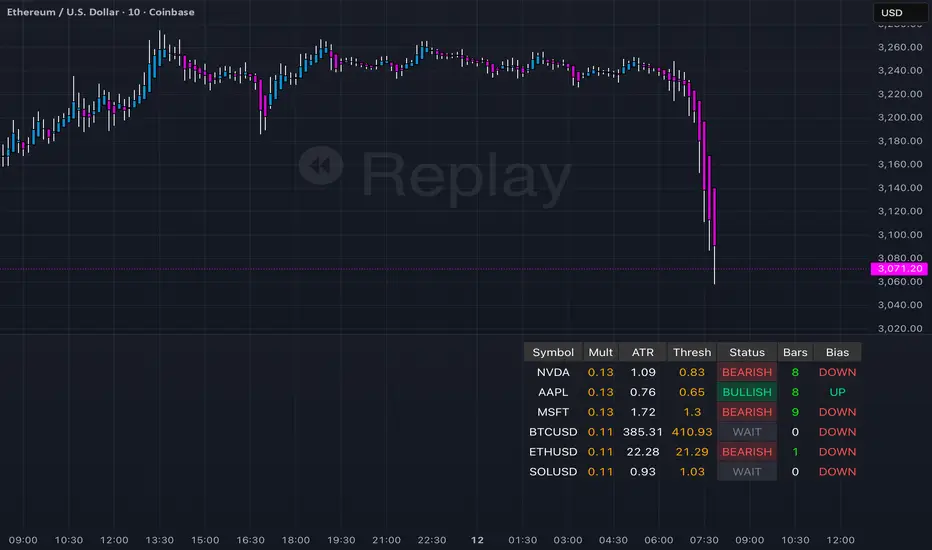
The dashboard displays all this in a clean table with columns for Symbol, Multiplier, Current ATR, Threshold, Status, Bars Active, and Bias (UP/DOWN). It's perfect for 3-minute charts but works on any timeframe — just adjust the multiplier based on the hints in the settings.
Editing symbols and multipliers is straightforward and user-friendly. In the indicator settings, you'll see numbered inputs like "1. Symbol - NVDA" and "1. Multiplier". To change an asset, simply type the new ticker in the symbol field (e.g., replace "NVDA" with "TSLA", "AVGO", or "ADAUSD"). You can also adjust the multiplier for each asset individually in the corresponding "Multiplier" field to make it more or less sensitive — lower numbers give more signals, higher numbers give stricter, higher-quality ones. This lets you customize the dashboard to your watchlist without any coding. For example, if you switch to a 4-hour chart or a slower-moving stock like AVGO, you may need to raise the multiplier (e.g., to 0.3–0.4) to avoid false "bullish" signals during minor bounces in a larger downtrend.
One important note about the multiplier and timeframes: the default values are optimized for fast intraday charts (like 3-minute or 5-minute). On higher timeframes (15-minute, 1-hour, 4-hour, or daily), the SuperTrend bias can be too sensitive with low multipliers (1.0 default in the code), leading to situations like the AVGO 4-hour example — where price is clearly downtrending, but the dashboard shows "BULLISH ENERGY" because the tight bands flip on small bounces. To fix this, you need to manually increase the multiplier for that asset (or all assets) in the settings. For 4-hour or daily charts, 0.25–0.35 is often better to match smoother SuperTrend indicators like Trinity. Always test on your timeframe and asset — crypto usually needs slightly lower multipliers than stocks due to higher volatility.
TradingView has a hard limit of 40 request.security() calls per script. Each asset in the dashboard requires several calls (current ATR, daily ATR, SuperTrend components, etc.), so with the full ATR-based bias, you can safely monitor about 6–8 assets before hitting the limit. Adding more symbols increases the number of calls and will trigger the "too many securities" error. This is a platform restriction to prevent excessive server load, and there's no official way around it in a single script. Some advanced coders use tricks like caching or lower-timeframe requests to squeeze in a few more, but for reliability, sticking to 6–8 assets is recommended. If you need more, the common workaround is to create two separate indicators (e.g., one for stocks, one for crypto) and add both to the same chart.
Overall, this dashboard gives you a professional-grade multi-asset scanner that filters out low-energy noise and highlights real momentum opportunities across stocks and crypto — all in one glance. It's especially valuable for options traders who want to avoid theta decay on weak moves and only strike when the market has true fuel. By tweaking the per-symbol multipliers in the settings, you can perfectly adapt it to any timeframe or asset behavior, avoiding issues like the AVGO false bullish signal on higher timeframes. Indikator

Indikator

ATR R-LevelsATR-R Levels is built for clarity of risk management.
The script takes your account size, chosen risk %, and the market’s volatility, then turns all of that into exact stop-loss, take-profit, and position size so there’s no guessing.
It’s inspired by key principles from NNFX, especially ATR-based stop placement and fixed-risk position sizing, but redesigned for fast intraday crypto trading. You get the same consistency and discipline NNFX is known for, adapted to a much shorter timeframe.
ATR-R Levels gives you:
A volatility-based stop using ATR
A clean 2R (or custom R-multiple) target
Automatic position sizing based on your risk rules
A simple HUD showing ATR, entry, stop, TP, size, and risk
Optional net profit estimates after fees
Let me know what you think or if you use it!
Indikator

Indikator

Trinity ATR Real Move DetectorTrinity ATR Real Move Detector
This ATR Energy Table indicator is one of the simplest yet most powerful filters you can have on a chart when trading short-dated or 0DTE options or swing trades on any timeframe from 1-minute up to 4-hour. Its entire job is to answer the single most important question in intraday and swing trading: “Does the underlying actually have enough short-term explosive energy right now to make a directional position worth the theta and the spread, or is this just pretty candles that will die in ten minutes?”
Most losing 0DTE and short-dated option trades happen because people buy or sell direction on a “nice-looking” breakout or pullback while the underlying is actually in low-energy grind mode. The premium decays faster than the move develops, and you lose even when you’re “right” on direction. This little table stops that from ever happening again.
Here’s what it does in plain English:
Every bar it measures two things:
- The current ATR on whatever timeframe you are using (1 min, 3 min, 5 min, 10 min, etc.). This tells you how big the average true range of the last 14 bars has been — in other words, how violently the stock or index is actually moving right now.
- The daily ATR (14-period on the daily chart). This is your benchmark for “normal” daily movement over the last two–three weeks.
It then multiplies the daily ATR by a small number (the multiplier you set) and compares the two. If the short-term ATR is bigger than that percentage of the daily ATR, the table turns bright green and says “ENOUGH ENERGY”. If not, it stays red and says “NOT ENOUGH”.
Why this works so well:
- Real explosive moves that carry for 0DTE and 1–3 DTE options almost always show a short-term ATR spike well above the recent daily average. Quiet grind moves never do.
- The comparison is completely adaptive — on a high-vol day the threshold automatically rises, on a low-vol day it automatically drops. You never have to guess if “2 points on SPY is big today”.
- It removes emotion completely. You simply wait for green before you even think about clicking buy or sell on an option.
Key settings and what to do with them:
- Energy Multiplier — this is the only number you ever touch. It is expressed as a decimal (0.15 = 15 % of the daily ATR). Lower = more signals, higher = stricter and higher win rate. The tooltip gives you the exact sweet-spot numbers for every popular timeframe (0.09 for 1-minute scalping, 0.13 for 3-minute, 0.14–0.16 for 5-minute, 0.15–0.19 for 10-minute, etc.). Just pick your timeframe once and type the number — done forever.
- ATR Length — leave it at 14. That’s the standard and works perfectly.
- Table Position — move the table to wherever you want on the chart (top-right, bottom-right, bottom-left, top-left).
- Table Size — make the text Tiny, Small, Normal or Large depending on how much screen space you have.
How this helps you make money and stop losing it:
- On most days you will see red 80–90 % of the time — that’s good! It is forcing you to sit on your hands instead of overtrading low-energy chop that eats premium.
- When it finally flips green you know institutions are actually pushing size right now — follow-through probability jumps from ~40 % to 65–75 % depending on the stock and timeframe.
- You stop buying calls on every green candle and puts on every red candle. You only strike when the market is genuinely “awake”.
- Over a week you take dramatically fewer trades, but your win rate and average winner size go way up — which is exactly how consistent intraday option profits are made.
In short, this tiny table is the closest thing to an “edge on/off switch” that exists for short-dated options. Red = preserve capital and go do something else. Green = pull the trigger with confidence. Use it religiously and you’ll immediately feel the difference in your P&L. Indikator

Indikator

Adaptive Risk Management [sgbpulse]1. Introduction:
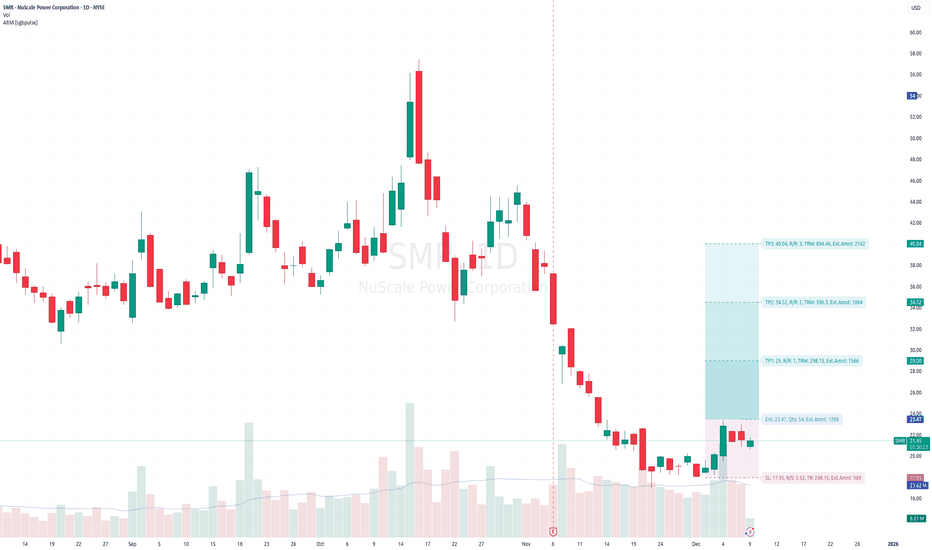
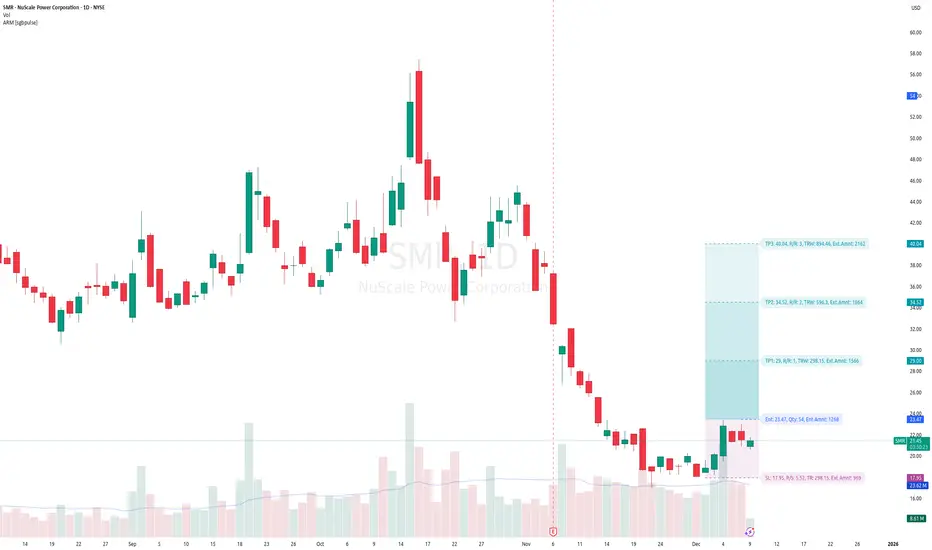
Adaptive Risk Management is an advanced indicator designed to provide traders with a comprehensive risk management tool directly on the chart. Instead of relying on complex manual calculations, the indicator automates all critical steps of trade planning. It dynamically calculates the estimated Entry Price , the Stop Loss location, the required Position Size (Quantity) based on your capital and risk limits, and the three Take Profit targets based on your defined Reward/Risk ratios. The indicator displays all these essential data points clearly and visually on the chart, ensuring you always know the potential risk-reward profile of every trade.
ARM : The A daptive R isk M anagement every trader needs to ARM themselves with.
2. The Critical Importance of Risk Management
Proper risk management is the cornerstone of successful trading. Consistent profitability in the market is impossible without rigorously defining risk limits.
Risk Control: This starts by setting the maximum risk amount you are willing to lose in a single trade (Risk per Trade), and limiting the total capital allocated to the position (Max Capital per Trade).
Defining Boundaries (Stop Loss & Take Profit): It is mandatory to define a technical Stop Loss and a Take Profit target. A fundamental rule of risk management is that the Reward/Risk Ratio (R/R) must be a minimum of 1:1.
3. Core Features, Adaptivity, and Customization
The Adaptive Risk Management indicator is engineered for use across all major trading styles, including Swing Trading, Intraday Trading, and Scalping, providing consistent risk control regardless of the chosen timeframe.
Real-Time Dynamic Adaptivity: The indicator calculates all risk management parameters (Entry, Stop Loss, Quantity) dynamically with every new bar, thus adapting instantly to changing market conditions.
Trend Direction Adjustment: Define the analysis direction (Long/Uptrend or Short/Downtrend).
Intraday Session Data Control: Full control over whether lookback calculations will include data from Extended Trading Hours (ETH), or if the daily calculations will start actively only from the first bar of Regular Trading Hours (RTH).
Status Validation: The indicator performs critical status checks and displays clear Warning Messages if risk conditions are not met.
4. Intuitive Visualization and Real-Time Data
Dynamic Tracking Lines: The Entry Price and Stop Loss lines are updated with every new bar. Crucially, the length of these lines dynamically reflects the calculation's lookback range (e.g., the extent of Lookback Bars or the location of the confirmed Pivot Point), providing a visual anchor for the calculated price.
Risk and Reward Zones: The indicator creates a graphical background fill between Entry and Stop Loss (marked with the risk color) and between Entry and the Reward Targets (marked with the reward color).
Essential Information Labels: Labels are placed at the end of each line, providing critical data: Estimated Entry Price, Stock/Contract Quantity (Quantity), Total Entry Amount, Estimated Stop Loss, Risk per Share, Total Financial Risk (Risk Amount), Exit Amount, Estimated Take Profit 1/2/3, Reward/Risk Ratio 1/2/3, Total Reward 1/2/3, TP Exit Amount 1/2/3.
4.1. Data Window Metrics (16 Full Series)
The indicator displays 16 full data series in the TradingView Data Window, allowing precise tracking of every calculation parameter:
Entry Data: Estimated Entry, Quantity, Entry Amount.
Risk Data (Stop Loss): Estimated Stop Loss, Risk per Share, Risk Amount, Exit Amount.
Reward Data (Take Profit): Estimated Take Profit 1/2/3, Reward/Risk Ratio 1/2/3, Total Reward 1/2/3, TP Exit Amount 1/2/3.
4.2. Instant Tracking in the Status Line
The indicator displays 6 critical parameters continuously in the indicator's Status Line: Estimated Entry, Quantity, Estimated Stop Loss, Estimated Take Profit 1/2/3.
5. Detailed Indicator Inputs
5.1 General
Focused Trend: Defines the analysis direction (Uptrend / Downtrend).
Max Capital per Trade: The maximum amount allocated to purchasing stocks/contracts (in account currency).
Risk per Trade: The maximum amount the user is willing to risk in this single trade (in account currency).
ATR Length: The lookback period for the Average True Range (ATR) calculation.
5.2 Intraday Session Data Control
Regular Hours Limitation : If enabled, all daily lookback calculations (for Entry/Stop Loss anchor points) will begin strictly from the first Regular Trading Hours (RTH) bar. This limits the lookback range to the current RTH session, excluding preceding Extended Trading Hours (ETH) data. Only relevant for Intraday charts. Default: False (Off)
5.3 Entry Inputs
Entry Method: Selects the entry price calculation method:
Current Price: Uses the closing price of the current bar as the estimated entry point (Market Entry).
ATR Real Bodies Margin :
- Uptrend: Calculates the Maximum Real Body over the lookback period + the calculated safety margin.
- Downtrend: Calculates the Minimum Real Body over the lookback period - the calculated safety margin.
ATR Bars Margin :
- Uptrend: Calculates the Maximum High price over the lookback period + the calculated safety margin.
- Downtrend: Calculates the Minimum Low price over the lookback period - the calculated safety margin.
Lookback Bars: The number of bars used to calculate the extremes in the ATR-based entry methods (Relevant only for ATR Real Bodies Margin and ATR Bars Margin methods).
ATR Multiplier (Entry): The multiplier applied to the ATR value. The result of the multiplication is the calculated safety margin used to determine the estimated Entry Price.
5.4 Risk Inputs (Stop Loss)
Risk Method: Selects the Stop Loss price calculation method.
ATR Current Price Margin :
- Uptrend: Entry Price - the calculated safety margin.
- Downtrend: Entry Price + the calculated safety margin.
ATR Current Bar Margin :
- Uptrend: Current Bar's Low price - the calculated safety margin.
- Downtrend: Current Bar's High price + the calculated safety margin.
ATR Bars Margin :
- Uptrend: Lowest Low over lookback period - the calculated safety margin.
- Downtrend: Highest High over lookback period + the calculated safety margin.
ATR Pivot Margin :
- Uptrend: The first confirmed Pivot Low point - the calculated safety margin.
- Downtrend: The first confirmed Pivot High point + the calculated safety margin.
Lookback Bars: The lookback period for finding the extreme price used in the 'ATR Bars Margin' calculation.
ATR Multiplier (Risk): The multiplier applied to the ATR value. The result of the multiplication is the calculated safety margin used to place the estimated Stop Loss. Note: If set to 0, the Stop Loss will be placed exactly at the technical anchor point, provided the Minimum Margin Value is also 0.
Minimum Margin Value: The minimum price value (e.g., $0.01) the Stop Loss margin buffer must be.
Pivot (Left / Right): The number of bars required on either side of the pivot bar for confirmation (relevant only for the ATR Pivot Margin method).
5.5 Reward Inputs (Take Profit)
Show Take Profit 1/2/3: ON/OFF switch to control the visibility of each Take Profit target.
Reward/Risk Ratio 1/ 2/ 3: Defines the R/R ratio for the profit target. Must be ≥1.0.
6. Indicator Status/Warning Messages
In situations where the Stop Loss location cannot be calculated logically and validly, often caused by a mismatch between the configured Focused Trend (Uptrend/Downtrend) and the actual price action, the indicator will display a warning message, explaining the reason and suggesting corrective action.
Status Message 1: Pivot reference unavailable
Condition: The Stop Loss is set to the "ATR Pivot Margin" method, but the anchor point (Pivot) is missing or inaccessible.
Message Displayed: "Pivot reference unavailable. Wait for valid price action, or adjust the Regular Hours Limitation setting or Pivot Left/Right inputs."
Status Message 2: Calculated Stop Loss is unsafe
Condition: The calculated Stop Loss is placed illogically or unsafely relative to the trend direction and the Entry price.
Message Displayed: "Calculated Stop Loss is unsafe for current trend. Wait for valid price action or adjust SL Lookback/Multiplier."
7. Summary
The Adaptive Risk Management (ARM) indicator provides a seamless and systematic approach to trade execution and risk control. By dynamically automating all critical trade parameters—from Entry Price and Stop Loss placement to Position Sizing and Take Profit targets—ARM removes emotional bias and ensures every trade adheres strictly to your predefined risk profile.
Key Benefits:
Systematic Risk Control: Strict enforcement of maximum capital allocation and risk per trade limits.
Adaptivity: Dynamic calculation of prices and quantities based on real-time market data (ATR and Lookback).
Clarity and Trust: Clear on-chart visualization, precise data metrics (16 series), and unambiguous Status/Warning Messages ensure transparency and reliability.
ARM allows traders to focus on strategy and analysis, confident that their execution complies with the core principles of professional risk management.
Important Note: Trading Risk
This indicator is intended for educational and informational purposes only and does not constitute investment advice or a recommendation for trading in any form whatsoever.
Trading in financial markets involves significant risk of capital loss. It is important to remember that past performance is not indicative of future results. All trading decisions are your sole responsibility. Never trade with money you cannot afford to lose.
Indikator