5 EMA | 10 EMA | 15 SMA | 200 EMA Exponential Moving Averages that smooth price data by giving more weight to recent prices, used to track market momentum and trend direction.Indikatoroleh truffaelisaDiupdate 3
Smart Money Flow SMC Liquidity Voids EditionThis script is based on "Smart Money Concepts " © LuxAlgo Licensed under CC BY-NC-SA 4.0 Original: ━━━━━━━━━━━━━━━━━━━━━━━━━━━━━━━━━━━━━ WHAT'S NEW IN THIS VERSION ━━━━━━━━━━━━━━━━━━━━━━━━━━━━━━━━━━━━━ 🔷 Liquidity Voids Module (new) Detects price gaps larger than a configurable ATR(144) threshold and renders each void as 13 stacked gradient sub-boxes. Each void tracks its own filled/unfilled state — when price trades through it, the boxes transition to a neutral color or are removed dependinIndikatoroleh fabricionicolauxxDiupdate 510
ENG CAPITAL SEASONALITY INDICATOR (MEVSIMSELLIK)İşte hem Türkçe hem İngilizce açıklama metni — kopyalayıp yapıştırabilirsin: 🇹🇷 Türkçe Bu indikatör, bir hissenin yılın belirli ay ve haftalarında tarihsel olarak nasıl performans sergilediğini gösterir. Son 3, 5, 8 ve 10 yıllık geçmişe bakarak mevcut ay ve hafta için kazanma oranı (WIN%) ile ortalama getiriyi hesaplar. Tüm hesaplamalar günlük (D) zaman diliminde yapılır — grafik zaman dilimini değiştirseniz bile sonuçlar sabit kalır. Tablo sütunları: POZ (pozitif kapanan yıl sayısı) | TOP (topIndikatoroleh ENG_CAPITAL118
Equity Internals MonitorThis indicator uses 3 Ratios for intraday trading with the ES. NQ/ES RTY/ES HYG/IEF CONV ON: Bullish CONV OFF: Bearish NARROW: Possible fade into strength CREDIT: Credit leading equities lower NO LEAD: Neutral Indikatoroleh BohlmandoDiupdate 7
RSI Tien TradingĐây là chỉ báo mua bán được test chưa chính xác , mọi người cẩn thận trước khi áp dụngIndikatoroleh tipegooar6
customdate2026ORCr aew vfdsavda vew evaw vteaw vtawvawtv aw tvawetewatbvwavtawv awevtawbteawvaewveawIndikatoroleh neo_potato_th2
Customdatecustomdate ROC ROC ROC ROC ewtet Ewtwetew ewtwet t42 t243t 2kt'l4t 4 dfasgm'awegjIndikatoroleh neo_potato_th8
UM Market Internals Table: TICK / PUT-CALL / ADV-DEC / VIXMARKET INTERNALS DASHBOARD Real-time intraday breadth, sentiment & volatility — all in one table Inspired by John Carter's book, Mastering the Trade. ━━━━━━━━━━━━━━━━━━━━━━━ SUMMARY ━━━━━━━━━━━━━━━━━━━━━━━ A real-time dashboard that consolidates four key market internals into a single color-coded table overlay. Designed to give traders an at-a-glance read on intraday market breadth, sentiment, and volatility bias — all configurable to fit individual trading styles. ━━━━━━━━━━━━━━━━━━━━━━━ Indikatoroleh UnderwearMillionaire323
Linear Regression Channel 2DIndicateur de régression linéaire avec les 2 droites de régression linéaires ±1σ et ±2σIndikatoroleh Magtahl21
Psych Levels [SkaleHub]Overview Markets notoriously react to whole, round numbers. This indicator automatically plots subtle background lines at these psychological grid points to highlight the invisible structural walls of the market. The Edge It highlights the exact areas where retail traders typically place their stop-losses and take-profit orders, and where price action frequently stalls out or reverses due to heavy institutional option clustering. Key Features: Algorithmic Grid: Automatically calculates and drIndikatoroleh SkaleHub4
Volatility Bands [SkaleHub]Overview A clean, branded take on standard volatility bounds. It gently shades the extreme overbought or oversold edges of your chart. The Edge It serves as a visual guardrail, training beginners not to buy at the absolute top of a massive run and protecting capital during overextended market conditions. Key Features: Extreme Zone Highlighting: Visually shades the outer edges of price action (Red for overbought, Green for oversold) to easily identify stretched markets. Capital Protection GuaIndikatoroleh SkaleHub7
Trend Ribbon [SkaleHub]Overview A highly visual, simplified moving average ribbon. It tracks the space between a fast and slow moving average to determine trend strength. The Edge The ribbon dynamically fades in color as the short-term trend loses momentum, giving traders a smooth, action-oriented look into shifts in market power. Key Features: Visual Directional Bias: Instantly identifies macro trend direction with clear color-coding. Dynamic Momentum Fading: Ribbon transparency shifts automatically to warn you wIndikatoroleh SkaleHub401
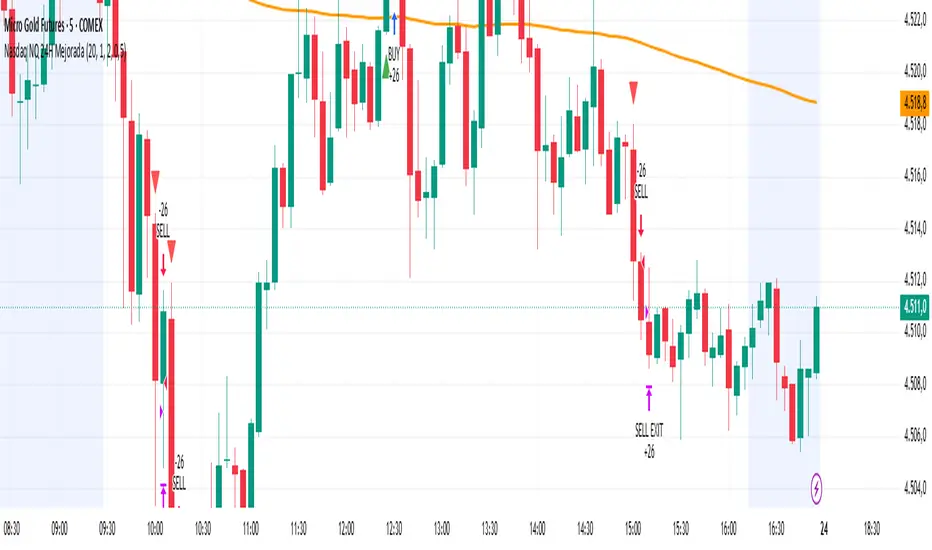
Nasdaq NQ 24H Mejoradau script está bien estructurado, pero tiene varios detalles importantes que pueden hacer que el robot opere mal o abra demasiadas operaciones en el NasdaqStrategioleh avaloscruzyanectamanda11
Clean MA Overlay PROClean MA Overlay PRO is a professional trend-following moving average system designed to combine clean market structure, volatility visualization, and real-time momentum strength analysis into a single lightweight overlay indicator. Unlike traditional moving averages that only show direction, this indicator measures the true angle of the moving average using ATR-normalized slope calculations. This creates a much more realistic representation of trend strength across all market conditions and tiIndikatoroleh Sachse-198010
harun sniperWhen he sees the market going up too much, he tells you that it will go up. When it goes down too much, he tells you that it will go upIndikatoroleh harun_abdulla0
SRENG-OB + MTF Candles + SMACambodia-ICT Macro Pro v3.0 – Professional Smart Money / ICT Toolkit for serious day traders This indicator combines the most requested ICT/SMC concepts into one clean, high-performance overlay tool – specially tuned for 1-minute to 15-minute trading. Main features: • 10 predefined Macro session windows (Asian Midnight, Asian, Pre-London, London Open, London Macro, NY AM, NY Lunch, NY PM, NY Close + more) • 7 fully customizable Killzones with your own times & colors • Beautiful session boxes Indikatoroleh srengseangcheng_ga37
GOLD-4 Scalper M1w indicator???w indicator???w indicator???w indicator???w indicator???w indicator???w indicator???w indicator???w indicator???w indicator???w indicator???w indicator???w indicator???w indicator???w indicator???w indicator???w indicator???Indikatoroleh denasuperior12
Rolling VD RSIRolling cumulative volume delta RSI. Equation is same as traditional RSI, but uses volume delta as "up day" vs. "down day"Indikatoroleh vandalsemjj17
NAM RANGEchi bao nay minh lam ra de cho cac trader moi su dung mien phi de giup kiem tien on dinh hon ko alli in hay trai nghiem va backtest nhieu hon Indikatoroleh duongquanglong196317
My strategy 9daily high and low, hourly high and low, 30 minute high and low, 15 minute high and low.Strategioleh klowdcossey993
Trading System v2.1TRADING SYSTEM INDICATOR. multiple confluences. VWAP EMA LIQUIDITYIndikatoroleh Booth-202613
UT BOT - SHAH 200/50 EmaUT BOT - based on 200/50 Ema crossing for buy and sell signal, safe and soundStrategioleh Syed_Shah_Hassan25
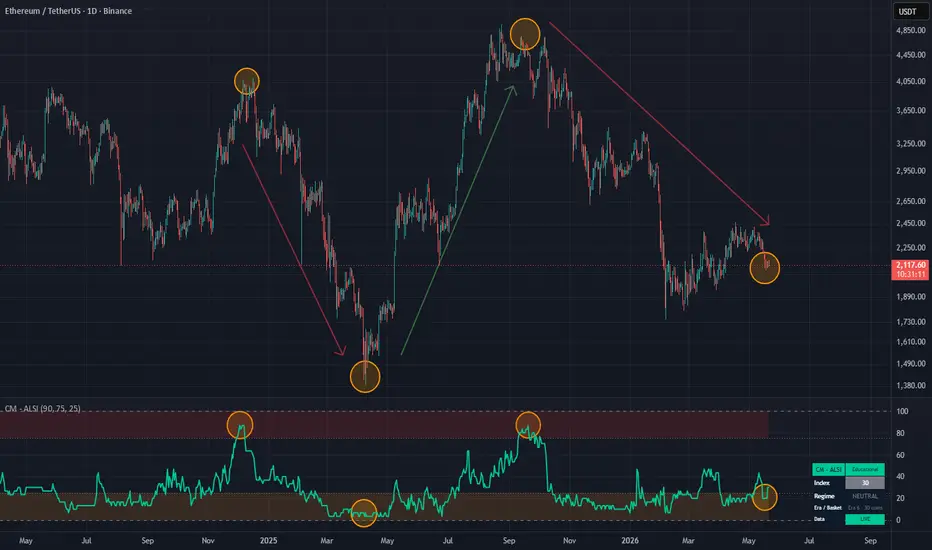
Altcoin Season Index [Dynamic Eras] | CriptoMatikoThe Altcoin Season Index measures the percentage of top altcoins that have outperformed Bitcoin over a configurable rolling window (default: 90 days). Values above 75 indicate Altcoin Season; values below 25 indicate Bitcoin Season. ───────────────────────────────────────────── WHAT MAKES THIS VERSION DIFFERENT ───────────────────────────────────────────── Most Altcoin Season Index implementations use a fixed basket of coins evaluated against a static lookback window. This version solves twoIndikatoroleh Vernon_CriptoMatiko75