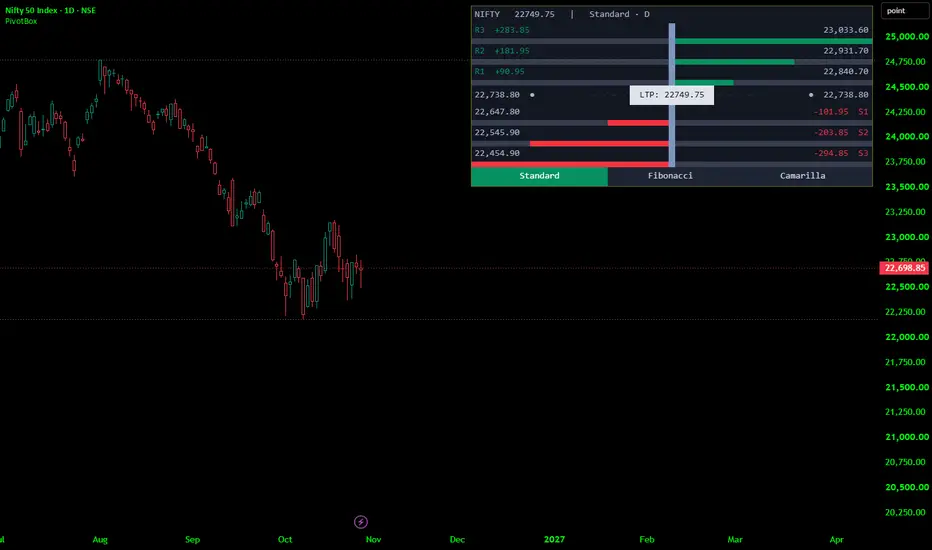
Pivot Dashboard [KG]Pivot Dashboard that draws a floating, table-style information panel on top of the price chart. The panel presents the seven classic pivot levels — three resistances, the central pivot, and three supports — for a chosen timeframe and a chosen pivot formula, and it surrounds each level with a compact set of visual aids: the exact price, the distance from the current price, and a horizontal bar that shows how far that level sits from the market relative to the other levels on screen.
The panel is
Indikator