Indikator

Indikator

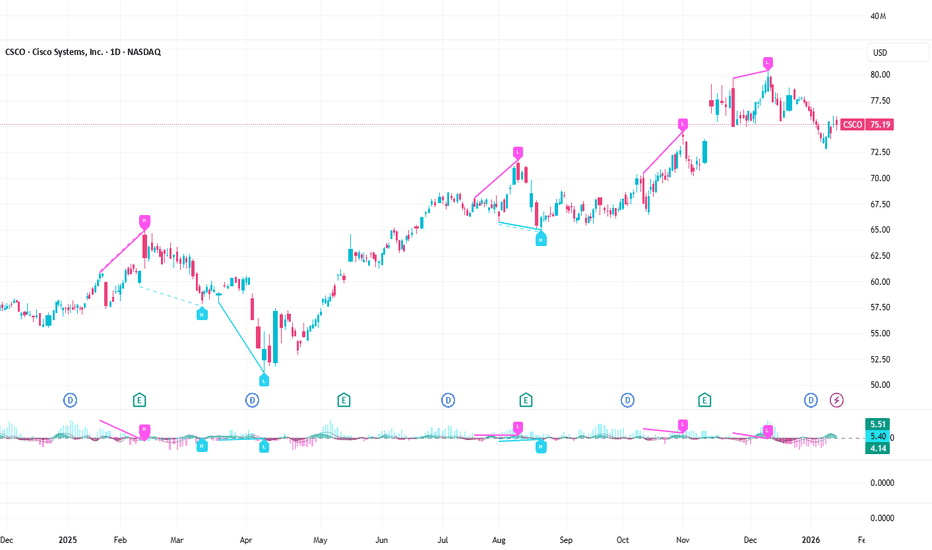
MB-MACD## Description
**MB-MACD** is a custom Pine Script indicator designed to enhance momentum analysis by combining a volume-based "Main Buy Ratio" (MB) calculation with a traditional MACD oscillator. The MB Ratio estimates institutional buying pressure by apportioning volume based on the candle's range and close position, providing a unique proxy for "smart money" flow. This smoothed MB value is then used as the source for MACD computation, allowing for divergence detection between price action, the MB line, and the MACD Histogram.
Key features include:
- **MB Line**: A histogram-style plot showing smoothed buy/sell ratio, colored bullishly (teal) or bearishly (pink) based on direction.
- **MACD Histogram**: Standard MACD applied to the MB source, with optional smoothing.
- **Divergence Detection**: Identifies bullish and bearish divergences on both the MB line and MACD Histogram, with configurable filters for momentum decay and zero-line alignment.
- **Visualization Options**: Display divergence lines and labels in the indicator pane or synced as an overlay on the main chart for better context.
- **Alerts**: Triggers for bullish or bearish divergences to notify users of potential reversal setups.
This indicator is particularly useful for swing traders and momentum followers looking to spot hidden divergences that may signal trend reversals or continuations. It emphasizes risk management by highlighting where price and momentum decouple, but remember: divergences are probabilistic signals and should be confirmed with other tools.
As this is a community-shared script, I encourage users to test it thoroughly and provide feedback. If you spot any bugs, calculation errors, or improvements (e.g., edge cases with low-volume symbols or performance issues on certain timeframes), please comment below or reach out—your input helps refine it for everyone!
## User Manual
### Introduction
The **MB-MACD** indicator integrates volume analysis with MACD to detect divergences in price and momentum. The core innovation is the "Main Buy Ratio" (MB), which approximates buying vs. selling volume within each bar based on its range and close position. This MB value is smoothed and fed into a MACD calculation, enabling divergence scans on both the MB line and the resulting MACD Histogram.
Divergences occur when price makes higher highs/lower lows, but the oscillator (MB or Histogram) fails to confirm—often signaling potential reversals. The script offers flexible display options, filters to reduce false positives, and alerts for real-time notifications.
**Important Notes:**
- This is not financial advice; use it for educational purposes and backtest on your symbols/timeframes.
- Works best on liquid stocks or indices with reliable volume data (e.g., daily or higher timeframes).
- Performance may vary on low-volume assets or during after-hours trading.
- If you encounter issues (e.g., no divergences detected or rendering errors), check your chart settings and report them in the comments for community debugging.
### Inputs Explanation
The inputs are grouped for ease of configuration. Adjust them via the indicator's settings panel in TradingView.
#### Core Parameters
- **Show MB Line** (Default: True): Enables/disables the MB Ratio histogram plot.
- **Show MACD Histogram** (Default: True): Enables/disables the MACD line and histogram plots.
- **MB Smoothing (SMA)** (Default: 10, Min: 1): Length for smoothing the raw MB Ratio using a Simple Moving Average (SMA). Higher values reduce noise but may lag.
- **Pivot Lookback Length** (Default: 5, Min: 2): Bars to look back/forward for detecting price pivots (highs/lows) used in divergence logic.
- **Max Lines Kept** (Default: 100, Min: 10): Limits the number of divergence lines/labels to prevent chart clutter.
#### Display Settings
- **Show Lines (Indicator Pane)** (Default: True): Draws divergence lines on the MB line in the indicator pane.
- **Show Labels (Indicator Pane)** (Default: True): Adds labels (e.g., "L" for line divergence) at divergence points in the pane.
- **Show Hist Divergence Lines** (Default: True): Draws dashed lines for MACD Histogram divergences in the pane.
- **Show Hist Divergence Labels** (Default: True): Adds labels (e.g., "H" for histogram divergence) in the pane.
- **Sync Lines to Main Chart (Overlay)** (Default: True): Mirrors divergence lines and labels onto the main price chart for context (slightly offset for visibility).
#### Filters & Tolerance
- **Peak Alignment Tolerance (Bars)** (Default: 5, Min: 0): Allows flexibility in matching oscillator peaks/valleys to price pivots (e.g., within ±5 bars).
- **Max Divergence Distance (Bars)** (Default: 20, Min: 5): Maximum bars between two pivots for a valid divergence; prevents detecting overly distant signals.
- **Enable Momentum Decay Filter** (Default: True): For Histogram divergences, requires the current peak/valley to have a smaller absolute value than the previous (indicating convergence/decay).
- **Enable Zero-Side Filter** (Default: False): Ensures both peaks/valleys in a divergence are on the same side of the zero line (e.g., both positive or both negative).
#### MACD Settings
- **MACD Fast Length** (Default: 12): Fast EMA length for MACD.
- **MACD Slow Length** (Default: 26): Slow EMA length for MACD.
- **MACD Signal Length** (Default: 9): Smoothing length for the MACD signal line.
- **MACD Source Smoothing** (Default: 3, Min: 1): Additional SMA smoothing applied to the MB Ratio before MACD calculation.
### How It Works
1. **MB Ratio Calculation**: For each bar, the script computes the position of the close within the high-low range (0-1). This scales the volume into "buy" and "sell" portions, then derives a net ratio (-100% to +100%). It's smoothed via SMA for the final MB line.
2. **MACD Application**: The (optionally smoothed) raw MB is used as the MACD source, producing a MACD line, signal line, and histogram.
3. **Pivot Detection**: Uses Pine's `ta.pivothigh`/`ta.pivotlow` to find price highs/lows over the lookback period.
4. **Divergence Scanning**:
- **Bearish (on Highs)**: Price makes a higher high, but MB/Hist makes a lower high.
- **Bullish (on Lows)**: Price makes a lower low, but MB/Hist makes a higher low (closer to zero).
- Scans nearby bars for oscillator matches and applies filters.
5. **Rendering**: Lines/labels are drawn in the indicator pane or overlaid on the chart. Colors: Teal for bullish, Pink/Maroon for bearish.
6. **Cleanup**: Automatically removes old lines/labels to stay under the max limit.
### Interpreting the Outputs
- **MB Line (Columns)**: Positive (teal) indicates net buying pressure; negative (pink) shows selling. Watch for crossovers above/below zero as momentum shifts.
- **MACD Histogram (Area)**: Green/teal for positive momentum; red/maroon for negative. Widening bars suggest strengthening trends; narrowing indicates weakening.
- **Divergence Lines/Labels**:
- Solid lines: MB line divergences (thicker, labeled "L").
- Dashed lines: Histogram divergences (thinner, labeled "H").
- Bullish: Teal lines sloping up (potential bottom reversal).
- Bearish: Pink lines sloping down (potential top reversal).
- **Overlay on Chart**: Lines connect price pivots (or offset slightly for Histogram). Use this to visualize how divergences align with candlesticks.
- **Zero Line**: Gray horizontal line; divergences filtered by side if enabled.
**Example Usage**:
- On a daily stock chart, enable overlays and watch for a bullish "L" or "H" label near a price low—could signal a buy if confirmed by volume breakout.
- In a downtrend, bearish divergences on highs might warn of further downside.
### Alerts
- **Bullish Divergence (L or H)**: Triggers on any detected bullish divergence (MB or Histogram).
- **Bearish Divergence (L or H)**: Triggers on bearish divergences.
- Set up via TradingView's alert menu: Select the indicator, choose the condition, and customize the message (e.g., includes ticker).
### Troubleshooting / Known Issues
- **No Divergences Shown**: Increase "Peak Alignment Tolerance" or reduce filters. Ensure pivot length suits your timeframe (shorter for intraday).
- **Too Many Lines/Labels**: Lower "Max Lines Kept" or increase "Max Divergence Distance" to filter distant signals.
- **Performance on Low-Volume Symbols**: MB Ratio may be unreliable; test on high-volume assets first.
- **Rendering Errors**: If lines don't appear, check chart zoom or ensure "force_overlay=true" isn't conflicting with other indicators.
- **NaN/Undefined Values**: Rare on live data but possible in historical backtests; report with symbol/timeframe for fixes.
### Feedback and Contributions
This script is open for community improvement! If you find bugs (e.g., false positives in divergences, calculation edge cases, or UI glitches), or have suggestions (like additional filters or visualizations), please share in the comments. Your feedback helps make it better—let's debug and enhance it together! Indikator
Indikator

A Humbled Trader Strategy + ChecklistHumbled Trader Swing Strategy + Checklist
This indicator is a complete swing trading system based on the high-probability strategies popularized by Humbled Trader. It is designed to help traders identify trend breakouts and low-risk momentum pullbacks on the Daily Timeframe.
The script combines trend filtering, automated resistance lines, and specific entry triggers into a single chart overlay, complete with a real-time Strategy Checklist Dashboard to confirm your setups instantly.
🎯 Core Components
Trend Filter (Purple Line): The 200 Simple Moving Average (SMA). This acts as your long-term trend filter. We only look for long trades when the price is above this line.
Momentum Guide (Orange Line): The 8 Exponential Moving Average (EMA). This tracks short-term momentum. In a strong trend, price will "ride" this line. We look to enter when price pulls back to touch this area.
Multi-Month Resistance (Orange Horizontal Line): Automatically plots the highest price over the last X Months (adjustable). This helps you instantly visualize the key level the stock needs to break out from.
Checklist Dashboard: A real-time table that evaluates Trend, Resistance, and Momentum conditions to give you a clear "✅ ENTER", "🚀 GAP UP", or "⏳ WAIT" signal.
🛠 How It Works
This indicator scans for two specific setups:
1. The Daily Gap Up ("GAP" Label) This signal appears when a stock shows strong momentum by gapping up overnight.
Condition: The stock opens at least 3% higher (adjustable) than the previous day's Close AND opens above the previous day's High.
Trend: Must be above the 200 SMA.
Visual: Marked with a green "GAP" label on the chart.
2. The Trend Pullback ("ENTER" Signal) This is a trend-following entry that lets you join an existing move with lower risk.
Condition: The stock is in an uptrend but dips down to touch or test the 8 EMA.
Validation: The candle must show a "dip" (red candle or lower close) to ensure we are buying a pullback, not chasing a top.
Visual: The Dashboard "Action Signal" will turn orange and display "✅ ENTER".
📋 The Checklist Dashboard
Located in the corner of your chart, this table provides a live status report for the current bar:
Trend (> 200 SMA):
🟢 Bullish: Price is in an uptrend. Safe to look for entries.
🔴 Bearish: Price is below the 200 SMA. Stay away.
Above Resistance?:
🟢 Breakout: Price has cleared the multi-month resistance line.
⚪ ---: Price is currently below the key breakout level.
Near 8 EMA?:
🟢 Yes: Price is near the "value zone" (8 EMA) for a potential pullback entry.
Action Signal:
🚀 GAP UP: Strong momentum gap detected.
✅ ENTER: Valid pullback entry detected.
⏳ WAIT: No clear setup found.
⚙️ Settings
Momentum EMA Length: Default is 8. Controls the sensitivity of the pullback line.
Trend SMA Length: Default is 200. The standard for long-term trend filtering.
Gap Up % Threshold: Default is 3.0%. Minimum overnight gap size required to trigger a signal.
Resistance Lookback (Months): Default is 3. The script will look back this many months to find and draw the key resistance line.
Table Position: Move the checklist to any corner of your screen.
⚠️ Disclaimer
This tool is for educational purposes only and does not constitute financial advice. Always manage your risk and use a stop loss. Indikator

Toby Crabel's HisVolAs in Linda Raschke's Street smarts..... . This indicator shows the signals of Toby Crabel's Historical Volatility 6/100 strategy. The strategy assumes, that volatility contraction measured by two measures would give better results.
There is one other script that is a strategy , but it assumes that the signal requires both inside bar and narrowest range, what is not as in Linda Raschke's.
The strategy and what does the script do:
1) measures short-term unannualized volatility (by default six), long term uannualized volatility (by default 100), and measures the ratio of short volatility / long volatility.
2) checks if the current bar is an inside bar or has narrowest range out of last X bar (by default 4), or both,
3) puts an etiquette if short volatility / long volatility is equal to or smaller than 0,5 AND the day is inside bar, has narrowest range, or both.
Next day both buy-stop and sell-stop should be set. Buy-stop at the high and sell-stop at the low of the bar with etiquette.
This is by no means any financial advice, nor the historical results guarantee future gain.
Indikator

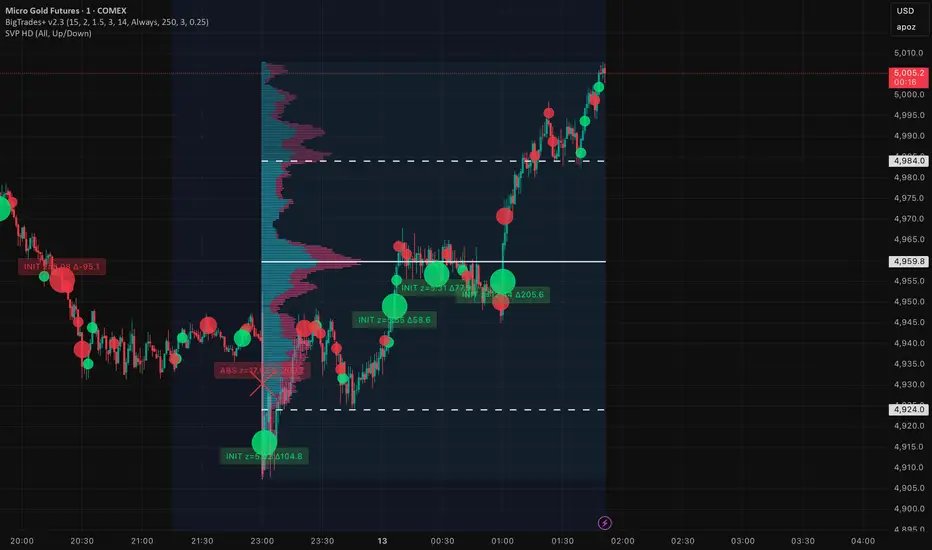
Big Trades [Volume Anomalies] (Enhanced)The script is a **volume-anomaly “big trades” detector** for futures that tries to (1) split each candle’s volume into a **buy-pressure** and **sell-pressure** estimate, (2) flag **statistically extreme** candles (tiers), and (3) optionally label those extremes as **initiative (follow-through)** vs **absorbed (no follow-through)** using a forward-style confirmation window.
Here’s what it does, piece by piece.
---
## 1) What it’s trying to detect
It’s not true “whale prints” or real bid/ask delta. It detects:
* **unusually large participation** (volume anomaly)
* with a **directional guess** (buy-ish vs sell-ish)
* and then checks whether price **continued** after that anomaly
So it’s: **“big participation + did it work?”**
---
## 2) The “buy vs sell volume” estimate
For each candle, it builds a **weight** for buy and sell pressure:
* **close location within the candle**
* close near high → more buy weight
* close near low → more sell weight
* **body direction (close–open)**
* bullish body adds buy boost
* bearish body adds sell boost
Then it computes:
* `raw_buy = volume * buy_weight`
* `raw_sell = volume * sell_weight`
This is an **OHLC-based proxy** for pressure, not real aggressor volume.
---
## 3) Normalization (makes it behave across sessions)
If enabled, it divides by ATR:
* `norm_buy = raw_buy / ATR`
* `norm_sell = raw_sell / ATR`
This helps a lot on futures because volume/volatility regimes differ between Asia/London/NY.
---
## 4) Statistical anomaly detection (z-score logic)
It calculates “what’s normal” using the last `lookback` bars, but **uses ` `** so the current bar doesn’t contaminate the stats (reduces flicker):
* `avg_buy = sma(norm_buy, lookback) `
* `std_buy = stdev(norm_buy, lookback) `
(and same for sell)
Then it computes **z-scores**:
* `z_buy = (norm_buy - avg_buy) / std_buy`
* `z_sell = (norm_sell - avg_sell) / std_sell`
If z-score crosses thresholds, it triggers tiers:
* Tier 1: `sigma`
* Tier 2: `sigma + tier_step1`
* Tier 3: `sigma + tier_step2`
So **Tier 3 = “big bubble”**.
---
## 5) Optional VWAP bias filter
It computes VWAP correctly as:
* `vwapv = ta.vwap(hlc3)`
If enabled:
* buys only when `close >= vwap`
* sells only when `close <= vwap`
This is just a **trend/bias filter** to reduce counter-trend bubbles.
---
## 6) Plotting (how bubbles appear)
It places markers at:
* buys around `(close+low)/2` (lower-ish)
* sells around `(close+high)/2` (upper-ish)
And draws:
* small/medium/large circles (depending on tier)
* with optional INIT/ABS overlays (explained next)
---
## 7) “Initiative vs Absorbed” classification (the smart part)
Because Pine can’t see the future on the same bar, your script does a **delayed evaluation**:
* It waits `N = confirm_bars`
* Looks at what happened from the signal bar to the current bar
* Decides if price moved far enough in the intended direction
It uses:
* `hh_window = highest(high, N+1)`
* `ll_window = lowest(low, N+1)`
(these cover the last N+1 bars: from signal bar to now)
Then it measures follow-through:
* For a buy signal N bars ago:
`buy_move = hh_window - high `
* For a sell signal N bars ago:
`sell_move = low - ll_window`
It compares to an ATR-based threshold anchored to the signal bar:
* `thr_move_sig = ATR * move_mult_atr`
If move > threshold → **INIT**
Else → **ABS**
Then it **plots back onto the original signal bar** using `offset=-N` so it visually marks the candle that caused it.
To make it obvious:
* **INIT** = circle
* **ABS** = X
This part is “accurate” in the sense that it’s purely **price-outcome based**.
---
## 8) Labels (optional)
If enabled, it prints labels on those large signals with:
* INIT/ABS
* the z-score at the signal bar
* and a “delta proxy” (`norm_buy - norm_sell`), not true delta
---
## In one sentence
The script flags **statistically extreme volume-pressure candles** (buy/sell proxy), and then classifies those extremes as **worked (initiative)** or **failed (absorbed)** based on **subsequent price movement** within `confirm_bars`.
Indikator

Opening Range {basic}Introduction
Opening range {basic} is a clean and reliable indicator designed to help traders visualize the opening range of a trading session with minimal setup and visual clutter.
This version focuses on the core components of opening range analysis, making it ideal for traders who want a simple, effective framework for identifying early-session structure across futures, forex and crypto markets.
Description
The indicator automatically calculates the opening range high, low and midpoint over a user-defined opening window (5m, 15m, 30m or 60m) within a selected trading session (default: NY session).
During the opening range window, the indicator dynamically tracks price to form the range. Once the opening range is complete, the high, low and midpoint are extended forward for the remainder of the session, providing clear reference levels that can be used for bias, mean reversion or breakout-based decision making.
A shaded fill highlights the opening range area, with an optional size display showing the total range in price units. Styling and logic are intentionally simplified to keep the chart clean and easy to interpret.
Features
Configurable opening range length
Choose between 5m, 15m, 30m or 60m opening ranges.
Session-based calculation
Opening range is calculated only within the selected trading session.
Opening range levels
Opening range high, low and midpoint.
Range fill & size display
Shaded fill between the opening range high and low.
Text showing total opening range size.
Clean, minimal design
Fixed line styles and thickness for clarity.
Dark and light theme support.
Minimal settings for fast, intuitive use.
Optimized performance
Designed for intraday timeframes compatible with the selected opening range length.
Terms & Conditions
This indicator is provided for educational and informational purposes only and does not constitute financial advice.
Trading involves risk and past performance is not indicative of future results.
The user assumes full responsibility for any trading decisions made using this indicator.
Indikator

Indikator

Indikator

Indikator

Indikator

Indikator
Indikator

The Strat - Multi-Timeframe Combo Analyzer## 📊 The Strat - Multi-Timeframe Combo Analyzer
This open-source indicator implements **The Strat** methodology, a universal price action framework developed by Rob Smith (@RobInTheBlack).
---
### 🎯 What is The Strat?
The Strat categorizes every candle into one of three scenarios based on its relationship to the previous bar:
| Type | Name | Definition |
|------|------|------------|
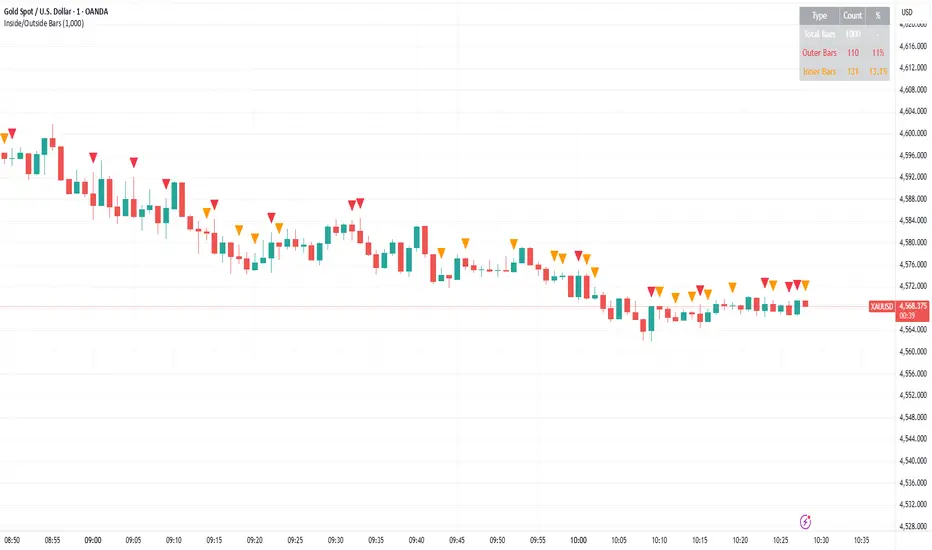
| **1** | Inside Bar | High < Previous High AND Low > Previous Low |
| **2** | Directional | Breaks only one side (2↑ = broke high, 2↓ = broke low) |
| **3** | Outside Bar | Breaks BOTH previous high AND low |
By tracking these bar types across timeframes, traders can identify actionable setups with defined entry triggers and target levels.
---
### ✨ Features
**Daily Timeframe Analysis:**
- Real-time 3-bar combo detection (2-1-2, 3-1-2, 1-2-2, etc.)
- Pattern classification: Bullish/Bearish Continuation or Reversal
- Entry and Target levels based on Strat rules
- Pattern status: ACTIONABLE, IN-FORCE, TRIGGERED, or WATCHING
**ATR Context:**
- Range % used (how much of daily ATR has been consumed)
- Entry quality assessment (Excellent → Exhausted)
- Day type classification (Quiet → Trend Day)
- Remaining range estimation
**15-Minute Analysis:**
- Separate combo tracking for intraday precision
- Pattern detection on lower timeframe
**Visuals:**
- Customizable info tables
- Entry/Target horizontal lines
- Signal labels on chart
- Alert conditions
---
### 🔧 How to Use
1. Look for **ACTIONABLE** patterns - these are setups waiting for a trigger
2. Entry triggers when price breaks the designated level
3. Target is the next logical Strat level (typically prior bar's high/low)
4. Use **Range%** to assess if there's room left in the daily range
5. Combine Daily and 15-Min combos for trade confluence
---
### ⚠️ Disclaimer
This indicator is for **educational purposes only**. It does not constitute financial advice or guarantee profitable trades. Trading involves substantial risk of loss. Past performance is not indicative of future results. Always conduct your own research and trade responsibly.
---
### 🙏 Credits
**The Strat** methodology was created by Rob Smith (@RobInTheBlack).
This implementation is open-source. Feel free to study, modify, and improve the code!
Indikator

Indikator

Market Structure [odnac]Overview
This indicator is a comprehensive tool designed for traders utilizing Smart Money Concepts (SMC) and Price Action. It automatically identifies and labels significant market structure shifts, specifically BOS (Break of Structure) and CHoCH (Change of Character), helping you stay on the right side of the trend.
Key Features
Dual Logic Modes (V1 & V2):
V1 (Fixed Pivot): Only utilizes confirmed pivot points. Ideal for conservative traders looking for major swing levels.
V2 (Dynamic Update): Automatically updates swing points to the actual highest high or lowest low between breaks. This provides a more fluid and accurate representation of price flow.
Smart Confirmation: Unlike basic pivot scripts, this indicator uses a multi-bar confirmation logic (checking candle polarity and close sequences) to filter out market noise and false pivots.
Automatic Trend Detection: The indicator tracks the current market bias (Bullish/Bearish) and visualizes it through customizable background colors or shapes.
Clear Visual Cues: * BOS: Indicates a continuation of the current trend.
CHoCH: Signals a potential trend reversal.
How to Use
Identify Trend Direction: Use the background coloring or the shapes at the bottom to quickly identify if the market is in a Bullish (Green) or Bearish (Red) phase.
Look for Structure Breaks: * When price breaks a previous high/low, the indicator will draw a line and label it as BOS if the trend continues, or CHoCH if the trend flips.
Customize for Your Assets: * For volatile assets like XLM or other cryptocurrencies, you can adjust the Swing Left/Right Bars inputs to filter for either micro-structures or macro-trends.
Input Settings
Version: Choose between V1 (Strict Pivots) and V2 (Dynamic Ranges).
Swing Left/Right Bars: Determines the sensitivity of high/low detection. Increase these values to find "stronger" structural points.
Trend Visualization: Toggle between Background fills, Shape markers at the bottom, or None for a cleaner look.
Show Swings: Toggle the visibility of the white circles marking confirmed pivot points.
Disclaimer
Market structure is a lagging indicator by nature as it requires confirmation. Always use this tool in conjunction with other technical analysis methods (Order Blocks, Fair Value Gaps, or Volume) for the best results.
Indikator

1-Year High/Low Mean (Daily Anchored)This indicator calculates the highest high and lowest low over the past year using daily candles, then plots the mean (midpoint) between those two levels. The result is a clean, stable structural reference line that helps traders understand where current price sits within its yearly range.
What It Shows
1‑Year High – the highest daily high over the lookback period
1‑Year Low – the lowest daily low over the same period
1‑Year Mean – the midpoint between the yearly high and low
These levels provide a long‑term framework for evaluating trend strength, momentum, and potential mean‑reversion behavior.
Designed for the Daily Timeframe
This indicator is intentionally built for the daily timeframe and higher.
All calculations are anchored to daily data, ensuring consistent and accurate yearly levels.
It does not display on intraday charts to avoid confusion caused by limited intraday history.
Features
Daily‑anchored yearly high, low, and mean
Adjustable lookback period (default: 365 days)
Optional display of the dates where the yearly high and low occurred
Clean, minimal, structure‑focused design
Intended Use
Ideal for traders who want a simple, reliable way to visualize long‑term price structure.
Pairs well with trend‑following systems, breakout strategies, and mean‑reversion setups.
Future versions may include shaded zones, alerts, multi‑year modes, or additional structural tools depending on community interest. Indikator

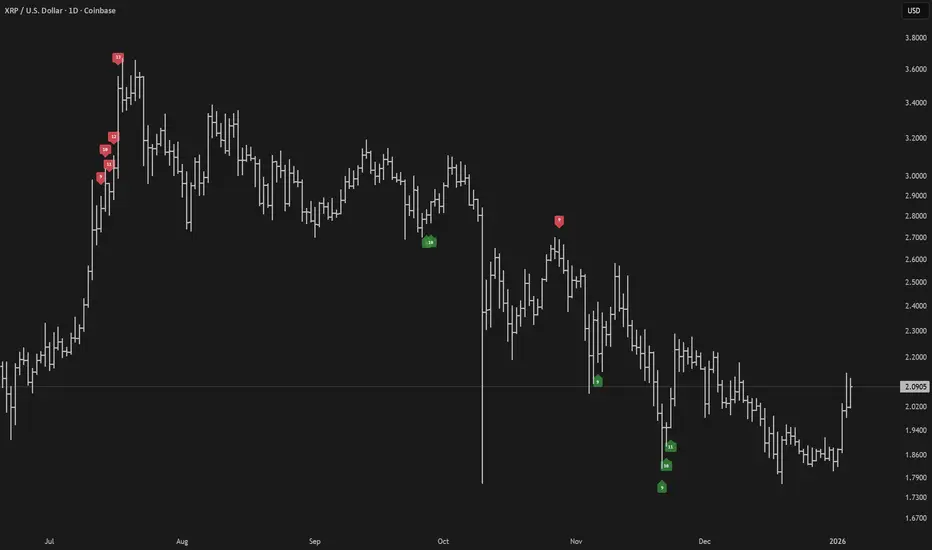
4 Bar Sequential Counter (9 to 13) [DotGain]4-Bar Sequential Counter (Seq4)
This indicator identifies potential trend exhaustion phases using a strict sequential count
based on the relationship between the current closing price and the closing price four bars earlier.
How it works
• A bullish sequence is counted as long as the current close remains below the close from 4 bars ago.
• A bearish sequence is counted as long as the current close remains above the close from 4 bars ago.
• The count resets immediately if the respective condition is no longer met.
• The sequence counts up to a maximum of 13 , after which it resets and a new sequence may begin.
Visualization
• Only counts from 9 to 13 are displayed on the chart.
• Bullish sequences are plotted below price bars.
• Bearish sequences are plotted above price bars.
• The minimalist design keeps the chart clean and focused on potentially relevant exhaustion zones.
Interpretation
• A count of 9 may indicate an early sign of market overextension.
• A count of 13 represents a more advanced sequence and a higher probability
of consolidation or corrective price action.
• This indicator is not a standalone trading system and should be used in combination
with trend analysis, volume, and support/resistance levels.
Alerts
• Bullish sequence at 9
• Bullish sequence at 13
• Bearish sequence at 9
• Bearish sequence at 13
Disclaimer
This "4-Bar Sequential Counter (9–13)" (Seq4) indicator is provided for informational and educational purposes only. It does not, and should not be construed as, financial, investment, or trading advice.
This indicator is an independent implementation of a sequential counting method and is not affiliated with, or endorsed by any trademarked trading concepts or methodologies.
The signals generated by this tool (Green and Red) are the result of a specific set of algorithmic conditions. They are not a direct recommendation to buy or sell any asset.
All trading and investing in financial markets involves a substantial risk of loss. You can lose all of your invested capital.
Past performance does not guarantee future results.
This indicator highlights sequential price exhaustion patterns and may generate false, lagging, or incomplete signals. Markets can remain unpredictable longer than you can remain solvent.
The creator DotGain assumes no liability for any financial losses or damages you may incur, directly or indirectly, as a result of using this indicator or the information it provides.
You are solely responsible for your own trading and investment decisions. Always conduct your own research (DYOR), validate signals with other methods, and consider your personal risk tolerance before entering any trade.
Indikator

Indikator

Indikator
The Institutional Anchor (Daily OC Zone)The Institutional Anchor (Daily OC)
This indicator is a high-performance tool for traders who rely on "Institutional Candles" or "Opening Candles" (OC) to define their daily bias. Built on the latest Pine Script® v6 engine, it provides a stable, non-repainting foundation for identifying key institutional support and resistance levels.
Core Features & Technical Edge
1. Dual-Mode Zone Definition
Traders have different ways of defining institutional strength. This script supports both methods to suit your specific strategy:
Body-Only Mode: Focuses on the "Real Move" by using the Open and Close of the anchor candle.
Full Range Mode (Wicks): Accounts for total liquidity grabs and volatility by including the High and Low.
2. Precision Equilibrium (Mean Threshold)
In institutional trading, the 50% level of a candle is the "Fair Value" or Mean Threshold.
Includes a customizable Midline with independent styling (Solid, Dashed, Dotted).
Automatically calculates the exact mathematical center, helping you spot high-probability rejections at the "Equilibrium" of the move.
3. Professional Visualization Suite
Global Timezone Alignment: A built-in UTC Offset ensures you can align with New York (UTC-5), London (UTC+0), or your specific exchange time without manual calculations.
Auto-Naming System: Automatically labels zones with the Day of the Week (e.g., "Monday OC") to help you track weekly cycles and "Power of 3" (Accumulation/Manipulation/Distribution).
Historical Memory: Choose to show only the current day's active zone for a clean workspace, or display historical zones to find "nested" levels from previous days.
4. Dynamic Price Action Alerts
Stay notified without being glued to the screen. The script includes pre-configured, logically consistent alert conditions:
Equilibrium Touch: Triggers the moment price interacts with the 50% Mean Threshold.
Boundary Breach: Notifies you when price exits or taps the upper or lower edges of the zone.
5. Universal Market Compatibility
BTC & Crypto Optimized: Handles 24/7 data streams flawlessly without logic gaps.
Forex Precision: Perfect for London Open or Midnight Open strategies on pairs like EUR/USD.
Non-Repainting: Once the anchor hour closes, the zone is locked, providing a reliable reference point for the rest of the trading day.
How to Use
Market Open Hour: Enter the hour (24h format) of your chosen anchor candle (e.g., 2 for 2:00 AM).
UTC Offset: Match the offset to your preferred trading session time.
Customize Style: Adjust colors, transparency, and line styles to match your chart theme. Indikator

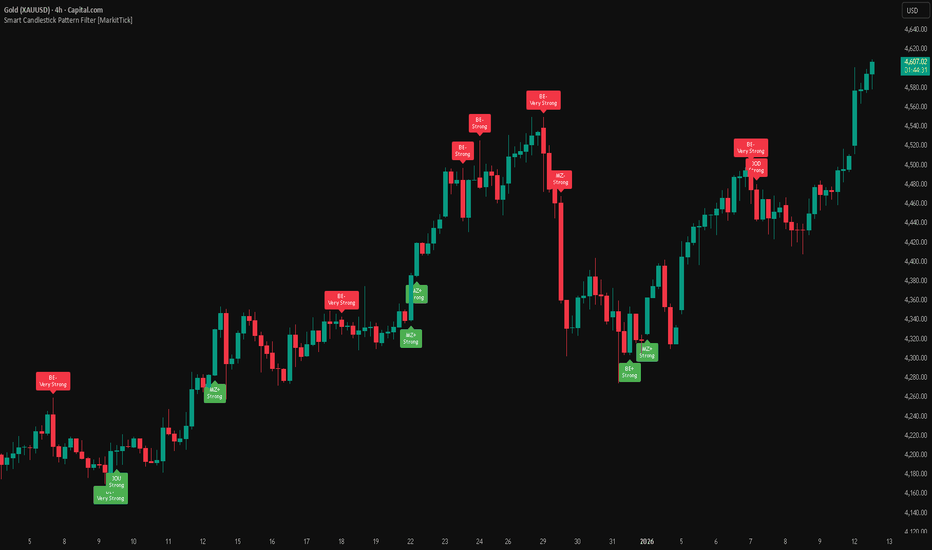
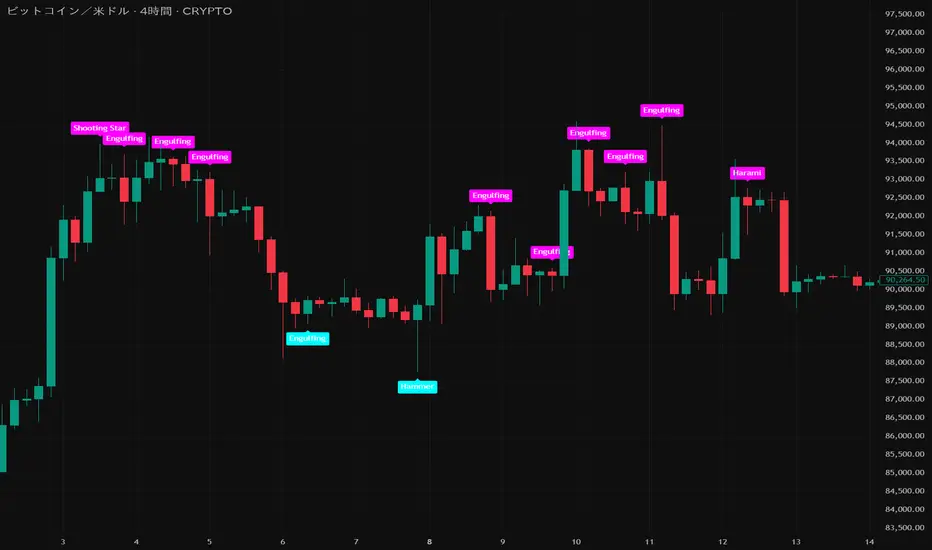
Smart Candlestick Pattern Filter [MarkitTick]💡 This Script is a sophisticated technical analysis tool designed to identify, grade, and display over 40 distinct candlestick formations based on a proprietary strength and context filtering system. Unlike standard pattern finders that often clutter charts with conflicting signals, this script utilizes a hierarchy logic to display only the most significant pattern detected on any given candle, ensuring chart clarity and actionable data.
● Originality and Utility
The primary utility of this script lies in its filtering engine. Standard indicators often flag every minor Doji or Spinning Top, creating noise. This indicator categorizes patterns into five distinct levels of strength, ranging from simple indecision to very strong reversal or continuation signals.
Furthermore, it incorporates a Trend Context filter, which checks the relationship between price and a Simple Moving Average (SMA). This ensures that reversal patterns (like Hammers) are prioritized during downtrends, while continuation patterns are highlighted during established moves, reducing false positives.
● Methodology
The indicator evaluates price action using specific ratios between the Open, High, Low, and Close, alongside the body size relative to the total range. It assigns a strength score to each detected pattern.
• Pattern Strength Grading
Strength 1 (Indecision): Includes patterns like Doji, Spinning Tops, Dragonfly, and Gravestone Dojis. These signal a pause in momentum.
Strength 2 (Weak): Includes patterns like Hanging Man, Inverted Hammer, Belt Holds, and In-Neck lines. These suggest potential movement but often require confirmation.
Strength 3 (Moderate): Includes classic reversals like Hammers, Shooting Stars, Haramis, Dark Cloud Cover, and Piercing Lines.
Strength 4 (Strong): Includes major signals like Engulfing patterns, Morning/Evening Stars, and Marubozu candles.
Strength 5 (Very Strong): Reserved for rare, high-probability multi-candle formations like Three White Soldiers, Three Black Crows, Rising/Falling Three Methods, and Breakaway gaps.
The script calculates all potential patterns for the current bar and then compares their strength scores. Only the pattern with the highest strength is displayed. If the Show Trend Context option is enabled, the script further validates the pattern against the current market direction (determined by the SMA and slope) before plotting.
● How to Use
Traders can use this tool to identify potential entry and exit points based on the strength of the signal.
• Visual Signals
Patterns are labeled directly on the chart:
Green Labels/Text: Indicate Bullish patterns.
Red Labels/Text: Indicate Bearish patterns.
Gray/White Labels: Indicate Indecision or Weak patterns.
Hovering over any label provides the full name of the pattern and its strength rating (e.g., "Bullish Engulfing - Strength: Strong").
• Trading Logic
High Strength Signals (Levels 4-5): These can be used as primary triggers for trend reversals or strong continuations.
Moderate Signals (Level 3): Useful for adding confluence to existing analysis or anticipating a setup.
Indecision (Level 1): Often useful for taking profits or tightening stop-losses, as they indicate the current trend may be stalling.
● Settings
Show Only Strong Patterns: When enabled, filters out Strength 1, 2, and 3, showing only the most significant signals (Strength >= 4).
Max Patterns to Display: Limits the number of historical labels to prevent chart clutter.
Max Candles to Check Engulfing: Adjusts how far back the script looks to validate the size of an engulfing candle.
Trend Detection Period: Sets the length of the SMA used to determine the background trend context.
Show Only Trend-Appropriate Patterns: If checked, bullish reversals are only shown in downtrends, and bearish reversals in uptrends.
● Disclaimer
All provided scripts and indicators are strictly for educational exploration and must not be interpreted as financial advice or a recommendation to execute trades. I expressly disclaim all liability for any financial losses or damages that may result, directly or indirectly, from the reliance on or application of these tools. Market participation carries inherent risk where past performance never guarantees future returns, leaving all investment decisions and due diligence solely at your own discretion. Indikator