Pattern Atlas: Candlestick Indicator [AxeAlgo]Pattern Atlas: Candlestick Indicator
Companion indicator to Pattern Atlas : Candlestick (Library #1 of the AxeAlgo Pattern Atlas)
WHAT THIS INDICATOR IS
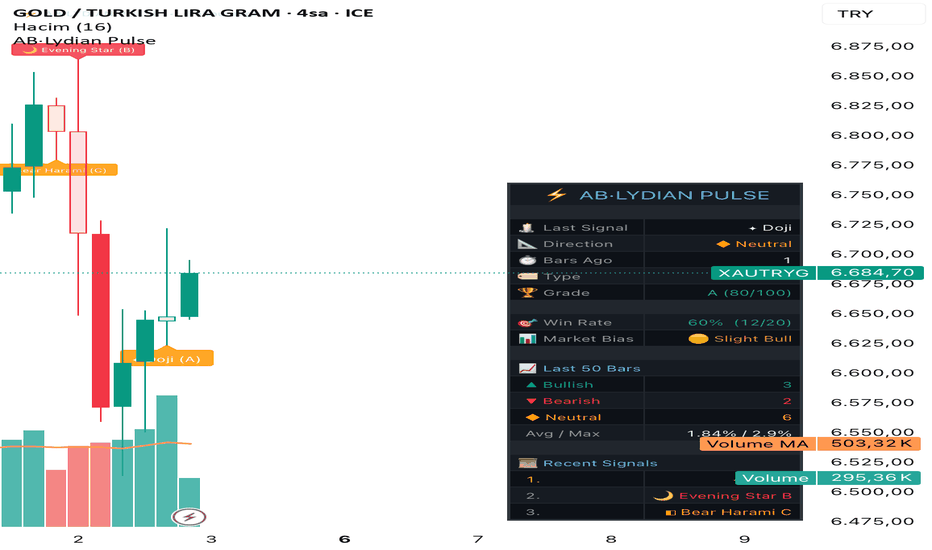
This is a complete candlestick pattern scanner built on top of the Pattern Atlas : Candlestick library — 23 classical candlestick patterns, detected on every bar and turned into on-chart highlighting, a live scanner table, and alerts. It doesn't implement any pattern math itself; every detection is delegated to the library's detect*() functions, so what you see here is exactly what that library finds, with nothing added or reinterpreted.
Candlestick reading is one of the oldest tools in technical analysis, tracing back to Steve Nison's work bringing Japanese candlestick charting to Western traders. The 23 patterns here follow that standard catalog (cross-checked against TA-Lib's CDL* function list), so anyone who already knows what a Morning Star or a Bullish Engulfing bar looks like will recognize exactly what's being flagged.
THE 23 PATTERNS IT SCANS
Single-bar patterns (9): Doji, Long-Legged Doji, Dragonfly Doji, Gravestone Doji, Hammer / Hanging Man, Inverted Hammer / Shooting Star, Marubozu, Spinning Top, Belt Hold.
Two-bar patterns (6): Engulfing, Harami, Harami Cross, Piercing Line / Dark Cloud Cover, Tweezer Top / Bottom, Kicker.
Three-bar-and-longer patterns (8): Morning / Evening Star, Morning / Evening Doji Star, Three Soldiers / Crows, Three Inside Up / Down, Three Outside Up / Down, Abandoned Baby, Rising / Falling Three Methods (the one pattern spanning 5 bars), Stick Sandwich.
READING THE CHART
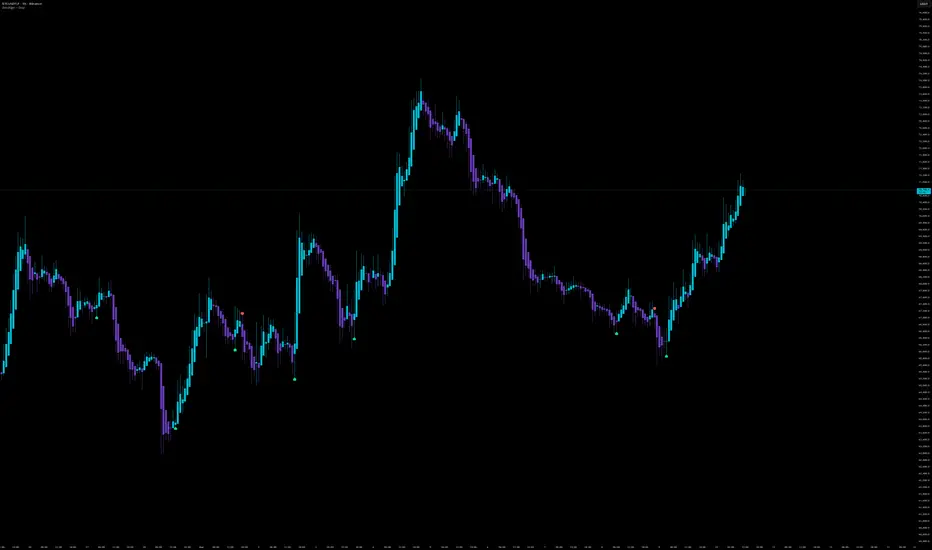
Each matched pattern gets a box drawn around the exact bars it spans, colored gold for bullish, pale gold-white for bearish, and bright gold for neutral (indecision) patterns — colors are user-configurable. On top of that, a "pin" marker appears at the bar: bullish pins hang below the bar, bearish pins sit above it, and neutral patterns get a plain floating gem with no stem, since indecision doesn't have a direction to anchor to. Hovering any pin or gem shows the full description of everything that matched on that bar, including a measured strength percentage for each one — not just the pattern name repeated back at you.
Strength is a generic, direction-based read on how decisively the bar closed within its own high-low range (near the high for a bullish match, near the low for a bearish one, or a small body relative to the range for a neutral one) — a rough, pattern-agnostic proxy, not a bespoke ratio breakdown per pattern, since that level of internal detail isn't something the library exposes.
THE SCANNER TABLE
A table lists all 23 patterns grouped by category, with a live status column showing each one's current match percentage (or a dash when nothing's matching on the current bar). Position, text size, and whether it's shown at all are all configurable. This table is intentionally live — it reflects the forming bar in real time rather than waiting for the bar to close, since it's meant as a "what's happening right now" readout rather than a persisted signal.
FILTERS AND SETTINGS
Every pattern has its own on/off checkbox, and each of the three categories (Single-Bar, Two-Bar, Three-Bar+) has a master switch above its checkboxes to turn the whole group off in one click.
Three additional filters are available, all off by default so the scanner stays an unbiased detector unless you opt in:
- Volume confirmation — requires a match to occur on at least a chosen multiple of its own trailing average volume before it counts.
- Trend context — requires bullish matches to occur against a downtrend and bearish matches against an uptrend (the classical reading that a reversal candle means more against the trend it's reversing than in the middle of a random chop). Neutral patterns are never filtered by this, since they don't imply a direction.
- Minimum strength — hides matches below a chosen strength percentage.
These filters affect what's drawn on the chart and what feeds the pin/gem tooltips. They do not affect the scanner table, which always shows the library's raw, unfiltered read of the current bar, and they do not affect the per-pattern alerts described below, which fire independently of the visual display settings.
ALERTS
Every pattern has its own alert condition available in TradingView's Create Alert dialog, plus three combined conditions (any bullish pattern, any bearish pattern, any neutral pattern), plus one dynamic alert with a full message listing every pattern that matched, grouped by direction, with each one's measured description and strength.
A NOTE ON REPAINTING
Every box, pin, gem, and alert is gated on the bar actually having closed — nothing here fires or gets drawn off a still-forming bar, regardless of your alert-frequency setting in TradingView's dialog. The one exception is the scanner table, which is deliberately live so it can answer "what's happening on this bar right now" — that's a readout, not a persisted signal, and it's expected to change as the current bar develops.
PART OF A LARGER SERIES
This indicator is the companion to Library #1 of the AxeAlgo Pattern Atlas — a planned set of Pine libraries splitting pattern detection by the method actually used to find each kind of pattern: candlestick shape (this one), classical chart/geometric patterns (Library #2), harmonic Fibonacci-ratio patterns (Library #3), and market-structure concepts (order blocks, liquidity, Wyckoff-style events). Each library has, or will have, its own companion scanner indicator built the same way this one is.
DISCLAIMER
This indicator is a technical analysis tool for identifying classical candlestick shapes in historical and live price data. It does not predict future price movement, and a detected pattern — including its measured strength — is a description of past price action, not a signal guaranteed to repeat. Nothing in this script constitutes financial advice. Always combine pattern recognition with your own risk management and broader analysis before making any trading decision.
Indikator

Indikator

Indikator

Candlestick PatternsTitle: Candlestick Patterns
Description:
Detects and labels 15 classic Japanese candlestick patterns in real time, with a multi-timeframe trend filter that highlights which signals align with the prevailing trend direction.
Patterns detected
Single-candle patterns: Doji, Hammer, Hanging Man, Inverted Hammer, Shooting Star.
Two-candle patterns: Bullish Engulfing, Bearish Engulfing, Bullish Harami, Bearish Harami, Piercing Line, Dark Cloud Cover.
Three-candle patterns: Morning Star, Evening Star, Three White Soldiers, Three Black Crows.
Pattern logic
Candle anatomy is computed from body, upper wick, lower wick, and full range on each bar. The wick-to-body ratio threshold is configurable — default 2.0x means the shadow must be at least twice the body size for hammer and shooting star shapes. The Doji threshold is expressed as body size as a percentage of the full range, defaulting to 10%.
Engulfing patterns require the current candle to fully contain the prior candle's body. Harami requires the current body to fit inside the prior range and be less than 60% of the prior body size. Piercing Line requires the close to cross above the midpoint of the prior bearish candle; Dark Cloud Cover requires the close to cross below the midpoint of the prior bullish candle.
Morning and Evening Star use a three-bar setup: a strong directional candle, followed by a small-body indecision candle (body less than 30% of its range), followed by a confirmation candle that closes past the midpoint of the first candle.
Three White Soldiers and Three Black Crows require three consecutive same-direction closes, each higher/lower than the last, with the opens gapping slightly into the prior body.
Trend filter
An EMA crossover (default 20/50) determines trend direction on the current timeframe and three configurable higher timeframes via request.security(). With-trend signals are displayed at full opacity; counter-trend signals are shown at reduced opacity. An optional filter hides counter-trend patterns entirely.
MTF Trend Panel
A compact table in the bottom-right corner shows the current trend direction (▲ Bull / ▼ Bear) across the current timeframe plus the three configured higher timeframes, with the EMA pair displayed as a label. Each cell is color-coded green or red.
Display
Each detected pattern places a label above (bearish) or below (bullish) the candle with the pattern name. A subtle background color fill highlights the bar. Both label colors and background highlights are independently configurable.
Works on any instrument and timeframe. Indikator

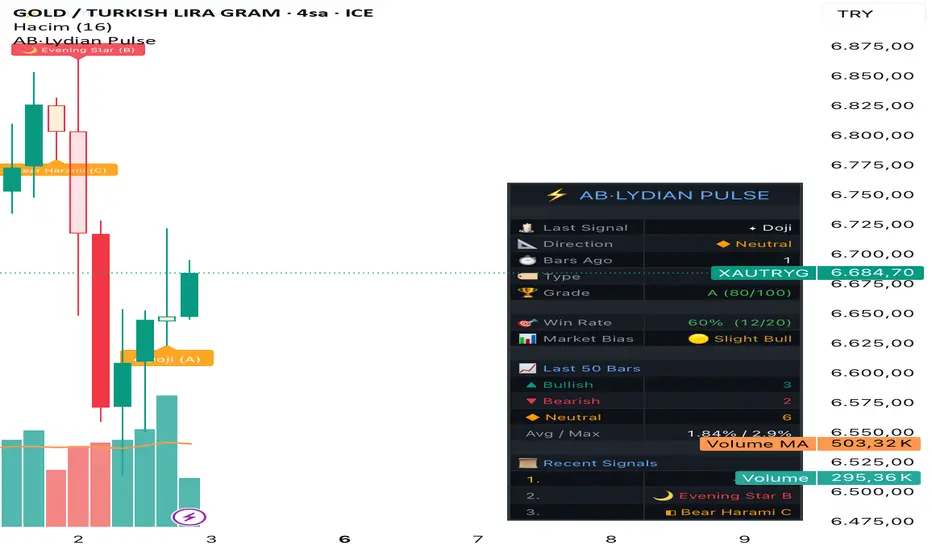
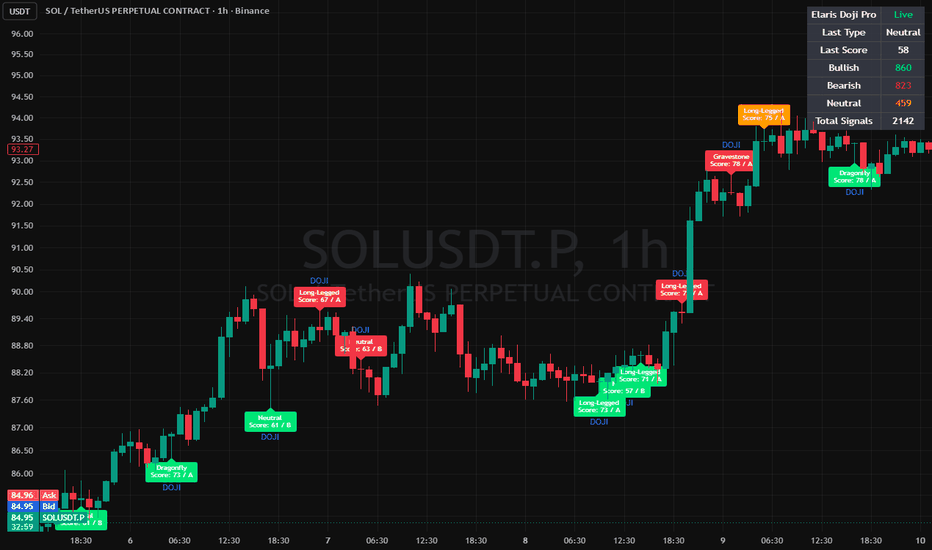
Elaris Doji Finder ProElaris Doji Finder Pro is a professional-grade candlestick analysis indicator designed to detect high-quality Doji formations with advanced context filtering, signal scoring, and clean visual confirmations.
Unlike basic Doji detectors that simply highlight small candle bodies, this indicator evaluates market structure, volatility, wick behavior, trend context, and optional volume confirmation to help traders identify stronger indecision and potential reversal zones.
The indicator supports multiple Doji types including Neutral Doji, Long-Legged Doji, Dragonfly Doji, and Gravestone Doji while providing a premium TradingView experience with customizable visuals, signal quality scoring, smart dashboards, and non-repainting confirmed signals.
━━━━━━━━━━━━━━━━━━
FEATURES
━━━━━━━━━━━━━━━━━━
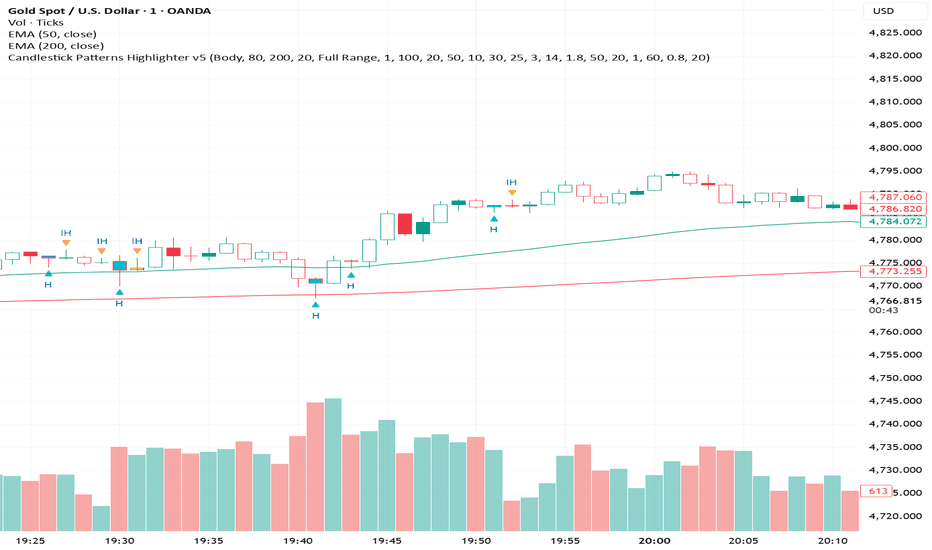
• Detects multiple Doji candle types
• Advanced candle body and wick analysis
• ATR-based volatility filtering
• EMA trend context filtering
• Volume confirmation system
• Swing support & resistance proximity filter
• Bullish / bearish contextual bias detection
• Signal quality scoring engine
• Professional dashboard interface
• Dark mode and light mode support
• Clean labels and compact signal markers
• Fully customizable settings
• Optimized for crypto, forex, indices, and stocks
• Non-repainting candle-close confirmation mode
• Built-in alert conditions
━━━━━━━━━━━━━━━━━━
SUPPORTED DOJI TYPES
━━━━━━━━━━━━━━━━━━
• Neutral Doji
Classic indecision candle with a very small body.
• Long-Legged Doji
High-volatility indecision candle with extended upper and lower wicks.
• Dragonfly Doji
Bullish rejection-style Doji often appearing near local lows or support zones.
• Gravestone Doji
Bearish rejection-style Doji often appearing near local highs or resistance zones.
━━━━━━━━━━━━━━━━━━
HOW TO USE
━━━━━━━━━━━━━━━━━━
Bullish Doji signals may become more effective when:
• Appearing near support
• Forming after strong sell pressure
• Confirmed by rising volume
• Appearing against an extended downtrend
Bearish Doji signals may become more effective when:
• Appearing near resistance
• Forming after strong buying pressure
• Confirmed by elevated volume
• Appearing after aggressive trend extensions
The signal quality score can help filter weaker setups and focus on higher-probability Doji structures.
━━━━━━━━━━━━━━━━━━
NON-REPAINTING
━━━━━━━━━━━━━━━━━━
This indicator can operate in non-repainting mode when “Confirm Signals On Candle Close” is enabled. Signals are confirmed only after candle close.
━━━━━━━━━━━━━━━━━━
DISCLAIMER
━━━━━━━━━━━━━━━━━━
This indicator is designed for educational and analytical purposes only. Always use proper risk management and combine candlestick signals with broader market context before making trading decisions.
Indikator
Indikator
Indikator

Indikator
Doji Volume Map (Zeiierman)█ Overview
Doji Volume Map (Zeiierman) is a volume reaction scanner that detects doji-like candles appearing with relatively high and rising volume, then converts those events into projected price levels. When a valid signal forms, the script places a bubble on the candle, extends a horizontal reaction level forward, and optionally merges nearby levels into a highlighted zone box. The result is a clean map of potential reaction areas built from high-interest doji events rather than generic swing highs or lows.
⚪ What It Detects
The script searches for candles that combine 3 conditions at the same time:
Relative high volume: Current volume must exceed the average volume by a user-defined multiplier.
Rising volume: Current volume must be greater than the previous bar’s volume.
Loose doji structure: The candle body must remain small relative to the total range, while the full range must still be meaningful enough relative to ATR.
When those conditions align, the candle is treated as a significant reaction point and plotted as a bubble. From there, the script projects the price level forward and can combine overlapping levels into broader zones.
█ How It Works
For each bar inside the Lookback Length, the script checks whether the candle qualifies as a valid signal.
It measures:
Average volume over the selected Volume Average Length
Relative volume strength using the Relative Volume Multiplier
Whether volume is increasing vs the previous bar
Whether the candle body is small enough to be considered doji-like
Whether the total range is large enough relative to ATR
█ How to Use
When a doji-like candle forms with high and rising volume, it signals strong participation but no clear directional control.
This means:
Heavy trading occurred.
Both sides were active.
Price failed to move decisively.
These areas often become key reaction zones, as the market tends to revisit and respond to where significant transactions took place.
⚪ In Trend
In uptrends , signals on pullbacks can act as support/continuation zones
In downtrends, signals on bounces can act as resistance/rejection zones
Focus on using levels in the direction of the trend, where the dominant side is likely to defend.
⚪ In Ranges
Signals near range lows → potential buy/support zones
Signals near range highs → potential sell/resistance zones
Merged zones are especially useful for identifying rotation areas within the range.
⚪ Key Idea
High volume + indecision = high-interest price area
These zones often lead to:
Reactions
Rejections
Or continuation after confirmation
Use retests and price behavior at these levels to guide entries.
█ Settings
Lookback Length — how many bars back the script scans for qualifying signals.
Volume Average Length — baseline used to measure relative volume.
Relative Volume Multiplier — minimum volume expansion required vs average.
Max Body % of Range — defines how small the candle body must be to count as doji-like.
Min Candle Range as ATR Fraction — filters out candles that are too small to matter.
Key effect:
Higher Relative Volume Multiplier = fewer but stronger signals
Lower Max Body % of Range = stricter doji selection
Higher Min Candle Range as ATR Fraction = fewer weak micro-signals
Merge Close Levels Into Box — combines nearby projected levels into a single zone.
Merge Distance (ATR) — controls how close levels must be to merge.
-----------------
Disclaimer
The content provided in my scripts, indicators, ideas, algorithms, and systems is for educational and informational purposes only. It does not constitute financial advice, investment recommendations, or a solicitation to buy or sell any financial instruments. I will not accept liability for any loss or damage, including without limitation any loss of profit, which may arise directly or indirectly from the use of or reliance on such information.
All investments involve risk, and the past performance of a security, industry, sector, market, financial product, trading strategy, backtest, or individual's trading does not guarantee future results or returns. Investors are fully responsible for any investment decisions they make. Such decisions should be based solely on an evaluation of their financial circumstances, investment objectives, risk tolerance, and liquidity needs.
Indikator

Candle DNA Strand█ CANDLE DNA STRAND
A unique lower-panel indicator that visualizes candle structure as a stylized double-helix pattern. One strand represents body dominance (open-close range) while the other represents wick proportion (shadow-to-body ratio). The strands twist around a center axis with color encoding for bullish/bearish bias, revealing candle character patterns over time in an intuitive DNA-inspired format.
█ CONCEPT
Traditional candlestick analysis focuses on individual candle patterns. The Candle DNA Strand takes a different approach by decomposing every candle into two core metrics and plotting them as intertwined waves:
• Body Strand — Measures how much of each candle is "body" (the filled portion between open and close). High body ratios indicate conviction and directional commitment.
• Wick Strand — Measures how much of each candle is "shadow" (upper and lower wicks combined). High wick ratios indicate rejection, indecision, or failed attempts at direction.
These two strands are phase-offset by 180° to create the classic double-helix DNA appearance. As you scroll through the chart, you can visually identify periods of conviction (body-dominant) versus indecision (wick-dominant), and how candle character evolves over time.
█ HOW IT WORKS
The indicator calculates two normalized ratios for each candle:
Body Ratio = |Close - Open| / (High - Low)
Wick Ratio = (Upper Wick + Lower Wick) / (High - Low)
These ratios are smoothed and then modulated onto sine waves that twist around a center axis at the 50 level. The amplitude of each strand reflects the strength of that metric — larger bodies push the body strand further from center, and larger wicks push the wick strand further out.
The strands are color-coded by the current candle's bias:
• Bullish candles (close ≥ open) → Neon green tones
• Bearish candles (close < open) → Neon red tones
█ TRADE ZONES
The indicator includes an optional Trade Zone detection system based on candle character analysis:
◉ LONG ZONE (Green Background)
Triggers when:
• Average body ratio exceeds the Body Dominance Threshold (default 65%)
• Bullish momentum score > 40% (more bulls than bears in lookback period)
• Average wick ratio below the Wick Rejection Threshold (default 55%)
This identifies periods where price is moving up with conviction — strong bullish bodies with minimal rejection wicks.
◉ SHORT ZONE (Red Background)
Triggers when:
• Average body ratio exceeds the Body Dominance Threshold
• Bearish momentum score > 40% (more bears than bulls in lookback period)
• Average wick ratio below the Wick Rejection Threshold
This identifies periods where price is moving down with conviction — strong bearish bodies with minimal rejection wicks.
◉ CHOP/INDECISION
When the average wick ratio exceeds 60%, the market is showing high rejection and indecision. The DNA strands will show wick dominance during these periods.
Triangle markers appear at zone entry points:
• ▲ Green triangle below the helix = Long zone entry
• ▼ Red triangle above the helix = Short zone entry
█ VISUAL ELEMENTS
DNA Strands
Two intertwined lines representing body and wick ratios, twisting around the center axis with a configurable wavelength.
Base Pair Connectors
Vertical lines connecting the two strands at regular intervals, mimicking the "rungs" of a DNA ladder. These help visualize the spread between body and wick metrics.
Nucleotide Nodes
Small circular markers along each strand showing individual data points.
Fill Zone
Subtle gradient fill between the strands for visual depth. The fill color matches whichever strand is currently on top.
Info Label
Displays current values at the right edge of the chart:
• Current bias (BULL/BEAR)
• Body and Wick percentages
• Active trade zone (if any)
█ PATTERN DETECTION
The indicator automatically detects significant candle patterns based on DNA metrics:
DOJI — Body ratio < 15%
Very small body relative to total range. Indicates indecision.
MARUBOZU — Body ratio > 85%
Almost no wicks. Strong conviction candle with price closing near the high (bullish) or low (bearish).
HAMMER — Wick ratio > 60% with lower wick > 2× upper wick
Long lower shadow showing rejection of lower prices.
SHOOTING STAR — Wick ratio > 60% with upper wick > 2× lower wick
Long upper shadow showing rejection of higher prices.
█ SETTINGS
DNA Helix Settings
• Helix Wavelength — Number of bars for one complete DNA twist cycle (default: 20)
• Helix Amplitude — Vertical spread of the strands from center (default: 35)
• Show Base Pair Connectors — Toggle the connecting rungs (default: On)
• Connector Frequency — Draw a connector every N bars (default: 2)
• Data Smoothing — SMA length for smoothing ratios (default: 3)
• Strand Thickness — Line width for the DNA strands (default: 2)
Trade Zone Settings
• Show Trade Zones — Toggle background highlighting and entry signals (default: On)
• Zone Lookback — Bars to analyze for zone detection (default: 5)
• Body Dominance Threshold — Minimum avg body ratio for zone trigger (default: 0.65)
• Wick Rejection Threshold — Maximum avg wick ratio for zone trigger (default: 0.55)
Fluorescent Colors
• Bullish colors — Neon green and electric green variants
• Bearish colors — Neon red and hot pink variants
• Axis, connector, and zone colors are all customizable
Visual Settings
• Show Nucleotide Nodes — Toggle the small circles on strands (default: On)
• Show Info Labels — Toggle the right-side information label (default: On)
• Show DNA Analysis Table — Toggle detailed analysis table (default: Off)
█ ALERTS
Four alert conditions are available:
1. Long Zone Entry
"Entered LONG zone - strong bullish momentum with conviction candles"
2. Short Zone Entry
"Entered SHORT zone - strong bearish momentum with conviction candles"
3. Doji Pattern
"Doji detected - indecision"
4. Marubozu Pattern
"Marubozu detected - strong conviction"
█ INTERPRETATION GUIDE
Reading the DNA:
When body strand dominates (further from center):
• Market is moving with conviction
• Candles have strong bodies, minimal wicks
• Trend is likely to continue
When wick strand dominates (further from center):
• Market is showing rejection/indecision
• Candles have long shadows relative to bodies
• Potential reversal or consolidation
Strand crossovers:
• When strands cross, character is shifting
• Body crossing above wick → increasing conviction
• Wick crossing above body → increasing indecision
Color consistency:
• Long stretches of green → sustained bullish pressure
• Long stretches of red → sustained bearish pressure
• Alternating colors → choppy, mixed market
█ BEST PRACTICES
1. Use with price context — The DNA strand shows candle character, not direction. Combine with price action on the main chart.
2. Adjust wavelength to timeframe — Shorter wavelengths (10-15) for scalping, longer wavelengths (25-40) for swing trading.
3. Trade zones are filters, not signals — Use zone entries as confirmation for your existing strategy, not as standalone signals.
4. Watch for character shifts — When the dominant strand changes, market behavior is changing. This often precedes reversals.
5. Multiple timeframe analysis — Check DNA character on higher timeframes to understand the broader context.
█ CREDITS
Developed by Hash Capital Research
Pine Script™ v6
This indicator is provided for educational and informational purposes. Always conduct your own analysis and manage risk appropriately. Indikator

ZenAlgo - DojiOverview
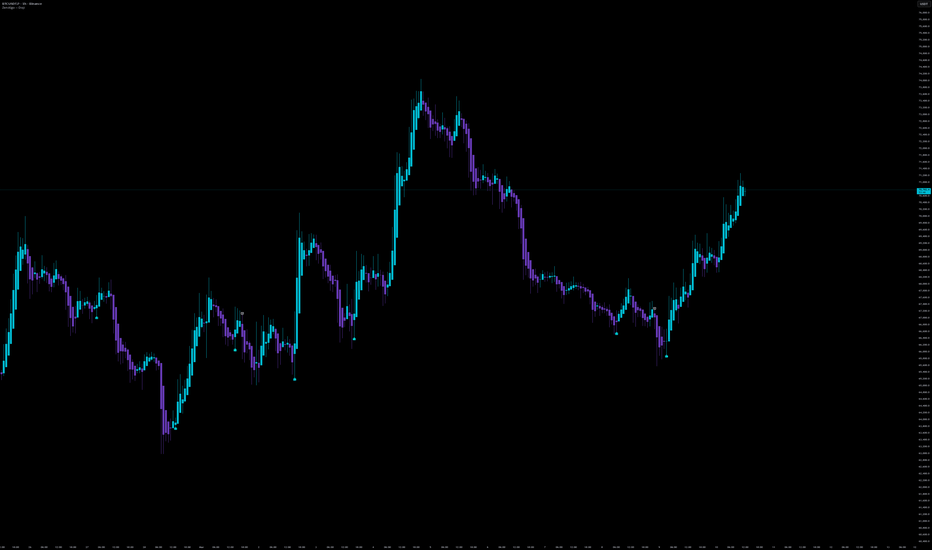
This indicator identifies Doji candles and adds two contextual filters before creating an alert: a relative volume expansion filter and a normalized directional-shift filter. Most Doji indicators simply detect candle shape. This script instead adds contextual conditions so that alerts appear only when the Doji occurs together with increased participation and a change in short-term directional pressure.
Doji candles appear frequently on their own, so the script focuses on situations where candle balance, elevated activity, and a directional shift occur at the same time.
How the indicator works
The script begins by evaluating candle structure. It measures the full candle range, the size of the body, and the size of the upper and lower wicks relative to the entire candle. A candle is considered a Doji when the body occupies only a small portion of the range.
After identifying the base Doji structure, the candle is classified into one of several common Doji types depending on the relative size of the wicks:
Dragonfly Doji – very small upper wick and long lower wick.
Gravestone Doji – very small lower wick and long upper wick.
Long-legged Doji – both wicks are relatively long.
Standard Doji – small body without the extreme wick proportions of the other types.
A Doji indicates that price moved during the bar but finished close to the opening level, suggesting temporary balance between buyers and sellers.
Volume context (PVSRA-style comparison)
After the candle structure is detected, the script evaluates trading activity.
Current volume is compared with the average volume over a recent lookback window. If current volume exceeds that average by a configurable multiple, the candle is considered to occur during elevated participation.
This step is important because a Doji formed during low activity may simply reflect quiet trading, while a Doji formed during higher participation means more trading occurred but the candle still closed near equilibrium.
Normalized price-change proxy
The script then evaluates short-term directional behavior.
It measures the percentage change between consecutive closing prices. This series is smoothed to reduce noise and then normalized relative to recent behavior. The normalization allows the script to determine whether the current directional movement is unusually positive or negative compared with recent activity.
The script compares this normalized value with the previous bar. An alert requires the value to change sign between the two bars, which indicates that the short-term directional pressure has flipped.
Why the components are combined
Each component describes a different aspect of market behavior:
The Doji describes temporary balance inside a candle.
The volume comparison measures whether that balance occurred during elevated participation.
The directional flip indicates a shift in short-term pressure.
Basic Doji markers highlight every small-body candle. This indicator is more selective because it only highlights cases where equilibrium, participation, and directional change appear together.
Final alert logic
An alert is created when the following conditions occur simultaneously:
A Doji is present on the current candle or the previous candle.
Volume exceeds the recent average by the configured multiple when the volume filter is enabled.
The normalized directional reading flips sign between two consecutive bars.
Alerts are separated into bullish and bearish categories according to the direction of the normalized reading after the flip.
How to interpret the alerts
A bullish alert means the script detected a Doji context with elevated volume and a positive directional flip.
A bearish alert means the same conditions occurred with a negative directional flip.
The alert marks a moment where price equilibrium, increased participation, and directional change appeared together. These conditions may appear near short-term transitions, pauses, or local turning points.
How to use the indicator
This indicator is intended as a contextual chart tool rather than a standalone trading system.
Use alerts to locate Doji candles confirmed by participation and directional change.
Interpret bullish alerts as possible upward transitions and bearish alerts as possible downward transitions.
Evaluate the alert location relative to support, resistance, or recent trend structure.
Combine the alerts with other analysis tools or higher timeframe context.
Why Heikin Ashi often works well
The script can be used on any chart type, but Doji detection often becomes clearer on Heikin Ashi candles.
Heikin Ashi candles smooth short-term price fluctuations by averaging values from multiple bars. Because the indicator relies on candle body and wick proportions, this smoothing reduces small random Doji created by short-term noise and produces clearer candle structures.
Limitations
Doji candles occur frequently and do not inherently indicate reversals.
Volume filters depend on the quality and meaning of the exchange’s volume data.
The directional proxy is based on price changes rather than direct order flow.
Different markets, timeframes, and preset settings can change how often alerts appear.
The indicator highlights situations where candle equilibrium, elevated participation, and directional change appear together, but it does not determine future price direction. Indikator
cephxs + fadi / HTF PSPHTF PSP - PRECISION SWING POINTS
Detect divergence-based Precision Swing Points (PSPs) across multiple higher timeframes with automatic correlated asset detection.
WHAT'S NEW (vs Original HTF Candles)
This indicator builds on @fadizeidan's excellent ICT HTF Candles foundation with significant new functionality, depending on who you ask of course:
✨ PSP Divergence Detection: Automatically identifies Precision Swing Points where price diverges from correlated assets—the original has no divergence analysis
✨ Auto Asset Correlation: Uses AssetCorrelationUtils library to detect and pair correlated assets (ES↔NQ↔DXY, BTC↔ETH, Gold↔Silver, etc.)—no manual setup required
✨ Multi-Asset Comparison: Tracks up to 3 correlated assets simultaneously with divergence relationships between all pairs
✨ Dynamic Asset Reordering: When you switch charts, the indicator automatically reorders assets so your chart is always primary
✨ Inverse Correlation Support: Properly handles inversely correlated assets like DXY (bullish DXY = bearish signal for risk assets)
✨ HTF Sweep Detection: New sweep line feature highlights when HTF candles take out previous highs/lows and close back inside. One of my followers asked me for this, there you go anon.
🔧 Streamlined to 3 HTFs: Focused design with 3 HTF slots (vs 6) for cleaner charts and better performance
The original remains excellent for pure HTF candle visualization. This version adds institutional flow analysis through divergence detection.
WHAT IT DOES
This indicator displays Higher Timeframe (HTF) candles to the right of your chart and highlights Precision Swing Points—pivots where price diverges from correlated assets. When ES makes a new high but NQ doesn't follow, or gold pushes higher while DXY fails to confirm, you're looking at institutional repositioning.
PSPs mark these moments on your HTF candles, giving you a clean visual signal for potential reversals.
HOW IT WORKS
Divergence Detection
The indicator compares price action between your chart and up to two correlated assets. A divergence occurs when one asset makes a directional move (bullish/bearish candle) while a correlated asset moves the opposite direction.
Three divergence relationships are tracked:
Primary vs Secondary (e.g., ES vs NQ)
Primary vs Tertiary (e.g., ES vs DXY)
Secondary vs Tertiary (e.g., NQ vs DXY)
PSP Confirmation
A candle is marked as a PSP when:
A divergence exists between correlated assets
A swing pivot forms (high > previous high AND high > next high, or vice versa for lows)
This dual confirmation filters noise and highlights only meaningful institutional activity.
Automatic Asset Detection
In Auto mode, the indicator uses the AssetCorrelationUtils library to detect your chart's asset class and automatically select the most relevant correlated pairs:
Indices: ES ↔ NQ ↔ DXY, YM ↔ ES ↔ NQ
Forex: EURUSD ↔ DXY ↔ GBPUSD, USDJPY ↔ DXY ↔ US10Y
Crypto: BTC ↔ ETH ↔ DXY
Metals: Gold ↔ Silver ↔ DXY
Energy: CL (Oil) ↔ NG ↔ DXY
HTF Sweep Detection
Sweeps are detected when an HTF candle (C2) takes out the high or low of the previous candle (C1) and then closes back inside. This marks liquidity grabs on the higher timeframe.
HOW TO USE
Enable HTF timeframes: Select 1-3 higher timeframes relevant to your trading style (e.g., 30m, 90m, 4H for intraday traders)
Watch for PSP candles: When a candle body color changes to the divergence color, a PSP has formed
Note the direction: Bullish divergence (your asset bullish while correlated asset bearish) suggests upside; bearish divergence suggests downside
Combine with LTF structure: Use PSPs as bias, then look for entry on lower timeframes (CHoCH, FVG, etc.)
Sweeps confirm liquidity: A sweep followed by a PSP is a strong reversal signal
INPUTS
HTF Selection
HTF 1/2/3: Enable/disable each HTF slot with timeframe and candle count
Custom Daily Open: Use Midnight, 8:30, or 9:30 ET as daily candle open
Styling
Body/Border/Wick Colors: Customize bullish and bearish candle appearance
Padding/Buffer/HTF Buffer: Control spacing between candles and timeframe groups
Labels
HTF Label: Show timeframe name above/below candles
Remaining Time: Countdown to candle close
Label Position: Top, Bottom, or Both
Label Alignment: Align across timeframes or follow individual candles
Interval Value: Show interval details on candles
Imbalance
Fair Value Gap: Highlight FVGs on HTF candles
Volume Imbalance: Highlight VIs on HTF candles
HTF Sweeps: Show sweep lines when C2 takes out C1's high/low
Trace
Trace Lines: Draw lines from HTF candle OHLC levels back to chart price
Anchor: Anchor to first or last timeframe
PSP Divergence Detection
Precise Mode: Only highlight pivots on current asset (stricter confirmation)
Divergence Body Colors: Custom colors for bullish/bearish divergence candles
Asset Selection
Correlation Preset: Auto (library-detected) or Manual
Manual Assets 1/2/3: Specify custom correlated assets
Invert Asset 3: Flip the bullish/bearish interpretation for inverse correlations (e.g., DXY)
KEY FEATURES
Multi-HTF Display: Up to 3 higher timeframes displayed simultaneously
Auto Asset Detection: Automatically finds relevant correlated assets for your chart
Dynamic Reordering: When you switch charts, assets reorder so the chart is always primary
Inverse Correlation Support: Properly handles DXY and other inversely correlated assets
HTF Sweep Detection: Highlights liquidity grabs on higher timeframes
FVG/VI Detection: Fair Value Gaps and Volume Imbalances on HTF candles
Remaining Time Counter: Know exactly when the next HTF candle closes
BEST PRACTICES
Use PSPs as directional bias, not direct entries—wait for LTF confirmation
A PSP at a key level (previous day high, weekly open) carries more weight
Multiple PSPs across different HTFs pointing the same direction = stronger signal
Sweeps that fail to hold (sweep + PSP) often mark significant reversals
In Auto mode, trust the library's asset selection—it's been tuned for common correlations
DISCLAIMER
This indicator is for educational purposes only and does not constitute financial advice. Divergences and PSPs do not guarantee reversals—always use proper risk management and confirm signals with your own analysis. Past performance does not guarantee future results.
CREDITS
Original HTF candle plotting concept by @fadizeidan. PSP divergence detection and asset correlation logic by cephxs & fstarcapital. Uses the AssetCorrelationUtils library by fstarcapital.
Open Sourced For all.
Enjoy.
Made with ❤️ by cephxs + fadi Indikator

Michael LipsiusTitle: Michael Multi-Timeframe Trend Dashboard (HTF Bias & LTF Execution)
Description:
Overview This indicator is a specialized Top-Down Analysis tool designed to assist traders in identifying the dominant market direction across multiple timeframes instantly. Built around the principles of Michael's Trading Strategy and institutional trend following, this dashboard eliminates the noise and provides a clear, color-coded directional bias (Prognosis) for both High Time Frame (HTF) structure and Low Time Frame (LTF) momentum.
Core Functionality The dashboard generates a real-time matrix displayed directly on the chart, analyzing price action relative to the 50-period Exponential Moving Average (EMA). This specific metric is chosen to filter out minor fluctuations and reveal the true institutional flow of money.
1. High Time Frame (HTF) Prognosis – The "Compass" The indicator monitors the Daily (D1) and 4-Hour (H4) timeframes to establish the macro trend.
Bullish 🟢: Price is holding above the 50 EMA. This indicates that Smart Money is accumulating, and traders should focus primarily on Long setups.
Bearish 🔴: Price is trading below the 50 EMA. This suggests institutional distribution, meaning Short setups have a higher probability of success.
Purpose: The HTF modules act as your safety filter. By respecting the D1/H4 signals, you avoid trading against the major trend, significantly reducing the risk of being stopped out by macro flows.
2. Low Time Frame (LTF) Execution – The "Trigger" Simultaneously, the indicator analyzes the 1-Hour (H1) and 15-Minute (M15) timeframes.
These timeframes are crucial for timing entries and managing intraday volatility.
Conflict Warning: If the HTF is Bullish (Green) but the LTF is Bearish (Red), the market is likely in a pullback phase. This warns the trader to wait for the LTF to realign with the HTF before entering.
How to Use This Tool This dashboard is designed to be the first step in your trading routine:
Check Confluence: Look for a "Full Green" or "Full Red" board. When D1, H4, and H1 align, the probability of a successful trade increases exponentially.
Identify Pullbacks: If D1/H4 are Green, but M15 is Red, do not sell. Instead, treat this as a discount phase and wait for the M15 to flip back to Green for a high-precision entry.
Risk Management: Use the HTF bias to determine your risk exposure. Trade with full risk only when HTF and LTF are aligned.
Settings & Customization
Table Position: Fully adjustable (Top Right, Bottom Right, etc.) to fit your workspace.
EMA Period: Default is set to 50 (Standard Michael Strategy), but can be adjusted to fit other strategies.
Visuals: Clean, non-intrusive design with clear color coding for instant readability.
Disclaimer This tool is for informational purposes only and serves as a trend-confirmation aid. It should be used in conjunction with price action analysis, key levels, and proper risk management. Indikator

Indikator

Twisted Forex's Doji + Area StrategyTitle
Twisted Forex’s Doji + Area Strategy
Description
What this strategy does
This strategy looks for doji candles forming inside or near supply/demand areas . Areas are built from swing pivots and sized with ATR, then tracked for retests (“confirmations”). When a doji prints close to an area and quality checks pass, the strategy places a trade with the stop beyond the doji and a configurable R:R target.
How areas (zones) are built
• Swings are detected with a user-set pivot length.
• Each swing spawns a horizontal area centered at the pivot price with half-height = zoneHalfATR × ATR .
• Duplicates are de-duplicated by center distance (ATR-scaled).
• Areas fade when broken beyond a buffer or after an optional age (expiry).
• Retests are recorded when price touches and then bounces away from the area; repeated reactions increase the zone’s “strength”.
Signal logic (summary)
Doji detection: strict or loose body criteria with optional minimum wick fractions and ATR-scaled minimum range.
Proximity: price must be inside/near a supply or demand area (proxATR × ATR).
Side resolution: overlap is resolved by (a) which side price penetrates more, (b) fast/slow EMA trend, or (c) nearest distance. Optional “previous candle flip” can bias long after a bearish candle and short after a bullish one.
Optional 1-bar confirmation: the bar after the doji must close away from the area by confirmATR × ATR .
Quality filter (Off/Soft/Strict): four checks—(i) wick rejection past the edge, (ii) doji closes in an edge “band” of the area, (iii) fresh touch (cooldown), (iv) approach impulse over a short lookback. In Strict , thresholds auto-tighten.
Orders & exits
• Long: stop below doji low minus buffer; Short: above doji high plus buffer.
• Target = rrMultiple × risk distance .
• Pyramiding is off by default.
Position sizing
You can size from the script or from Strategy Properties:
• Script-driven (default): set Position sizing = “Risk % of equity” and choose riskPercent (e.g., 1.0%). The script applies safe floors/rounding (FX micro-lots by default) so quantity never rounds to zero.
• Properties-driven : toggle Use TV Properties → Order size ON, then pick “Percent of equity” in Properties (e.g., 1%). The header includes safe defaults so trades still place.
Key inputs to explore
• Zone building : pivotLen, zoneHalfATR, minDepartureATR, expiryBars, breakATR, leftBars, dedupeATR.
• Doji & proximity : strictDoji, dojiBodyFrac, minWickFrac, minRangeATR, proxATR, minBarsBetween.
• Overlap resolution : usePenetration, useTrend (EMA 21/55), “previous candle flip”, needNextBarConf & confirmATR.
• Quality : qualityMode (Off/Soft/Strict), minQualPass/kStrict, wickPenATR, edgeBandFrac, approachLookback, approachMinATR, freshTouchBars.
• Zone strength gating : minStrengthSoft / minStrengthStrict.
• HTF confluence (optional) : useHTFTrend (HTF EMA 34/89) and/or useHTFZoneProx (HTF swing bands).
Tips to make it cleaner / higher quality
• Turn needNextBarConf ON and use confirmATR = 0.10–0.15 .
• Increase approachMinATR (e.g., 0.35–0.45) to require a stronger pre-touch impulse.
• Raise minStrengthSoft/Strict (e.g., 4–6) so only well-reacted zones can signal.
• Use signalsOnlyConfirmed ON if you prefer trades only from zones with retests (the script falls back gracefully when none exist yet).
• Nudge proxATR to 0.5–0.6 to demand tighter proximity to the level.
• Optional: enable useHTFTrend to filter counter-trend setups.
Default settings used in this publication
• Initial capital: 100,000 (illustrative).
• Slippage: 1 tick; Commission: 0% (you can raise commission if you prefer—spread is partly modeled by slippage).
• Sizing: Risk % of equity via inputs; riskPercent = 1.0% ; FX uses micro-lot floors by default.
• Quality: Off by default (Soft/Strict available).
• HTF trend gate: Off by default.
Backtesting notes
For a meaningful sample size, test on liquid symbols/timeframes that yield 100+ trades (e.g., majors on 5–15m over 1–2 years). Backtests are modelled and broker costs/spread vary—validate on your feed and forward-test.
How to read the chart
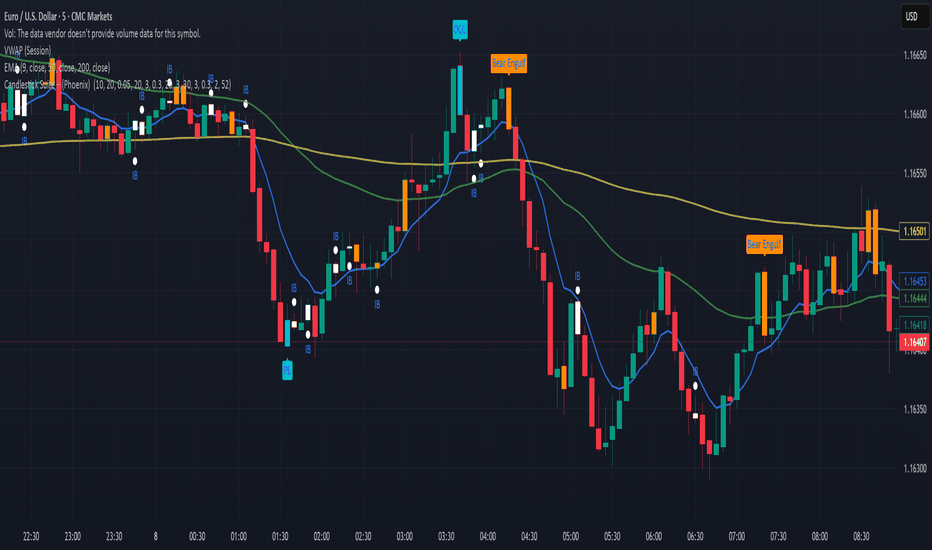
Shaded bands are supply (above) and demand (below). Brighter bands are the nearest K per side (visual aid). BUY/SELL labels mark entries; colored dots show entry/SL/TP levels. You can hide zones or unconfirmed zones for a cleaner view.
Disclaimer
This is educational material, not financial advice. Trading involves risk. Always test and size responsibly. Strategi

Indikator
Indikator

Indikator

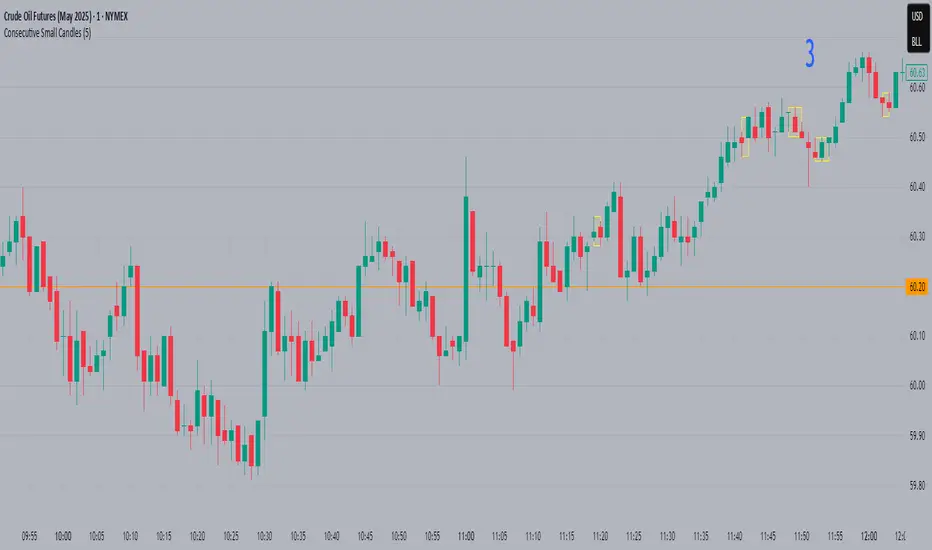
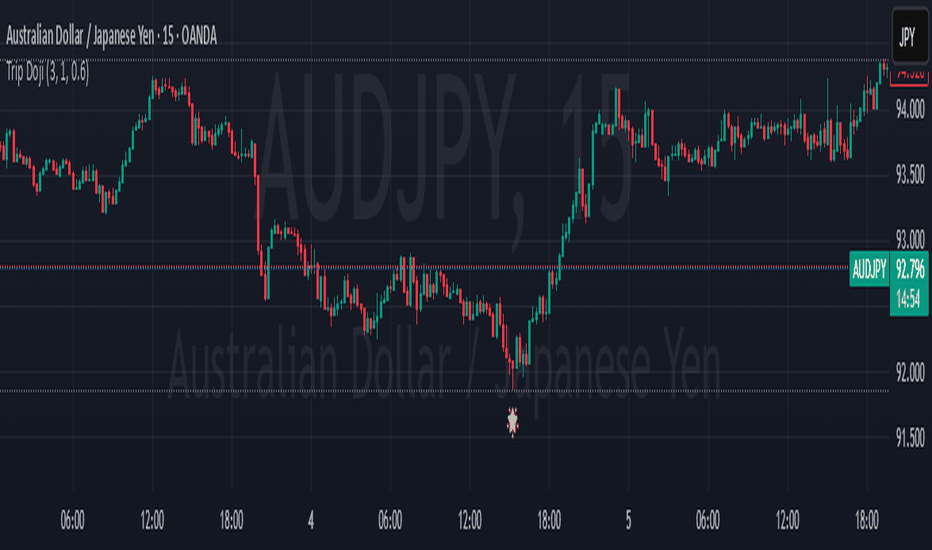
Triple Doji SequenceThe Triple Doji Sequence indicator helps traders identify consecutive Doji candlestick patterns, allowing them to choose between spotting single, double, or triple Dojis. A Doji is detected when the candle's body is small relative to its wicks, with either the upper or lower wick being significantly larger. Users can customize their own Doji criteria by adjusting the body size and wick dominance settings. The indicator ensures that consecutive Dojis align in the same direction before confirming a valid pattern, making it easier to identify market indecision or potential trend reversals.
When the chosen Doji sequence is detected, the indicator plots a star (*) above bearish Dojis (upper wick dominant) and below bullish Dojis (lower wick dominant). It also sends alerts when a valid sequence is confirmed at the close of the bar. This tool helps traders refine their strategy by spotting repeated Doji formations, which may indicate key turning points or continuation patterns in price action.
How to Use the Triple Doji Sequence Indicator?
Apply the Indicator:
Add the Triple Doji Sequence indicator to your TradingView chart.
It will automatically scan for Doji patterns based on your settings.
Customize Your Doji Criteria:
Adjust the body size and wick dominance settings to define what qualifies as a Doji.
Choose whether to detect single, double, or triple Doji sequences.
Interpret the Signals:
A star (*) above a candle signals a bearish Doji (upper wick dominant).
A star (*) below a candle signals a bullish Doji (lower wick dominant).
Set Up Alerts:
Enable alerts to receive notifications when a Doji sequence is confirmed at bar close.
Choose alert frequency based on your trading strategy (e.g., once per bar, once per bar close).
Use in Trading Strategy:
Doji sequences can indicate trend reversals or market indecision.
Combine this indicator with support/resistance levels, volume, or other indicators to confirm signals.
PS: Good luck in finding a Triple Doji :) Indikator
Indikator

Price Action StrategyThe **Price Action Strategy** is a tool designed to capture potential market reversals by utilizing classic reversal candlestick patterns such as Hammer, Shooting Star, Doji, and Pin Bar near dinamic support and resistance levels.
***Note to moderators
- The moving average was removed from the strategy because it was not suitable for the strategy and not participating in the entry or exit criteria.
- The moving average length has been replaced/renamed by the support/resistance lenght.
- The bullish engulfing and bearish engulfing patterns were also removed because in practice they were not working as entry criteria, since the candle price invariably closes far from the support/resistance level even considering the sensitivity range. There was no change in the backtest results after removing these patterns.
### Key Elements of the Strategy
1. Support and Resistance Levels
- Support and resistance are pivotal price levels where the asset has previously struggled to move lower (support) or higher (resistance). These levels act as psychological barriers where buying interest (at support) or selling interest (at resistance) often increases, potentially causing price reversals.
- In this strategy, support is calculated as the lowest low and resistance as the highest high over a 16-period length. When the price nears these levels, it indicates possible zones for a reversal, and the strategy looks for specific candlestick patterns to confirm an entry.
2. Candlestick Patterns
- This strategy uses classic reversal patterns, including:
- **Hammer**: Indicates a buy signal, suggesting rejection of lower prices.
- **Shooting Star**: Suggests a sell signal, showing rejection of higher prices.
- **Doji**: Reflects indecision and potential reversal.
- **Pin Bar**: Represents price rejection with a long shadow, often signaling a reversal.
By combining these reversal patterns with the proximity to dinamic support or resistance levels, the strategy aims to capture potential reversal movements.
3. Sensitivity Level
- The sensitivity parameter adjusts the acceptable range (Default 0.018 = 1.8%) around support and resistance levels within which reversal patterns can trigger trades (i.e. the closing price of the candle must occur within the specified range defined by the sensitivity parameter). A higher sensitivity value expands this range, potentially leading to less accurate signals, as it may allow for more false positives.
4. Entry Criteria
- **Buy (Long)**: A Hammer, Doji, or Pin Bar pattern near support.
- **Sell (Short)**: A Shooting Star, Doji, or Pin Bar near resistance.
5. Exit criteria
- Take profit = 9.5%
- Stop loss = 16%
6. No Repainting
- The Price Action Strategy is not subject to repainting.
7. Position Sizing by Equity and risk management
- This strategy has a default configuration to operate with 35% of the equity. The stop loss is set to 16% from the entry price. This way, the strategy is putting at risk about 16% of 35% of equity, that is, around 5.6% of equity for each trade. The percentage of equity and stop loss can be adjusted by the user according to their risk management.
8. Backtest results
- This strategy was subjected to deep backtest and operations in replay mode on **1000000MOGUSDT.P**, with the inclusion of transaction fees at 0.12% and slipagge of 5 ticks, and the past results have shown consistent profitability. Past results are no guarantee of future results. The strategy's backtest results may even be due to overfitting with past data.
9. Chart Visualization
- Support and resistance levels are displayed as green (support) and red (resistance) lines.
- Only the candlestick pattern that generated the entry signal to triger the trade is identified and labeled on the chart. During the operation, the occurrence of new Doji, Pin Bar, Hammer and Shooting Star patterns will not be demonstrated on the chart, since the exit criteria are based on percentage take profit and stop loss.
Doji:
Pin Bar and Doji
Shooting Star and Doji
Hammer
10. Default settings
Chart timeframe: 20 min
Moving average lenght: 16
Sensitivity: 0.018
Stop loss (%): 16
Take Profit (%): 9.5
BYBIT:1000000MOGUSDT.P Strategi

Indikator

Indikator