Indikator

Indikator
Indikator
Indikator

Tick Velocity [DYNA]Tick Velocity measures the speed of price movement on every bar, normalized by ATR and log-compressed so the reading works consistently across any instrument and any timeframe. Instead of asking "did price go up or down?" it asks "how fast did price move?" -- and that distinction makes all the difference when you need to spot momentum bursts and exhaustion in real time.
Most momentum tools tell you the direction of a move but not its intensity relative to normal conditions. A 50-point move on a major index means something very different during a quiet afternoon versus an opening-bell surge. Tick Velocity strips away that ambiguity by expressing every bar's price change as a multiple of recent volatility with log compression, giving you a clean, comparable speed reading that doesn't get crushed by outlier spikes.
Key Features
ATR-Normalized Velocity -- price change divided by ATR, so readings are comparable across instruments and timeframes without manual adjustment
Log-Compressed Scale -- extreme spikes are tamed so the histogram uses its full visual range, making normal-range momentum readable even after outlier moves
Signal Line -- a smoothed EMA overlay shows sustained momentum direction, filtering out bar-to-bar noise
Dynamic Spike Detection -- automatically identifies bars where velocity exceeds a configurable multiple of its recent average, with separate bullish and bearish alerts
Smart Exhaustion Detection -- flags fading momentum only after periods of genuine activity, so you don't get false exhaustion signals during quiet consolidation
Confirmed-Bar Logic -- all signals are evaluated on the completed bar, so what you see on the chart stays on the chart with no repainting
Clean Visual Design -- color-coded histogram with dynamic threshold lines and signal line makes it easy to read momentum state at a glance
How It Works
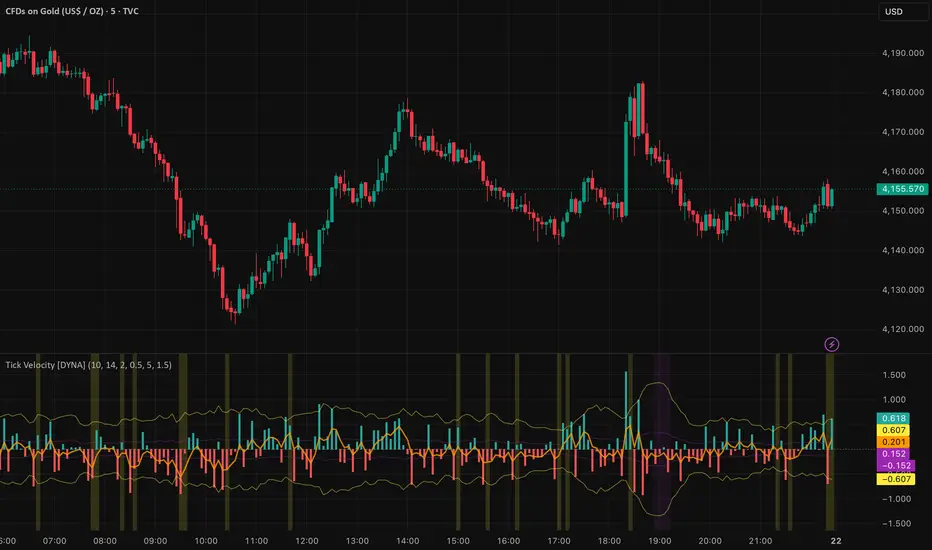
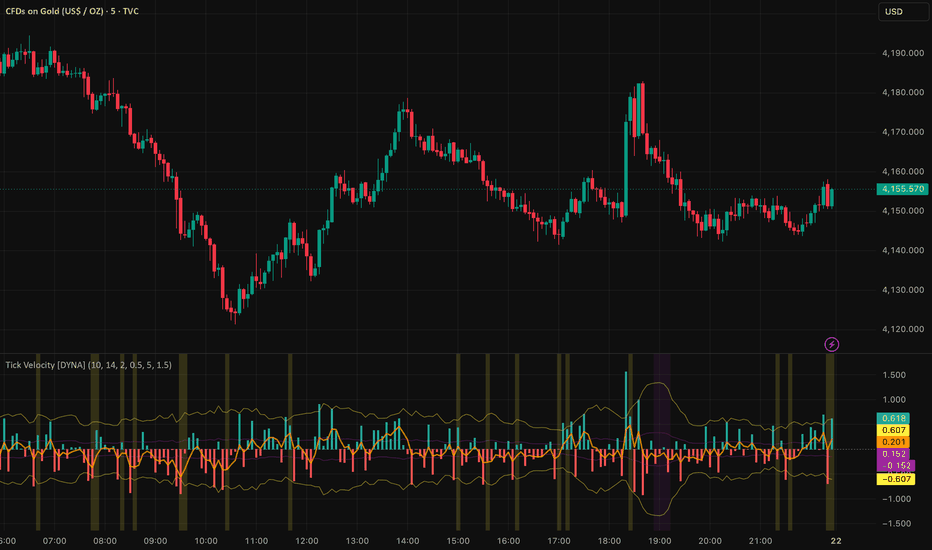
When you add Tick Velocity to your chart, a histogram appears in a separate pane below price. Each bar in the histogram represents the speed of that candle's price change: green bars mean price moved up, red bars mean price moved down, and the height of each bar shows how fast the move was. Log compression keeps the scale readable -- a massive gap-up spike won't flatten everything else into an invisible line.
An orange signal line (EMA) overlays the histogram, smoothing out bar-to-bar noise to show you the sustained momentum direction. When the signal line holds above zero, bulls are in control; when it dips below, bears are driving.
Two sets of threshold lines frame the histogram. The outer yellow lines mark the spike threshold -- when a bar pushes beyond these lines, price moved significantly faster than normal, indicating a momentum burst. The inner purple lines mark the exhaustion threshold -- when bars shrink inside these lines after a period of elevated activity, momentum is fading and the market may be pausing or preparing to reverse. The smart exhaustion gate ensures purple zones only appear after real momentum -- not during quiet consolidation.
Background shading reinforces these conditions. A yellow tint appears on confirmed spike bars, and a purple tint appears on confirmed exhaustion bars, making it easy to scan through the chart and see where momentum surged or faded.
Tick Velocity histogram showing bullish and bearish velocity bars, with spike threshold lines (yellow) and exhaustion bands (purple). Background highlights mark confirmed spike and exhaustion events.
Settings
The core settings control sensitivity. The Velocity Lookback (default 10) determines how many bars are used to calculate the average velocity -- lower values make the indicator more responsive for scalping, higher values smooth it out for swing trading. The ATR Period (default 14) controls the normalization window. The Signal Smoothing (default 5) sets the EMA period for the orange signal line.
The Spike Multiplier (default 2.0) sets how far above average a bar must travel to count as a spike. Raise it to 2.5 or 3.0 if you only want the strongest bursts. The Exhaustion Multiplier (default 0.5) sets how far below average velocity must drop to flag exhaustion. The Exhaustion Gate Multiplier (default 1.5) ensures exhaustion only triggers when recent activity exceeds the longer-term baseline by this factor -- preventing false signals during quiet consolidation. Threshold lines, background highlights, and the signal line can each be toggled independently under Visual settings.
Alerts
Bullish Velocity Spike -- fires when upward velocity exceeds the spike threshold on a confirmed bar. Message: "Bullish velocity spike -- strong upward momentum burst."
Bearish Velocity Spike -- fires when downward velocity exceeds the spike threshold on a confirmed bar. Message: "Bearish velocity spike -- strong downward momentum burst."
Velocity Exhaustion -- fires when velocity drops below the exhaustion threshold after a period of elevated activity. Message: "Tick Velocity exhaustion detected -- momentum fading after active period, possible pause or reversal."
To set up alerts: click the TradingView Alerts button, select "Tick Velocity " from the indicator dropdown, choose "Any alert() function call" as the condition, and set your preferred notification method.
Best Practices
Use velocity spikes at key support and resistance levels to confirm breakouts -- a spike adds conviction that the level break is real
Watch for exhaustion signals after extended trends to time profit-taking or tighten stop-loss placement
Combine with volume indicators for added confirmation -- a velocity spike on high volume is more meaningful than one on thin volume
Adjust the lookback period to match your trading style: 5-7 for scalping, 10-15 for intraday, 20+ for swing trading
On lower timeframes (1-3 minute), consider raising the spike multiplier to reduce noise from normal market fluctuations
Part of the DYNA Ecosystem
Tick Velocity is a free indicator built with the same design standards as the DYNA premium suite. For complete trade management with automatic stop loss, break-even, trailing stops, and multi-target systems, explore the full DYNA indicator collection.
Disclaimer
This indicator is a technical analysis and educational tool only -- it is not financial advice and makes no guarantee of any outcome. Past performance does not predict future results. Always do your own research and use proper position sizing and risk management.
Created by Varun Nidhi · varunnidhi.com
A free DYNA indicator — self-contained, no repainting.
Indikator
Range Box Scalper [DYNA]Range Box Scalper detects when price compresses into a tight consolidation zone and visually draws a box around it in real time. When price breaks out of the box with above-average volume, the indicator marks the exact breakout bar with a directional arrow, so you can act on the expansion move without second-guessing the setup.
Most traders know that consolidation leads to expansion, but spotting the range in real time and confirming the breakout with volume is tedious manual work. Range Box Scalper automates the entire process: it watches for price to stay within an ATR-defined corridor for a minimum number of bars, draws the consolidation zone as a visible box on the chart, and then waits for a decisive close outside the box backed by strong volume before signaling the breakout.
Key Features
Automatic Range Detection -- Identifies consolidation zones based on ATR-calibrated price width and minimum bar count. No manual drawing required.
Live Box Drawing -- Shaded boxes appear and extend in real time as price continues to range, giving you a clear visual boundary to watch.
Volume-Confirmed Breakouts -- Breakout arrows only appear when volume exceeds a configurable multiple of the 20-bar average, filtering out weak, low-conviction exits.
Breakout Strength Filter -- Requires the breakout candle to close a minimum distance (ATR-based) beyond the range boundary, eliminating marginal breakouts.
Built-in Trend Filter -- Optional EMA-based trend filter ensures breakouts only fire in the direction of the prevailing trend, so you can focus on with-trend setups.
Directional Breakout Arrows -- Green upward triangles for bullish breakouts, red downward triangles for bearish breakouts, placed right at the breakout bar.
No Repainting -- All signals use confirmed-bar logic. Once a box or arrow appears, it stays.
How It Works
As price action unfolds, Range Box Scalper continuously monitors whether recent bars are staying within a narrow corridor. The corridor width is derived from ATR, so it automatically adapts to the volatility of whatever instrument you are trading. When price stays inside this corridor for your configured minimum number of bars, a shaded gray box appears on the chart marking the consolidation zone. You will also see a small orange diamond labeled "Range" on the bar where the consolidation is first confirmed.
The box continues to extend to the right as long as price remains inside the boundaries. The moment price closes decisively outside the box and the breakout bar carries above-average volume, the indicator marks the breakout with a colored arrow: a green triangle below the bar for a bullish breakout, or a red triangle above the bar for a bearish breakout. The box border also changes color to match the breakout direction, giving you a quick historical reference for which zones broke which way.
If price drifts out of the range on weak volume, no breakout signal fires. The indicator simply resets and begins looking for the next consolidation. This volume filter is what separates genuine expansion moves from false exits that quickly reverse.
A consolidation box forming over several bars, followed by a bullish breakout arrow when price closes above the range with strong volume.
Settings
The core settings control how the indicator defines a consolidation zone. Min Range Bars (default: 6) sets how long price must stay compressed before a box is drawn -- lower values on fast timeframes, higher values on daily charts. ATR Multiplier (default: 1.5) controls the maximum allowed range width relative to ATR; lower values mean tighter, more compressed boxes, while higher values detect more consolidation zones. Volume Confirmation (default: 1.2x) sets the volume threshold for breakout signals; increase this if you want only the strongest breakouts.
Min Breakout Strength (default: 0.1x ATR) requires the breakout candle to close at least this distance beyond the range boundary, filtering out marginal breakouts that barely clear the box edge. The Trend Filter (default: off, EMA 50) optionally restricts breakouts to the trend direction -- bullish breakouts only fire above the EMA, bearish breakouts only below. Enable this if you want to filter counter-trend setups.
Visual toggles let you show or hide the consolidation boxes and breakout arrows independently. Each alert type can also be toggled on or off.
Alerts
Consolidation Forming -- Fires when price has ranged for the minimum number of bars and a new consolidation zone is confirmed. "Range Box Scalper: Consolidation zone detected. Price is ranging in a tight range."
Breakout Up -- Fires when price closes above the consolidation box with volume confirmation. "Range Box Scalper: Bullish breakout from consolidation zone with volume confirmation."
Breakout Down -- Fires when price closes below the consolidation box with volume confirmation. "Range Box Scalper: Bearish breakout from consolidation zone with volume confirmation."
To set up alerts: click the TradingView Alerts button, select "Range Box Scalper " from the indicator dropdown, choose "Any alert() function call" as the condition, and set your preferred notification method.
Best Practices
On lower timeframes (1m-5m), reduce Min Range Bars to 5-6 to catch shorter consolidation periods that match the faster price action.
On higher timeframes (4H and above), increase Min Range Bars to 12-15 so only significant consolidation zones are flagged.
Increase the Volume Confirmation multiplier or Min Breakout Strength if you are getting too many signals -- this ensures only the strongest breakouts are marked.
The built-in trend filter (EMA 50) ensures breakouts align with the prevailing trend. Disable it if you want to trade counter-trend setups.
After a breakout, the box boundaries (top and bottom) often act as support or resistance on a retest.
Part of the DYNA Ecosystem
Range Box Scalper is a free indicator built with the same design standards as the DYNA premium suite. For complete trade management with automatic stop loss, break-even, trailing stops, and multi-target systems, explore the full DYNA indicator collection.
Disclaimer
This indicator is a technical analysis and educational tool only -- it is not financial advice and makes no guarantee of any outcome. Past performance does not predict future results. Always do your own research and use proper position sizing and risk management.
Created by Varun Nidhi · varunnidhi.com
A free DYNA indicator — self-contained, no repainting.
Indikator

Momentum Shift Detector [DYNA]Momentum Shift Detector pinpoints the exact bar where short-term momentum changes direction. Instead of showing every EMA crossover, it applies four independent filters to surface only the shifts that matter -- giving you clean, actionable turning-point signals directly on your price chart.
Most EMA crossover tools flood the chart with signals, many of which occur in the middle of a move when the easy money has already been made. Momentum Shift Detector solves this by requiring four conditions to align simultaneously: the cross itself, a minimum EMA spread threshold to eliminate weak whipsaw crosses, a volume surge confirming real participation, and proximity to a recent swing extreme proving that price actually reversed at a meaningful level.
Key Features
Quad-Filter Signal Engine -- Combines EMA crossover, EMA spread threshold, volume confirmation, and pivot proximity into a single high-conviction signal
Anti-Whipsaw EMA Spread Filter -- Requires the fast and slow EMAs to separate by a minimum fraction of ATR before a cross counts, eliminating weak crosses that immediately reverse
Swing Pivot Awareness -- Only fires when the momentum shift occurs near an actual swing high or swing low, filtering out mid-trend noise
Volume Confirmation -- Requires above-average volume on the crossover bar, ensuring real market participation backs the shift
Confirmed-Bar Logic -- Signals are calculated on closed bars so they never repaint or disappear after appearing
Trend-Colored EMA Cloud -- Fast and slow EMAs with a shaded fill that switches between green and red as the trend changes, giving instant directional context
Multi-Layer Visual Feedback -- Labeled triangle markers, bar coloring that fades over 3 bars, and a background flash on the shift bar so you never miss a signal
How It Works
The indicator runs a fast EMA (default period 3) and a slow EMA (default period 8) on every bar. When the fast EMA crosses above the slow EMA, a potential bullish shift is detected. When it crosses below, a potential bearish shift is detected. But the signal does not fire yet.
Next, the EMA spread filter checks whether the gap between the fast and slow EMAs exceeds a minimum fraction of ATR(14). This prevents whipsaw signals where the EMAs barely cross before reversing -- a common problem on lower timeframes with choppy price action.
Then, the volume filter checks whether the crossover bar had trading volume above the user-defined multiplier (default 1.3x) times the 20-bar average volume. This ensures the shift is backed by genuine market activity, not just thin, random price movement.
Finally, the pivot proximity filter checks whether a recent swing low (for bullish shifts) or swing high (for bearish shifts) was detected within a defined number of bars. This is the key differentiator -- it means the momentum flip is happening at a place where price actually turned around, not somewhere in the middle of an existing trend.
When all four conditions align, a green triangle labeled "SHIFT" appears below the bar for a bullish flip, or a red triangle above the bar for a bearish flip. The bars around the signal are tinted to match and a subtle background flash highlights the exact moment of the shift. Meanwhile, the fast and slow EMAs are plotted with a color-coded cloud fill that shows the prevailing trend direction at a glance -- green when momentum is bullish, red when bearish.
Bullish (green) and bearish (red) momentum shift signals on a 1-minute chart. The EMA cloud provides continuous trend context while triangle markers and bar coloring highlight confirmed shifts.
Settings
The core settings control the sensitivity of each filter. The Fast EMA Length (default 3) and Slow EMA Length (default 8) define the crossover speed -- shorter values react faster but may produce more signals. The Min EMA Spread (default 0.1) sets the minimum fast/slow EMA gap as a fraction of ATR(14) -- raise it to 0.2-0.3 on higher timeframes or set to 0 to disable. The Volume Multiplier (default 1.3) sets the minimum volume threshold as a multiple of the 20-bar average; raising it to 1.5 will require even stronger volume confirmation. The Pivot Proximity setting (default 5 bars) controls how close the signal must be to a detected swing pivot. The Volume Average Length (default 20) determines the lookback window for calculating average volume.
Visual toggles let you independently show or hide bullish and bearish shift markers, the EMA lines and cloud fill, bar coloring around shift events, and the background flash highlight. Alert toggles let you enable notifications for each shift type separately.
Alerts
Bullish Momentum Shift -- Fires when a confirmed bullish crossover occurs with volume above threshold near a recent swing low. "Momentum Shift Detector : Bullish momentum shift detected."
Bearish Momentum Shift -- Fires when a confirmed bearish crossover occurs with volume above threshold near a recent swing high. "Momentum Shift Detector : Bearish momentum shift detected."
To set up alerts: click the TradingView Alerts button, select "Momentum Shift Detector " from the indicator dropdown, choose "Any alert() function call" as the condition, and set your preferred notification method.
Best Practices
Use the dots as confirmation alongside your existing support/resistance levels, trendlines, or other indicators rather than as a standalone entry trigger
On higher timeframes (4H, Daily), consider widening the EMAs to 5/13 for smoother signals suited to swing trading
If signals are too frequent for your style, raise the Volume Multiplier above 1.3 or increase the Min EMA Spread to 0.2-0.3 to require stronger confirmation
Pay attention to signals that cluster at the same price zone across multiple timeframes -- these tend to mark the strongest reversals
The pivot proximity filter is the main quality gate; lowering it to 3 allows faster signals while raising it to 7-10 requires more established swing points
Part of the DYNA Ecosystem
Momentum Shift Detector is a free indicator built with the same design standards as the DYNA premium suite. For complete trade management with automatic stop loss, break-even, trailing stops, and multi-target systems, explore the full DYNA indicator collection.
Disclaimer
This indicator is a technical analysis and educational tool only -- it is not financial advice and makes no guarantee of any outcome. Past performance does not predict future results. Always do your own research and use proper position sizing and risk management.
Created by Varun Nidhi · varunnidhi.com
A free DYNA indicator — self-contained, no repainting.
Indikator

Indikator

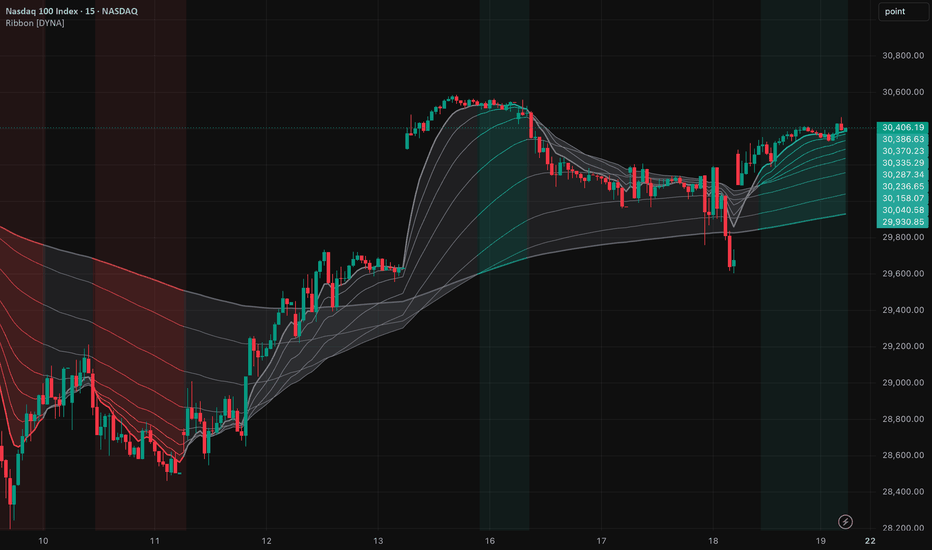
Intraday Trend Ribbon [DYNA]Intraday Trend Ribbon plots eight Fibonacci EMAs (8, 13, 21, 34, 55, 89, 144, 233) as a single coloured ribbon stacked on price. When the EMAs are perfectly fanned -- fastest on top -- the ribbon turns green and the chart background lights up bullish. When they are stacked the other way it turns red. Mixed and compressed? The ribbon goes grey and the indicator flags chop. The result is an at-a-glance read on whether the momentum, swing, and trend timeframes agree.
Most ribbon indicators colour every line with a separate state, leaving you to interpret the soup. This one collapses the eight EMAs into three regimes -- fully bullish, fully bearish, chop -- and wraps the chart background in the matching colour, so trend regimes, transitions, and consolidations are obvious without staring at line crossovers.
Key Features
Eight Fibonacci EMAs -- 8, 13, 21, 34, 55, 89, 144, 233 by default; every period is configurable.
Strict Alignment Detection -- The ribbon registers as bullish or bearish only when all eight EMAs are in strict monotonic order. No half-aligned states, no false trend signals.
Chop Filter -- A built-in compression detector flags windows where the ribbon collapses into a tight band, using ribbon width / ATR as the yardstick. Tunable via a single threshold input.
Background Regime Highlight -- Soft green / red when the ribbon is fully aligned, soft amber when chop is active. Toggleable.
Per-Line Transparency Gradient -- The fastest EMA is opaque; slower EMAs fade gradually so the ribbon reads as a single colour-graded fan rather than eight competing lines.
Three Alerts -- Bullish flip, bearish flip, chop start. All gated on confirmed bar close, no repainting.
No Repainting -- Every alert compares the current confirmed bar's state to the previous bar's state. Historical signals never move.
How It Works
The indicator computes eight EMAs of the configured source (default close) at the eight periods. Each bar it checks two conditions:
Fully bullish = ema8 > ema13 > ema21 > ema34 > ema55 > ema89 > ema144 > ema233
Fully bearish = the mirror
The ribbon colour is set by which (if any) of these holds. For chop, the ribbon's vertical span (max EMA minus min EMA) is divided by the current ATR; if the result is below the configured ceiling AND the ribbon is mixed (neither bullish nor bearish), the bar is marked as chop. ATR scaling makes the chop threshold work the same way across instruments and timeframes.
Edge events fire only on the first confirmed bar of a new state -- the first bar that becomes fully bullish, the first bar that becomes fully bearish, the first bar that enters chop. Comparing each bar's state to the prior bar's state guarantees no repainting.
The eight-EMA Fibonacci ribbon coloured by alignment state. Green fan = fully bullish, red fan = fully bearish, grey = mixed. Background tints amplify the regime; amber background marks chop windows.
Settings
EMA Source (default: close) sets the price feed for every line. The eight period inputs ( EMA 1 through EMA 8 , defaults 8 to 233) define the ribbon; replace them with any other set if you prefer non-Fibonacci spacing.
Detect Chop (default: on) enables the compression detector. Chop ATR Length (default: 14) sets the ATR period, and Chop Width / ATR Ceiling (default: 0.5) controls strictness -- raise toward 1.0 for more frequent chop flags, lower toward 0.3 to flag only the tightest compressions.
Show EMA Lines , Shade Between EMAs , and Background When Aligned are independent visibility toggles. Line Transparency (fastest) (default: 0) controls the opacity of the fastest line; the slower lines fade gradually from there.
The three alert toggles enable / disable the bullish-flip, bearish-flip, and chop-start alerts independently.
Alerts
Ribbon Fully Bullish -- Fires on the first confirmed bar where the ribbon enters a fully bullish stack. "Intraday Trend Ribbon : Ribbon flipped fully bullish -- all 8 EMAs stacked fast over slow."
Ribbon Fully Bearish -- Fires on the first confirmed bar where the ribbon enters a fully bearish stack. "Intraday Trend Ribbon : Ribbon flipped fully bearish -- all 8 EMAs stacked fast under slow."
Ribbon Tangled (Chop) -- Fires on the first confirmed bar where the ribbon becomes compressed and unaligned. "Intraday Trend Ribbon : Ribbon entered chop -- EMAs compressed and unaligned."
To set up alerts: open TradingView's Alerts panel, choose "Intraday Trend Ribbon " from the condition dropdown, pick one of the three alert variants, and select your notification channel.
Best Practices
Trade only with the regime. When the green or red background is active, the ribbon agrees on direction -- this is the highest-edge environment for trend setups. Use counter-trend setups only when there is no background tint.
Treat the slower EMAs (89, 144, 233) as dynamic trailing stops in a clean trend. A close that decisively crosses and stays beyond the 233 EMA usually marks the end of a regime.
Use ribbon-width changes to read momentum. A widening fan = accelerating trend; a contracting fan = trend losing energy.
Skip trades during the amber chop background. The compression flag catches typical midday consolidations and news-pause windows that most trend systems struggle with.
Match the timeframe to your holding period. 1m / 5m flips often, 1h / 4h flips rarely. Pick the one whose flip cadence matches the trades you actually take.
On instruments with very low volatility (post-close FX, holiday sessions), raise the Chop Width / ATR Ceiling so the chop filter does not stay active permanently.
Part of the DYNA Ecosystem
Intraday Trend Ribbon is a free indicator built with the same design standards as the DYNA premium suite. For complete trade management with automatic stop loss, break-even, trailing stops, and multi-target systems, explore the full DYNA indicator collection.
Disclaimer
This indicator is a technical analysis and educational tool only -- it is not financial advice and makes no guarantee of any outcome. Past performance does not predict future results. Always do your own research and use proper position sizing and risk management.
Created by Varun Nidhi · varunnidhi.com
A free DYNA indicator — self-contained, no repainting.
Indikator
Strategi

BocchiTheTrader | Quantum Trend Matrix# BocchiTheTrader | Quantum Trend Matrix
## 🚀 OVERVIEW
In modern electronic markets, retail traders suffer from cognitive overload. Managing multiple charts, fragmented timeframes, and dozens of conflicting indicators often leads to analysis paralysis and execution delays.
The **Quantum Trend Matrix** by **BocchiTheTrader** solves this structural problem. It is an enterprise-grade, localized Heads-Up Display (HUD) that synthesizes a high-fidelity technical matrix directly onto your active trading workspace. By evaluating macro trend direction, multi-oscillator momentum, volume health, and volatility boundaries simultaneously, the QTM provides traders with an instantaneous snapshot of market confluence. It functions as a single, centralized source of truth for directional bias, asset strength, and execution validation.
---
## 📐 THE MATHEMATICAL & LOGICAL CORE
The dashboard works as a multi-indicator consensus engine, evaluating individual variables every single tick to update a structural confluence matrix:
* **Tri-Horizon Trend Architecture:** Evaluates directional health by processing price action relative to an optimized Simple Moving Average (SMA) across three distinct temporal planes: Macro-Weekly, Swing-Daily, and Intraday-Current.
* **Linear & Non-Linear Momentum Ensemble:**
* **MACD Line/Signal Cross:** Decodes classic directional velocity shifts.
* **Relative Strength Index (RSI-14):** Evaluates oversold/overbought thresholds based on a centralized 50-level mid-line axis.
* **Stochastic Oscillator (14, 3):** Measures the location of the close relative to the high-low range to catch rapid cyclical swing turns.
* **Gaussian Normalized Fisher Transform:** Applies an algebraic log transform to normalized RSI values, sharpening the turning points into crisp, highly responsive leading triggers.
* **Money Flow Index (MFI-14):** Combines price action with volume to determine institutional capital absorption or distribution.
* **Volatility & Structural Boundaries:**
* **Bollinger Bands (20, 2.0):** Isolates extreme price extensions. If price pierces the lower band, an exhaustion "Buy" state triggers; if it pierces the upper band, a "Sell" state triggers; otherwise, it remains balanced ("Neutral").
* **Trend Strength & Direction Balance (DMI/ADX):**
* **Directional Movement Index (DMI):** Identifies whether the positive ($+DI$) or negative ($-DI$) trend force is dominant.
* **Average Directional Index (ADX):** Quantifies the absolute strength of the move. Values below 25 trigger a "Weak" warning, while values above 25 confirm a true trending market.
* **Dynamic Exponential Ribbon (EMA 20/50):** Monitors the fast-to-slow exponential moving average cross to confirm immediate mechanical trend acceleration.
---
## 🚦 HOW TO TRADE WITH IT
### 🔹 Long-Side Execution Matrix (Confluence Buying)
1. **Macro Validation:** Ensure that the *Daily Trend* and *Current Trend* cells display **Bullish** (Mint Green).
2. **Momentum Alignment:** Look for a cluster of **Buy** signals across leading indicators (specifically *Fisher*, *MACD*, and *RSI*).
3. **Volatility Confirmation:** Verify that the *ADX* row indicates **Trend** ($>25$). This confirms that the bullish move has institutional momentum backing it.
4. **Entry Trigger:** Execute when the *EMA 20/50* row transitions to **Buy**.
### 🔸 Short-Side Execution Matrix (Confluence Shorting)
1. **Macro Validation:** Ensure that the *Daily Trend* and *Current Trend* cells display **Bearish** (Crimson Red).
2. **Momentum Alignment:** Look for a cluster of **Sell** signals across *MACD*, *Stoch*, *MFI*, and *RSI*.
3. **Volatility Confirmation:** If price breaks down past a structural level and *Bollinger* shifts out of neutral into an extreme state or *DMI* reads **Sell**, the downward expansion is confirmed.
4. **Entry Trigger:** Execute when the *EMA 20/50* transitions to **Sell**.
### 🛡️ Risk Management & Trailing Protocol
* **Invalidation Point:** If an established Long trade is running and more than three momentum cells (e.g., MACD, Stoch, Fisher) flip rapidly from **Buy** to **Sell**, it signals an impending distribution phase. Use this as an early warning indicator to tighten stop-losses or harvest partial profits before visual price rotation occurs.
---
## ⚠️ RISK DISCLAIMER
Financial market trading involves substantial risk of capital loss. Quantum Trend Matrix is engineered exclusively as a statistical and analytical workflow assistant. Past performance configurations do not dictate, guarantee, or imply future algorithmic outcomes. Always utilize strict capital allocation and risk mitigation frameworks. Indikator

Indikator

Indikator

EMA Bot Signals + VPoCEMA Bot Signals + VPoC
A swing-trading toolkit built around a 9/21 EMA crossover, graded by trend slope and volume, with a Volume Point of Control (VPoC) used as a dynamic target. It visualizes a full entry → stop → target lifecycle on the chart, plus candlestick reversals and a higher-timeframe trend filter, so you can see why a setup qualifies — not just that the EMAs crossed.
What it does
- EMA cross signals (9/21): marks bullish crosses, and "anticipate" entries just before a cross when the fast EMA is already turning up inside a tight gap.
- Signal strength: every entry is graded Strong / Moderate / Weak from EMA slope (%/bar) and volume vs. its average, so weak crosses are visibly de-emphasized.
- VPoC: plots the heaviest-volume price level over a configurable lookback. When VPoC sits >=8% above the recent crossover average, it is used as the T1 target (otherwise targets are derived from EMA spread). Optional historical daily-session VPoC lines on intraday charts.
- Trade lifecycle: on a signal it tracks entry, stop, T1, T2, moves the stop to breakeven once T1 is hit, and marks the exit (T2, stop, breakeven-stop, or bear cross).
- Exit context: flags stalling (slope fading + below-average volume), momentum collapse, and T1-recovery (slope turning back up inside the T1 zone).
- Daily-trend filter: while the daily trend is up (daily EMA9 > EMA21 and rising), soft exits are held and the background tints green — hard stop/targets always fire.
- Candlestick reversals: marks Engulfing, Hammer/Shooting Star, Morning/Evening Star, Piercing/Dark Cloud, and Harami (bullish below the bar, bearish above).
- Corner table: live read of alignment, slope, volume ratio, signal strength, VPoC distance, pattern, and daily trend.
How to use it
Add to any symbol/timeframe (designed for swing timeframes like 1h-1D). Use the graded entry triangles with the corner table to filter for Strong/Moderate setups in the direction of the daily trend, and treat the plotted stop/T1/T2 and VPoC as a planning guide. Inputs let you tune EMA lengths, stop %, anticipate %, target lookback, VPoC bars/levels, and which overlays to show.
Notes
Hover any marker for a tooltip with the entry/stop/targets/VPoC/slope/volume detail behind it. Best on liquid markets where volume is meaningful for the VPoC calculation.
This is an analysis and education tool, not financial advice. It does not place orders and past behavior of any signal does not guarantee future results. Always do your own research and manage risk. Indikator

Multiple EMA + SMA (8-in-1, or 4 of each)This combo indicator takes Tradingview's default SMA and EMA Pinescript code and basically duplicates it 8 times. There are 4 EMAs and 4 SMAs, each configurable to their own timeframe, line, color, etc. I did this so I could see several combinations of moving averages on various chart timeframes, such as:
- Daily chart: 200 SMA, 50 SMA, 20 EMA
- 4 hour chart: 200 SMA, 50 EMA, 20 EMA
- 1 hour chart: 50 EMA, 20 EMA, 9 EMA
- 30 minute chart: 50 EMA, 20 EMA, 9 EMA
Moving Averages Are Filters, Not Triggers: The moving average smooths price action to reveal the dominant market current, not to provide buy or sell signals alone. It filters market noise but requires price action confirmation for entry decisions.Therefore it's important to note the **slope** direction of the MA too.
Matching Time Frame and Holding Period: Using a moving average setting built on a timeframe inconsistent with your trade duration (e.g., a short moving average on a multi-month trade) causes frequent whipsaws. The setting must reflect your trade horizon.
Three Roles of Moving Averages on Any Time Frame:
1. **Tide (Slowest Line)** — Indicates the overall market direction and which side to trade.
2. **Trend (Middle Line)** — Represents the active trend you trade around.
3. **Timing (Fastest Line)** — Identifies pullback zones and potential entry points.
Consistency and Discipline are Crucial: The hardest part of trading is not knowing the settings but patiently waiting for alignment of the tide, trend, and timing lines, and resisting impulsive trades.
When to use EMA or SMA: Shorter time frames use EMAs for faster reaction to price changes, whereas longer time frames use SMAs to smooth out noise and emphasize broader trends. The 200-day SMA is particularly important as it is the most widely followed moving average, creating real support/resistance due to collective market attention.
Examples and Practical Application:
- A trader looking for a long trade on the daily chart might identify:
- Price above a rising slope 200 SMA (tide) = only look for long trades
- Price above a rising slope 50 SMA (trend) = confirms a healthy trend
- Price pulls back to 20 EMA (timing zone) = start watching for price action confirming the entry
- Crossovers like the "golden cross" (50 SMA crossing 200 SMA) are only contextual signals indicating trend shifts, don't use them as entry triggers.
- On faster charts (1-hour and 30-minute), multiple touches of moving averages happen frequently due to noise; thus, confirmation from price action, volume, or other indicators is essential.
The core takeaway here is that knowing precise moving average numbers is easy. Mastering the **patience, discipline, and risk management** to trade only when the tide, trend, and timing all align is what really separates successful traders from losing ones. Indikator

Indikator

EMA MACD Trend Decision TableEMA MACD Decision Table v6
This Pine Script v6 overlay indicator summarizes trend, momentum, volume, higher-timeframe context, and ATR-based planning levels into one decision table.
The indicator uses EMA 9, EMA 21, EMA 50, EMA 100, EMA 200, MACD, RSI, ADX / DMI, volume confirmation, optional higher-timeframe EMA trend, and ATR risk planning.
It produces a numeric decision score on every bar. Bullish confirmations add points, bearish confirmations subtract points, and the final score is converted into Strong Buy, Buy, Neutral, Sell, or Strong Sell.
BUY labels appear only when the score first reaches Strong Buy territory. SELL labels appear only when the score first reaches Strong Sell territory.
This tool is designed for chart context and planning. It is not financial advice and does not guarantee trade results.
Scoring Logic
Condition | Score
--- | ---
EMA 9 above EMA 21 and price above EMA 50 | +2
EMA 9 below EMA 21 and price below EMA 50 | -2
Price above EMA 200 | +1
Price below EMA 200 | -1
MACD above signal and histogram above 0 | +2
MACD below signal and histogram below 0 | -2
MACD bullish crossover | +1
MACD bearish crossover | -1
RSI above 55 | +1
RSI below 45 | -1
ADX above threshold and +DI above -DI | +1
ADX above threshold and -DI above +DI | -1
Volume above average and candle closes above open | +1
Volume above average and candle closes below open | -1
Higher-timeframe close above its EMA when enabled | +1
Higher-timeframe close below its EMA when enabled | -1
Decision Output
Score Range | Decision
--- | ---
>= 5 | Strong Buy
2 to 4 | Buy
-1 to 1 | Neutral
-2 to -4 | Sell
<= -5 | Strong Sell
Decision Table Rows
Row | What It Shows | How To Read It
--- | --- | ---
Decision | Final decision and total score | Main summary of bullish, bearish, or mixed confirmation
Last Price | Latest close and price direction | Shows current price context
Bar Change | Close-to-close change and percent change | Positive is above prior close, negative is below prior close
O / H / L | Current open, high, and low | Shows current candle range
EMA 9 / EMA 21 | Short-term EMA relationship | EMA 9 above EMA 21 is bullish, below is bearish
EMA 50 / EMA 200 | Medium and long trend context | Price above EMA 200 supports bullish trend, below supports bearish trend
MACD | MACD state and histogram | Bullish when MACD is above signal and histogram is positive
RSI | RSI state and value | Above 55 bullish, below 45 bearish, above 70 overbought, below 30 oversold
ADX / DMI | Trend strength and direction | Strong +DI lead is bullish, strong -DI lead is bearish
Volume | Volume confirmation | Above-average bullish candle confirms buyers; bearish candle confirms sellers
HTF Trend | Optional higher-timeframe EMA trend | Bullish above HTF EMA, bearish below, Off when disabled
ATR | Current Average True Range | Risk planning unit
Long Plan | ATR-based long stop and target | Reference levels only
Short Plan | ATR-based short stop and target | Reference levels only
Candle Color Meaning
Score Range | Meaning | Candle Color
--- | --- | ---
>= 5 | Strong Buy | Lime
2 to 4 | Buy | Green
-1 to 1 | Neutral | Normal chart color
-2 to -4 | Sell | Maroon
<= -5 | Strong Sell | Red
ATR Planning Formulas
Plan | Formula
--- | ---
Long stop | close - ATR * stop multiplier
Long target | close + (close - long stop) * reward/risk
Short stop | close + ATR * stop multiplier
Short target | close - (short stop - close) * reward/risk
Data Window Values
Code | Meaning
--- | ---
2 | Strong Buy
1 | Buy
0 | Neutral
-1 | Sell
-2 | Strong Sell
Alert Logic
The script includes alerts for Strong Buy Decision, Strong Sell Decision, MACD Bullish Cross, and MACD Bearish Cross.
Strong decision alerts trigger when the score enters strong buy or strong sell territory. MACD alerts are based only on MACD line and signal line crossovers.
Reading The Output
Green output means bullish confirmations are stronger.
Red output means bearish confirmations are stronger.
Gray output means conditions are mixed or neutral.
The decision score is strongest when trend, momentum, volume, and higher-timeframe direction all agree.
Indikator

Strategi

EMA's, VWAP, Inside Day, SlingshotEMA's, VWAP, Slingshot & Inside Day
An all-in-one price action overlay combining four tools:
🔹 4 Customizable EMAs — Default lengths 5, 8, 20 & 50. Adjust lengths in Settings, colors in the Style tab.
🔹 VWAP — Only displays on intraday timeframes. Auto-hides on daily and above.
🔹 Slingshot — Uses an EMA of highs rather than closes, making it a tougher level to break above. When price closes above it after 3 consecutive bars below, it signals a momentum shift — like a slingshot snapping back. Paints the bar, plots a marker, and includes an alert.
🔹 Inside Day — Highlights bars fully contained within the prior bar's range. Indikator

Momentum Conviction [HermesCore]WHAT THIS INDICATOR DOES
Momentum Conviction watches two things at the same moment: where price momentum turns, and how much agreement stands behind that turn. The turn is an EMA crossover — the fast EMA (Exponential Moving Average) crossing the slow one — but only when the MACD histogram (Moving Average Convergence Divergence, a standard momentum gauge) is leaning the same way. A LONG fires when the fast EMA crosses above the slow EMA while MACD momentum is positive; a SHORT is the exact mirror. A cross with no momentum behind it is ignored.
Every signal that does fire is then graded 0 to 5 by a conviction score, built from five independent checks the moment the signal prints. You decide how much conviction you require: show every signal, or raise the minimum and keep only the ones with weight behind them.
WHY IT IS DIFFERENT
Most moving-average tools print an arrow on every cross and leave you to separate the real ones from the noise by eye. My rules are:
A cross is not a signal on its own. It has to happen while MACD momentum agrees. A large share of the crosses that fail are crosses that fired into flat or opposing momentum; gating on the histogram removes them before they ever reach the chart.
The score is a filter, not decoration. It is not a confidence label added after the fact — it is five yes/no facts, known at signal time, summed. Set a minimum and the weak signals never appear.
The higher timeframe gets a vote, not the final word. One of the five points is HTF agreement, so you can weigh it without being ruled by it.
ADX is deliberately excluded. I tested it repeatedly on the charts this was built for and it did not earn a place.
Everything updates on confirmed bars only. No intrabar flicker, no repainting, and the higher-timeframe reads use no look-ahead.
HOW TO READ THE CHART
LONG bubble (green, below the bar) and SHORT bubble (red, above it) mark each qualifying signal. Bubble size is adjustable.
The gradient EMA cloud is aqua when the fast EMA sits above the slow one (uptrend lean) and magenta when below. The slow EMA carries a soft gold glow so the spine of the trend is always easy to find.
A faint background tint colours the whole pane in the trend colour — a peripheral regime cue, nothing to act on by itself.
A faint gold background band shows the previous day's and previous week's range, for context on where price sits inside the larger structure.
THE CONVICTION SCORE
Each check is worth one point, decided at signal time, and never changes afterwards:
Momentum strength — the MACD histogram is larger than its own 50-bar average: the push is bigger than this market's normal push. +1
Slope agreement — the fast EMA is itself moving in the signal's direction, not merely crossing. +1
Higher-timeframe trend — the chosen HTF (4H by default) is trending the same way; its price and 50/200 EMAs agree. +1
Not over-extended — price is within a set ATR (Average True Range, a volatility measure) distance of the slow EMA, so you are not entering after the move has already run. +1
RSI room — RSI (Relative Strength Index, 0–100) is not already at an extreme in the signal's direction; there is room left to travel. +1
Five of five is a cross with bigger-than-normal momentum, sloping the right way, aligned with the higher timeframe, entered near value, with room to run. Zero is a bare cross with nothing behind it. The minimum-score input is where you set your own bar.
HOW I USE IT
The defaults are deliberately fast (EMA 2/12) — a low-timeframe, many-signals setting. Slow the lengths down for swing work and you get fewer, heavier signals.
I treat a high-score signal that agrees with the higher timeframe as the one worth acting on, and a low-score signal as information about the tape rather than a trade. The honest part: this is trend and momentum logic. It earns its keep when the market trends and gives a good deal of it back in ranges. The regime tint and the HTF vote exist to keep you on the right side of that question, not to solve it — be honest with yourself about which regime you are actually in.
SETTINGS THAT MATTER
EMA fast/slow and MACD lengths — the engine. Defaults are fast; raise them for higher timeframes and fewer, heavier signals.
Minimum score (0) — your conviction bar. 0 shows everything; raise it to thin the chart to signals with agreement behind them.
Higher timeframe (4H) — the trend you check against. Match it to your horizon.
Max distance to slow EMA (2.0 ATR) — how far from value still counts as "not over-extended."
RSI overbought/oversold (72/28) — the "room left" thresholds.
Each score component can be switched off individually if you want to see what it contributes on its own.
ALERTS
Momentum Conviction LONG and Momentum Conviction SHORT, both firing on the confirmed close of the signal bar, with ticker and timeframe in the message.
CALCULATION DETAILS
All logic evaluates on confirmed bars. A signal cannot appear or disappear inside a forming candle.
The trigger is the fast/slow EMA cross; the gate is the sign of the MACD histogram on the same close.
The higher-timeframe trend uses that timeframe's prior-bar close and 50/200 EMAs, requested with no look-ahead, so it does not repaint.
The conviction score is computed once, at signal time, from the values listed above.
HONEST LIMITATIONS
This is trend-following momentum. In a range it will cross back and forth and hand gains back; no filter removes that, it only thins it.
The score is a hypothesis about signal quality, not a measured edge. This indicator does not keep score for you. If you want to know whether higher scores actually perform better on your symbol, run the matching strategy version in the Strategy Tester with realistic costs and read the result yourself.
The defaults trade often. On a live account, slippage and spread on frequent entries matter more than the chart suggests — cost everything before you believe anything.
Signals are evaluated at the close; real fills happen later and worse. Treat the chart as the ideal case.
It runs on any symbol and timeframe, but "runs" is not "has an edge" — whether it works on your market is yours to verify. Past behaviour is not the next signal.
Not financial advice. It manages no positions and places no orders.
ORIGINALITY
The ingredients — EMA crosses, MACD, RSI, ATR — are as old as charting. The momentum-gated trigger, the five-factor conviction score and its use as a hard filter, the regime-aware visual language and the non-repaint construction are my own work in Pine v6. Every value the script uses is recomputable from the rules above.
Questions and suggestions are welcome in the comments. Enjoy. Indikator

Trend Structure Scale-In👋 What's up traders,
Decided to finally share this one after a lot of testing, tweaking, and more chart staring than I'd like to admit.
Trend Mitigation Scale-In Pro is built around a simple idea: trade with the trend, wait for quality pullbacks, and let probabilities do the heavy lifting.
The strategy combines:
• EMA200 trend filtering
• Pivot structure detection
• Engulfing candle confirmation
• Mitigation-based entries
• Controlled scale-ins on pullbacks
• Fixed basket take-profit management
The goal isn't to catch every move. It's to stay aligned with the bigger trend and focus on higher-quality setups while keeping execution simple.
Like every strategy, it's not perfect and should always be tested thoroughly before being used on a live account.
I'm constantly building, testing, and improving new ideas, so feedback is always appreciated.
If you find it useful, a ⭐ Favorite, 👍 Like, or 🚀 Boost helps more than you think and motivates me to keep sharing.
Wishing everyone green charts and disciplined trading. 🏆
Good luck out there.
— Tomukasss
Strategi

Strategi
Melissa 2-Candle EMA Wick Break Indicator**Melissa 2-Candle EMA Wick Break Indicator**
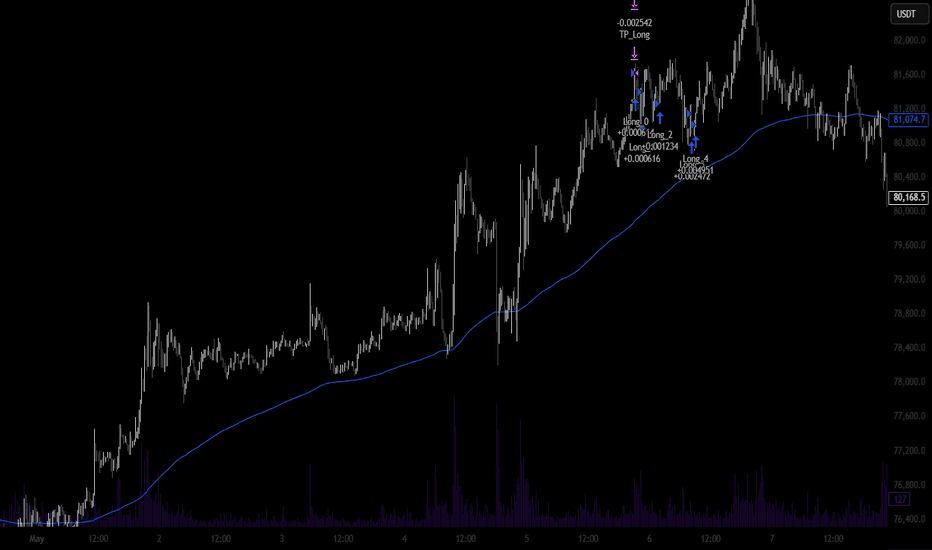
The Melissa 2-Candle EMA Wick Break Indicator is designed to identify simple momentum-based continuation entries after price crosses an Exponential Moving Average.
The indicator looks for a two-candle confirmation pattern using two candles of the same colour. For a bullish setup, two green candles must form while price moves from at or below the EMA to closing above it. For a bearish setup, two red candles must form while price moves from at or above the EMA to closing below it.
Once the two-candle setup is confirmed, the indicator does not trigger an entry immediately. Instead, it waits for price to break the wick of the second candle. A long entry signal appears when price breaks above the second candle’s high, and a short entry signal appears when price breaks below the second candle’s low.
The indicator also plots the EMA, setup markers, pending wick-break levels, entry signals, and optional stop loss and take profit reference levels. The default trade example is based on 10 contracts with a $300 target, but these values can be adjusted in the settings.
This tool is intended to help traders visually identify cleaner EMA crossover opportunities with confirmation, rather than entering on the first touch or break of the moving average.
Indikator