Delta Calculator Calculating Delta for options live, can be used to see what is the chance for price going to X in Y time. can change everything in settingsIndikatoroleh LeonardoDaTrader39
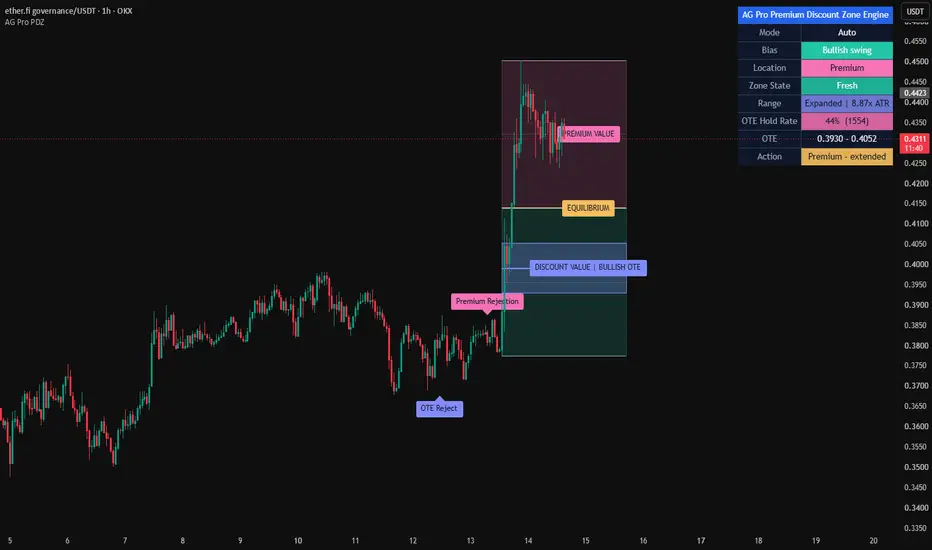
AG Pro Premium Discount Zone Engine [AGPro Series]AG Pro Premium Discount Zone Engine Overview / What it does AG Pro Premium Discount Zone Engine is a dealing-range and retracement context overlay built to map relative value inside a selected swing. Instead of treating price as a sequence of isolated candles, the script frames current price location against an active high-low range and highlights where price is trading relative to equilibrium, premium, discount, and the OTE area. The core purpose of this tool is organizational. It is desigIndikatoroleh AGProLabsDiupdate 2188
True Volume Buy/Sell Pressure PercentageThis indicator shows the True Volume as a oscillator in a percentage format that's more accurate and gives you a slight insight of what's happening behind the scenes of the current session(candle) to help with entries and exits. You may play with this on different TFs and adjust the threshold to your liking. Included in settings you have different MAs such as EMA, RWA, MA, and WMA, plus smoothing length and type for you to perfect your confirmation to help with decision making. Enjoy this indicaIndikatoroleh Mr_Unlimited46
JINDV1key levels based on PB trading includes fvgs on most important tfs, smts, and session highs and lows.Indikatoroleh jettbland1820
SMC Range + Order Block + Dealing Range [v6]This indicator is designed to help you visually track three core Smart Money Concepts on the chart: Range / Consolidation Zones Order Blocks Dealing Ranges / Expansion Legs Together, those three things help you answer the real trading questions: Where is price compressing? Where did price launch from? Where is price likely to react or rebalance? Is price in discount, premium, or near equilibrium? Is this move continuation, manipulation, or distribution? That’s what this script is trying to sIndikatoroleh JamesK318110
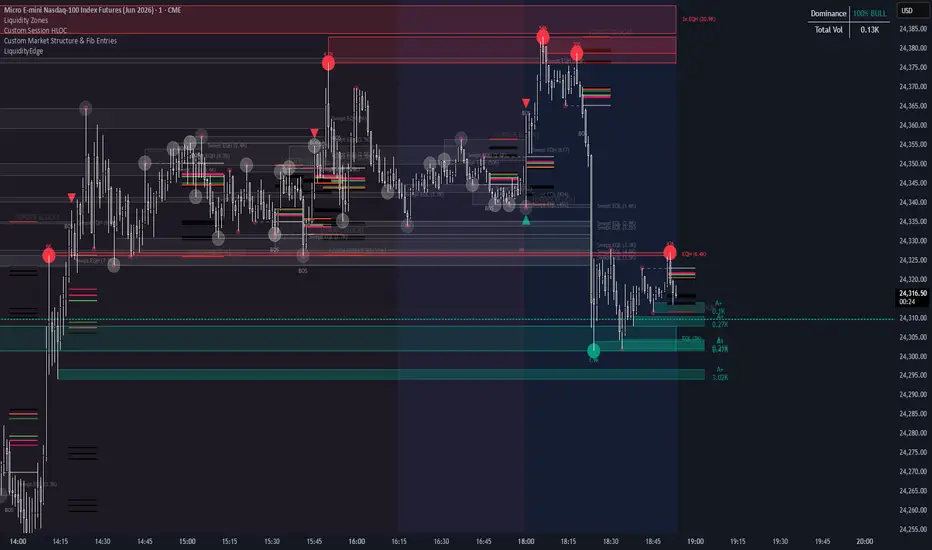
LiquidityEdge | DepthFlow Suiteliquidity points with rating 11111111111111111111111111111111111111111111111111111111111111111111111111111111111111111111111111111111111111111111111111111111111111111111111111111111111111111111Indikatoroleh Daveconl2336
ES Algorithmic Order Flow: Tracking the Institutional FootprintA lot of retail traders are getting chopped up trying to pick tops and bottoms on the ES this week. If you strip away the lagging indicators and look strictly at the algorithmic order flow the picture becomes incredibly clear I have my custom Institutional MTF Dashboard running alongside our Smart Money Footprint engine here on the chart, and you can see the exact moments where volume anomalies overlap across the 15-minute and 1-hour timeframes. When the footprint highlights a massive supply sIndikatoroleh EduardoCTS287
SCT_POSITIONS Call Alert SystemFocused on options trading.Gives targets, stop loses...Indikatoroleh slr55358
AG Pro Fair Value Gap Engine [AGPro Series]AG Pro Fair Value Gap Engine OVERVIEW / WHAT IT DOES AG Pro Fair Value Gap Engine is a rules-based overlay built to detect 3-bar fair value gap structures and organize them as a living imbalance map on the chart. The script identifies bullish fair value gaps when the current low is above the high from two bars earlier, and bearish fair value gaps when the current high is below the low from two bars earlier. Once detected, each zone is stored, rendered, tracked through time, and updated as pIndikatoroleh AGProLabsDiupdate 2149
P/E Based Earnings SignalsP/E Based Earnings Signals This script is an event-driven indicator that evaluates earnings releases through a valuation and share-structure lens. Instead of focusing only on price action, it uses reported earnings data, estimated earnings data, and shares outstanding to identify conditions that may be relevant after an earnings update. The main idea is to filter earnings events using simple but specific fundamental rules, then display signals only when those conditions are met. Concept: ManyIndikatoroleh ZenOutMan26
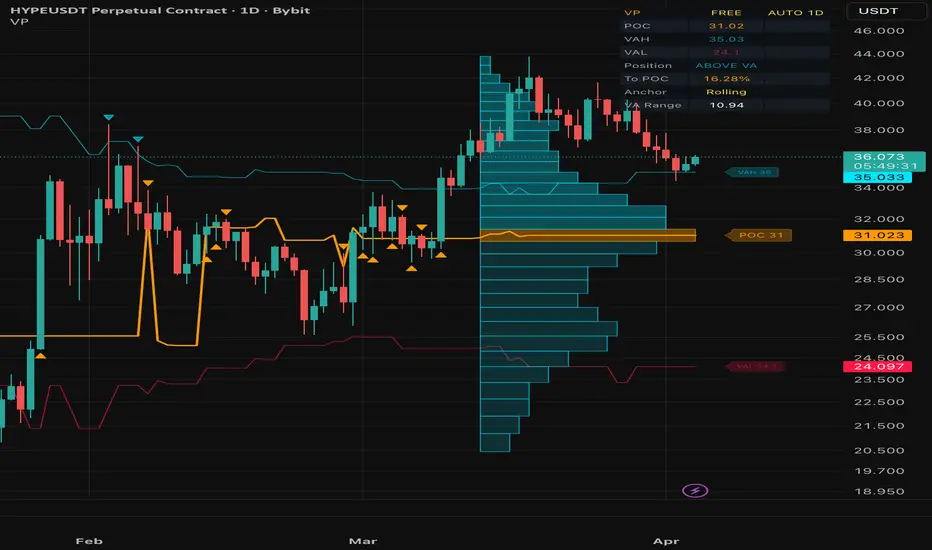
Volume Profile█ VOLUME PROFILE Volume-at-Price Analysis with POC, VAH & VAL A powerful volume-at-price analysis overlay that calculates and visualizes the Point of Control (POC) , Value Area High (VAH) , and Value Area Low (VAL) directly on your chart. It reveals where the most trading activity occurred and provides real-time price position analysis — helping you identify high-probability support/resistance levels and mean-reversion zones. Free and Open Source. █ THE CONCEPT: WHY VOLUME PROFILEIndikatoroleh alphachart_tv437
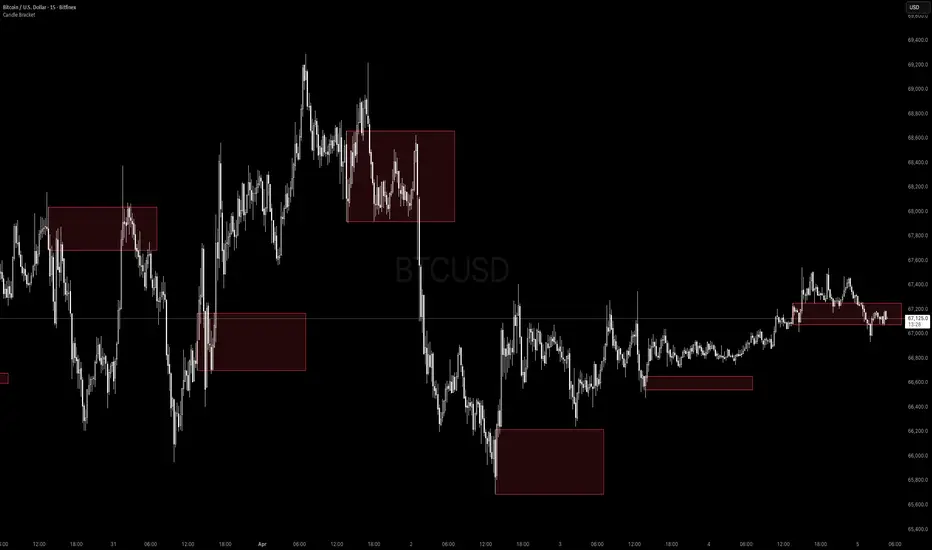
Candle Bracket - Mark Any HTF Candle's Range at a Specific TimeWhat It Does Candle Bracket draws a visual range box using the High and Low of any higher timeframe candle at a user-defined time of day. Set it to the 9:30 AM 15-minute candle and you get the Opening Range. Set it to the London open, the New York open, or any key session candle — the indicator marks it automatically, every day. Use Cases - Opening Range Breakout (ORB) - Mark the 9:30 or 9:45 AM candle as your initial range - Session Opens - London (3:00 AM ET), New York (9:30 AM ET), Asia (8Indikatoroleh SkywardProtocolDiupdate 48
Institutional Footprint Detector [XAU/USD]Dark footprint table top-left with 14 rows — score, grade, all 5 signals with individual points, entry signal, and position size recommendation Kill zone background shading — blue London, green NY, purple Asian Green/amber bar coloring when footprint score is 70+ Red bar coloring on fake moves "ABSORPTION CONFIRMED" labels at the exact confirmation candle "DELTA FLIP BULL/BEAR" labels when delta diverges from price "VOL IMBAL" labels when volume imbalance candles appear "FAKE LOW VOL" labels on Indikatoroleh Tk31756789
FIBONACCI BREAKOUT PRO🚀 FIBO-KAMA BREAKOUT PRO (V5) 📋 Description FIBO-KAMA BREAKOUT PRO is a high-precision technical analysis tool designed to identify price squeeze patterns (Wedge/Kama Formations) and validate breakouts using a combination of Fibonacci Golden Ratio (0.618), MA 7 Momentum, and Relative Volume Spikes. While many indicators signal every minor breakout, this script filters out market noise (fake-outs) by ensuring that a move is mathematically significant and backed by institutional volume. It is spIndikatoroleh SrDBtU39
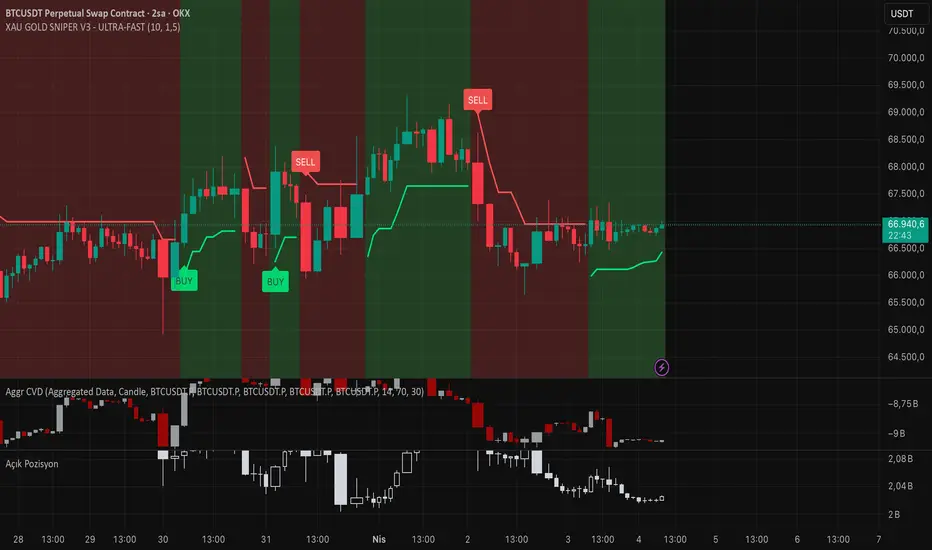
BTC XAU GOLD SNIPER V3 - ULTRA-FASTXAU GOLD SNIPER V3 - ULTRA-FAST 📋 Description XAU GOLD SNIPER V3 is an advanced technical analysis tool specifically optimized for capturing high-velocity price movements and short-term trend reversals in XAU/USD (Gold). This version integrates Dynamic Momentum tracking with an Adaptive Trend Filtering algorithm to filter out market noise and identify high-probability entry points. Designed specifically for the unique volatility of Gold, it performs exceptionally well on lower timeframes such Indikatoroleh SrDBtU78
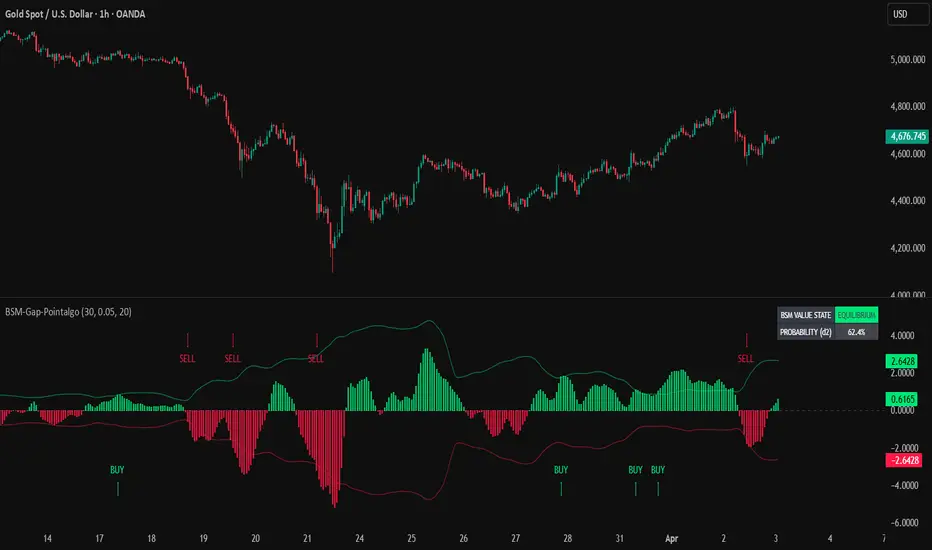
Black-Scholes Quantum Gap [Pointalgo]Market Pricing Inefficiency & Probabilistic Value Engine Black-Scholes Quantum Gap is a quantitative indicator designed to measure the difference between current market price and a theoretical fair value estimate derived from probabilistic pricing concepts. The tool helps traders identify discount (undervalued) and premium (overvalued) conditions in the market using a structured, model-driven approach. What This Indicator Does This indicator builds a dynamic pricing benchmark and compares itIndikatoroleh pointalgo58
NQ Session edge proNQ Session Edge Pro is an intraday indicator for NQ and MNQ that organizes price action around the London session range, New York session behavior, OTE zones, and a session-state classification model. The purpose of the script is to help traders interpret whether New York is continuing the London move, reversing it, consolidating inside the established range, or taking liquidity on both sides before directional expansion. Rather than treating these concepts separately, the script combines them Indikatoroleh curtismartinez114
Brandt Classical Charting SystemThe Core Workflow 1. Let the Indicator Scan for You The script is constantly looking for classical patterns forming. When you load it on a chart, check the dashboard in the top-right corner — it tells you the current "Pattern Status." If it says "Scanning..." there's no valid pattern yet. Be patient. Brandt himself often waits weeks or months for setups. 2. Focus on Rectangles First Brandt considers rectangles with horizontal boundaries his highest-conviction patterns. When the indicator draws aIndikatoroleh mknopp837
Volume Acceptance Zones [BigBeluga]Volume Acceptance Zones is a market structure tool designed to identify areas of price acceptance and statistically stretched extremes. By modeling market activity as a continuous distribution, the indicator highlights where price is actively accepted versus where it behaves as a statistical outlier. The goal is not prediction, but context — separating balanced price behavior from structurally stretched conditions. 🔵 CONCEPTS The indicator calculates a Volume-Weighted Balance Price , Indikatoroleh BigBelugaDiupdate 2 1.6 K
Currency News Monitor Ver. 2This is an updated version for the Currency News Monitor. I thought that instead showing values for the Fundamental indicators(like CPI or I.R) it will be more useful if it shows if there is any Fundamental News on the current day for each of the currencies on the chart. This indicator will show only the critical ones(CPI, GDP, Interest Rates and Unemployment) Unfortunately my plan only allows few requests so I couldn't add more. Also this version will have a selection of the majors Countries/ CIndikatoroleh cyberFX201915
Probability Live Table (Juan)The Probability Table Live is an advanced indicator for TradingView designed to display real-time probabilities of price movement for any currency pair and timeframe. This tool organizes the information into a clear and visual table, using intuitive colors to quickly interpret trend strength and the likelihood of continuation or retracement. 🔹 What the chart includes: Mode → Indicates the current trend: UPTREND or DOWNTREND Continuation Rate (Cont. Rate) → Probability that the trend will cIndikatoroleh juanpenatradinglcn13
Ultimate Trend Suite: SMAs | MAs | Cloud | VWAP | BB [R2D2]Ultimate Trend Suite: Dynamic MAs, Cloud, VWAP & Bollinger Bands Overview Chart clutter is a trader’s worst enemy. Constantly toggling between different moving averages, volatility bands, and volume indicators can lead to analysis paralysis. The Ultimate Trend Suite is designed to be your “one-stop shop” for trend analysis. It combines the most powerful traditional moving averages (SMAs and EMAs) with a visual Trend Cloud, Session VWAP, and Bollinger Bands into a single, fully customizable oveIndikatoroleh R2D2_4Life14
Catalyst Response AtlasCatalyst Response Atlas maps what price is actually doing after a corporate catalyst. Instead of treating an earnings beat, dividend, or split as a signal by itself, this indicator measures whether the market is accepting that reaction, fading it, or simply balancing after the event. The script tracks the latest selected catalyst and then builds a simple post-event framework around it: - a catalyst-anchored VWAP - volume-weighted sigma bands around that AVWAP - the high/low range of the cataIndikatoroleh nexusledger12
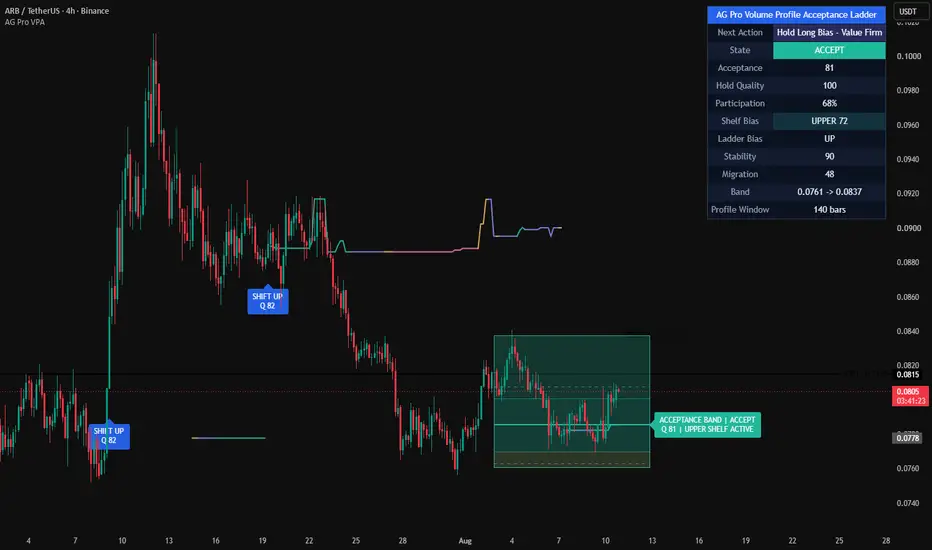
AG Pro Volume Profile Acceptance Ladder [AGPro Series]AG Pro Volume Profile Acceptance Ladder Overview / What it does AG Pro Volume Profile Acceptance Ladder is a volume-structure indicator designed to monitor whether price is building acceptance, holding acceptance, or losing acceptance inside a rolling volume-defined band. Instead of treating volume profile as a static reference snapshot, this script tracks acceptance as a progressive process. The goal is not to predict where price must go next, but to help the user read whether the market isIndikatoroleh AGProLabsDiupdate 155