RocketFlowRocketFlow is a volatility-compression breakout indicator designed to identify when price is preparing to aggressively challenge or cross the Ichimoku Cloud. The system combines cloud structure, ATR-based resistance proximity, momentum acceleration, candle expansion, RSI pressure, trend behavior, and compression analysis to detect high-pressure market conditions before expansion moves occur. Signals are graded into multiple strength tiers based on breakout quality, momentum force, and structural alignment, helping traders identify early pressure buildup as well as stronger breakout attempts. The indicator is built around the idea that explosive moves often originate from compressed price action positioned just beneath key resistance zones, particularly near the Ichimoku Cloud and ATR-defined pressure areas.
In addition to the Rocket breakout system, the indicator also includes ATR-based LONG signals designed to detect reclaim setups, support holds, and momentum continuation opportunities near dynamic ATR support zones.
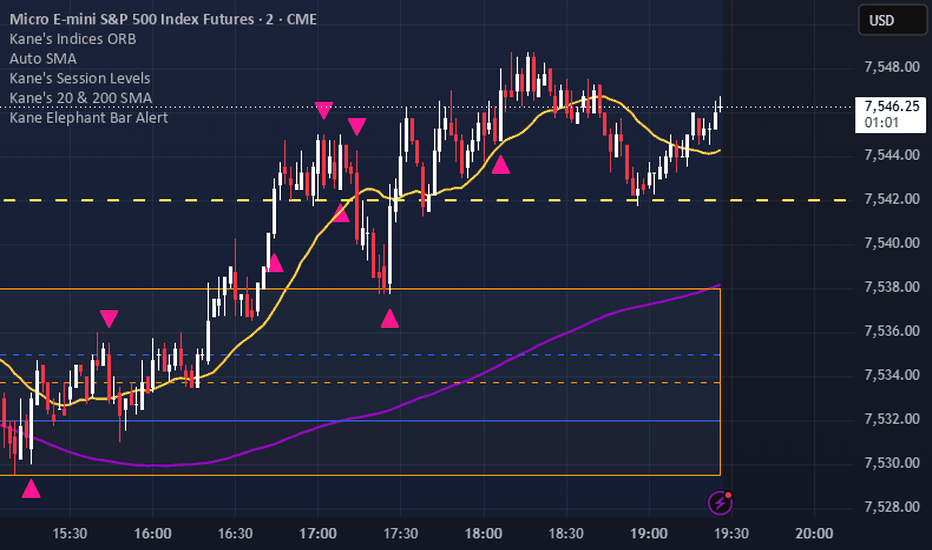
The visual system is designed to show the different stages of breakout development and post-signal behavior:
Red, yellow, and dark green circles represent “Pre-Rocket” formation stages, showing when pressure and momentum are beginning to build beneath the cloud before a full breakout signal is confirmed.
Green and aqua triangles represent Rocket breakout signals. Smaller green triangles indicate weaker or earlier breakout attempts, while larger aqua triangles represent the strongest “God Rocket” expansion conditions with the highest momentum and breakout quality.
LONG triangles below price represent ATR Support LONG signals triggered from reclaim or support continuation setups.
Orange and red squares monitor post-breakout behavior. Orange squares warn of weakening momentum or rejection behavior after a launch, while red squares indicate more serious breakdown or stop-risk conditions.
Yellow and green lower squares track healthy pullbacks and potential re-entry opportunities after an initial breakout move.
The purple ATR line acts as a dynamic volatility-based support and trailing structure level.
The Ichimoku Cloud itself functions as the primary resistance and pressure zone the system is attempting to predict price crossing through. Indikator

Indikator
Indikator

Institutional Momentum & Liquidity Matrix
Institutional Momentum & Liquidity Matrix
■Overview
This tool is a quantitative analysis suite designed to bridge the gap between price momentum and market liquidity structure. Moving away from the traditional approach of monitoring "where the RSI is currently," it calculates the exact price required for the RSI to reach overbought/oversold levels on the next candle and visualizes it directly on the chart. This projection is overlaid with an RSI-Anomaly Volume Profile to highlight true structural exhaustion.
■1. Originality and Design Philosophy
While RSI and Volume Profile are widely used, they are typically viewed in isolation, leading to false signals. This script is original because it mathematically merges them:
1. It projects the theoretical elastic limits of momentum directly onto the price scale using algebraic reversal of Wilder's Smoothing.
// Algebraic Reversal of Wilder's Smoothing (RMA)
f_get_reverse_price(target_rsi) =>
float target_rs = target_rsi / (100.0 - target_rsi)
float req_up = (target_rs * prev_rma_d * (rsi_len - 1)) - (prev_rma_u * (rsi_len - 1))
float req_down = (prev_rma_u * (rsi_len - 1) / target_rs) - (prev_rma_d * (rsi_len - 1))
float rev_price = req_up > 0 ? prev_c + req_up : (req_down > 0 ? prev_c - req_down : prev_c)
rev_price
2. It filters a Lower Timeframe (LTF) Volume Profile using LTF RSI data, discarding neutral volume and coloring only the specific price nodes where momentum reached extreme anomalies.
// RSI Anomaly Matrix & Peak Retention Logic
bool is_significant = (intensity * 100.0) >= vol_threshold
color base_c = color_prof_neutral
if is_significant
if rsi_color_mode == "Peak Retention"
if max_rsi >= rsi_ob and min_rsi <= rsi_os
base_c := (max_rsi - 50.0) > (50.0 - min_rsi) ? color_ob : color_os
else if max_rsi >= rsi_ob
base_c := color_ob
else if min_rsi <= rsi_os
base_c := color_os
■2. Core Mechanism 1: Reverse RSI Projection (The Math)
Instead of tracking an oscillator bounded between 0 and 100, this script mathematically reverses J. Welles Wilder Jr.'s Smoothed Moving Average (RMA) formula.
To calculate the exact closing price required on the next bar to achieve a specific Target RSI (e.g., 70 or 30), the script uses the following logic:
RS = Target_RSI / (100 - Target_RSI)
Required_Up =
(RS * Prev_RMA_D * (Length - 1)) - (Prev_RMA_U * (Length - 1))
Required_Down =
(Prev_RMA_U * (Length - 1) / RS) - (Prev_RMA_D * (Length - 1))
It plots these calculated prices as horizontal projection lines, allowing traders to evaluate momentum limits directly on the price action.
■3. Core Mechanism 2: RSI Anomaly Liquidity Matrix
Momentum limits require structural backing to be reliable. This engine aggregates LTF data to generate a filtered Volume Profile.
・Dynamic Sessions: Generates profiles based on Daily, Weekly, Monthly, or Custom Market Sessions (Defaults are set to UTC for Oceania, Asia, London, and NY).
・RSI Anomaly Coloring: Instead of plotting standard volume, the script calculates the average LTF RSI for each price node. It only applies color to nodes where the average momentum reached extreme Overbought or Oversold levels, keeping the rest of the profile neutral. This eliminates visual noise and isolates true areas of structural exhaustion.
・Point of Control (POC): Automatically extracts and highlights the price level with the highest liquidity concentration.
■4. Configuration & Parameters
・Profile Generation Mode: Determines time boundaries. Day traders can use Custom Sessions (UTC), while swing traders benefit from Daily/Weekly structures.
・Liquidity Data Source: While 'Volume' is the standard input, 'Price Delta' is provided as a proxy to ensure the profile functions on assets lacking raw volume data (e.g., certain Forex feeds).
・Max LTF Samples per Bar: Limits how many LTF candles are processed per higher timeframe candle to optimize performance and prevent calculation limits.
・RSI Coloring Mode: Controls sensitivity. "Volume-Weighted Average" is mathematically strict but colors may neutralize over time. "Peak Retention" ensures that if a price node hits an RSI extreme at any point during the session, it permanently retains that warning color, preventing dilution.
・Significance Threshold & Hide Weak Nodes: Filters out price nodes that lack sufficient volume (e.g., under 30% of the POC volume). Graying out or hiding low-volume nodes removes noise.
・POC Proximity Filter: Fades the RSI projection lines if no historical POC is nearby, utilizing ATR to define a dynamic "safe zone." Momentum extremes without structural support are prone to false breakouts.
■5. Usage & Mindset
・Best Suited For: High-liquidity instruments (Major Forex, Indices, Large-cap Crypto) on 15M to 1H charts.
・Execution: Do not enter blindly when price hits the RSI projection line. Wait for confluence: "Is this momentum extreme backed by a colored, structural POC wall?" Use the confluence zone to define strict Stop Loss levels.
■Disclaimer
This script is a quantitative analysis tool designed for educational purposes to visualize mathematical momentum and liquidity data. It does not guarantee future profits and is not intended as a signal service. Always employ strict risk management and conduct comprehensive market analysis.
Institutional Momentum & Liquidity Matrix
概要
本ツールは、価格モメンタムと市場流動性の構造的差異を統合的に分析するための定量分析スイートです。「RSIの現在値」に依存するアプローチから脱却し、「特定のRSI水準に到達するために必要な要請価格」を逆算してチャート上に直接可視化します。さらに、RSI異常値を反映した流動性マトリックスを展開し、構造的な枯渇点を浮き彫りにします。
1. 独創性と設計思想
RSIと出来高プロファイルは広く普及していますが、単体での使用はダマシを誘発します。本スクリプトはこれらを数学的に統合した点に独創性があります。
1. Wilderの平滑化移動平均(RMA)を代数的に逆算し、モメンタムの限界値を価格スケール上に直接投影します。
2. 下位足(LTF)の出来高プロファイルをLTFのRSIデータでフィルタリングし、極端な異常値(過熱感)を記録した価格帯のみを色付けして視覚化します。
2. コア・メカニズム1: 逆算RSIプロジェクション(計算根拠)
オシレーターを監視するのではなく、RMAの計算式を逆算します。次期のローソク足で指定のRSI極値(例: 70または30)に到達するための終値を、以下のロジックで算出します。
RS = 目標RSI / (100 - 目標RSI)
必要な上昇幅 =
(RS * 前回のRMA下落幅 * (期間 - 1)) - (前回のRMA上昇幅 * (期間 - 1))
必要な下落幅 =
(前回のRMA上昇幅 * (期間 - 1) / RS) - (前回のRMA下落幅 * (期間 - 1))
算出された価格を水平線として描画し、価格アクション上でモメンタムの限界を評価可能にします。
3. コア・メカニズム2: RSI異常値・流動性マトリックス
LTFデータを集計し、高度なフィルターを備えた価格帯別出来高を生成します。
・動的セッション: 日次、週次、月次、または特定の市場セッションに対応(※セッション時間はすべてUTC基準です)。
・RSI異常値カラーリング: 各価格帯の平均LTF RSIを算出し、買われすぎ/売られすぎの極限領域に達した価格帯のみを色付けします。通常の価格帯をニュートラルカラーに保つことで視覚的ノイズを排除します。
・Point of Control (POC): 最大流動性が集中する価格帯を自動抽出し、強力なレジサポとしてハイライトします。
4. パラメーター設定
・Generation Mode (生成モード): デイトレーダーには特定の市場セッションが、スイングトレーダーには日次・週次の構造が適しています。
・Liquidity Data Source (流動性データ): 「出来高」を基本としますが、出来高データがない銘柄(一部のFX等)でも機能するよう、「価格変動幅(Price Delta)」を選択可能です。
・Max LTF Samples per Bar (最大LTF参照数): 上位足1本に対して参照する下位足の本数を制限し、計算処理を最適化します。
・RSI Coloring Mode (カラーリング感度・保持): プロファイルの色付け基準を選択します。「出来高加重平均 (Volume-Weighted)」は厳格ですが、その後の通常取引によって色が中和される性質があります。「ピーク保持 (Peak Retention)」を選択すると、セッション中に一度でもRSI異常値を記録した価格帯は、その極値カラーを履歴として保持し続けます(高感度モード)。
・Significance Threshold (有意性閾値): POCに対して一定割合に満たない価格帯をグレーアウトまたは非表示にし、真の壁のみを残します。
・POC Proximity Filter (近接フィルター): 過去のPOCが近くにない場合、プロジェクションラインをフェードアウトさせます。構造的な支持を持たない極値はダマシになりやすいため、ATRを利用したリスク管理レイヤーとして機能します。
5. 使い方と環境
・得意な環境: 流動性の高いメジャー通貨ペア、主要株価指数、大型暗号資産の15分足〜1時間足。
・思考プロセス: 価格がRSIプロジェクションに到達したからといって盲目的にエントリーせず、「その極値の背後に、色付けされたPOCの壁が存在するか」を確認してください。コンフルエンス領域を基準に、厳格な損切りを設定してください。
免責事項
本スクリプトは、数学的モメンタムおよび流動性データを可視化し、市場構造の理解を深めるための教育用ツールです。将来の利益を保証するものではなく、シグナル配信ツールではありません。常に適切なリスク管理と独自の市場分析を行ってください。
Indikator

Indikator

SixShooterSixShooter (6SHOT)
A multi-timeframe POC compression and breakout engine for TradingView.
SixShooter combines anchored VWAPs, rolling volume-profile POCs, compression analytics, trend-regime filters, and breakout acceleration logic into a single institutional-style framework.
Built to detect:
Coiled breakout setups before expansion
Trend continuation acceleration (“THRUST”)
Structural rollover tops
Multi-timeframe support/resistance stacking
Regime transitions between accumulation and distribution
Core Concept
6SHOT tracks six major market structure levels simultaneously:
Rank Level Description
1 dPOC Current day anchored VWAP
2 pdPOC Prior day VWAP
3 wPOC Current week volume-profile POC
4 pwPOC Prior week POC
5 mPOC Current month POC
6 pmPOC Prior month POC
These levels form a live structural “stack”.
When the stack compresses tightly and directional alignment emerges, the indicator searches for:
breakout conditions,
trend acceleration,
or rollover failure structures.
What Makes SixShooter Different
Unlike traditional indicators that only react to price:
6SHOT measures market structure compression directly.
Uses multi-timeframe POC migration as the primary signal source.
Detects “energy loading” before expansion.
Separates trend continuation from true structural reversals.
Uses higher-timeframe regime filters to reduce noise.
The result is fewer but significantly higher-quality signals.
Price Pane Features
Multi-Timeframe POC Levels
The indicator draws six persistent horizontal support/resistance levels:
Daily VWAP structures
Weekly volume-profile structures
Monthly volume-profile structures
Each level:
extends across the chart,
updates only at current values,
and includes right-edge ranked labels.
The ranking system lets traders instantly visualize:
shallow vs deep support,
stacked bullish structure,
or stacked bearish structure.
Stack Score
6SHOT continuously scores the ordering of all six POCs.
Bullish Stack
Perfect bullish alignment:
dPOC > pdPOC > wPOC > pwPOC > mPOC > pmPOC
Bearish Stack
Perfect bearish alignment:
pmPOC > mPOC > pwPOC > wPOC > pdPOC > dPOC
The score ranges from:
+1.0 → fully bullish structure
0.0 → mixed / transitional
-1.0 → fully bearish structure
A live color-coded readout displays:
BULL
MIXED
BEAR
directly above the POC stack.
Lower Pane Analytics
Compression Engine
6SHOT measures:
(max POC − min POC) / ATR
Then percentile-ranks it over time.
This creates a normalized compression score:
100 = tightest structural compression
0 = widest structural dispersion
Compression alone is not enough for signals.
The indicator additionally requires:
directional alignment,
price coiling,
trend validation,
and regime confirmation.
Signal Types
1. POP Signals
Primary breakout engine.
POP UP
Triggers when:
compression is extreme,
POCs align upward,
price is tightly coiled,
higher-timeframe regime agrees,
and chop filters are cleared.
Designed to detect:
explosive upside expansions,
trend initiations,
and continuation launches.
POP DOWN
Two mechanisms:
Coil Breakdown
Symmetric bearish version of POP UP.
Rollover Breakdown
Independent structural-top detector using:
failed swing highs,
lower highs,
lower lows,
ATR-based drawdown,
and down-sloping structure.
Rollover logic is one-shot and re-arms only after a new swing high.
2. THRUST Signals
Trend acceleration engine.
Designed for:
continuation moves after the original breakout,
momentum expansion,
volatility expansion,
and runaway trends.
Requirements include:
ATR expansion,
decisive candle closes,
directional POC agreement,
and multi-bar momentum thrust.
Useful for catching:
late-stage trend acceleration,
squeeze continuations,
and momentum cascades.
3. PRE-READY Signals
Early-warning compression detector.
Appears before full READY conditions when:
compression is rapidly tightening,
but hasn’t yet reached breakout thresholds.
Useful for:
stalking setups,
preparing alerts,
or anticipating imminent POP conditions.
Disabled by default.
4. Strict Canonical Pattern
The highest-conviction bullish structure in the system.
Requires:
all POCs stacked beneath price,
ideal monthly/weekly/daily ordering,
price glued tightly to dPOC,
and sufficient structural support depth.
When active:
the chart receives a lime structural tint,
and breakout confirmation fires on expansion above prior highs.
This is designed to identify:
loaded continuation structures,
institutional support stacking,
and pre-expansion equilibrium zones.
Regime & Noise Filters
Higher-Timeframe PSAR Filter
Automatically steps one timeframe higher than the current chart.
Examples:
5m → 1H regime
1H → Daily regime
Daily → Weekly regime
Used to suppress:
countertrend coil signals,
weak reversals,
and noisy breakdowns.
PSAR Proximity Gate
Suppresses signals when price is too close to PSAR flip zones.
Purpose:
avoid signals during unstable trend transitions,
reduce chop noise,
and prevent one-bar fakeouts.
Chop Detection
Measures net movement relative to ATR.
If price is oscillating without meaningful progress:
POP signals are blocked,
unless a true range breakout occurs.
Strong Trend Lockout
Prevents countertrend fires in clear macro trends.
Example:
suppress bearish signals during strong long-term uptrends,
suppress bullish signals during strong downtrends.
Built specifically to eliminate:
repeated fake reversals inside runaway trends.
Recency-Weighted POC Engine
Optional decay weighting allows newer volume activity to dominate POC calculations.
ON
More adaptive and predictive.
OFF
Traditional full-period volume-profile behavior.
This creates a balance between:
responsive modern structure tracking,
and classic static POC analysis.
Best Use Cases
6SHOT performs best on:
equities,
crypto,
futures,
and momentum-driven instruments.
Particularly effective for:
swing breakouts,
volatility expansions,
trend continuation,
squeeze detection,
and structural reversals.
Designed Philosophy
Quality over quantity.
6SHOT intentionally filters aggressively:
higher thresholds,
cooldown systems,
anti-flip protection,
trend lockouts,
and regime filters
all exist to suppress low-quality noise.
The goal is not maximum signal frequency.
The goal is:
structurally meaningful signals,
cleaner trend participation,
and earlier recognition of expansion regimes.
Included Features
Multi-timeframe POC stacking
Anchored VWAP integration
Weekly & monthly rolling volume profiles
Compression percentile analytics
Trend acceleration detection
Structural rollover detection
Regime-aware breakout filtering
Anti-whipsaw cooldown engine
Higher-timeframe PSAR confirmation
Dynamic support/resistance labeling
Canonical stacked-support detection
Real-time structural score readout
Recommended Workflow
Many traders use 6SHOT as:
Trend Structure Layer
Use POCs + stack score to understand market positioning.
Setup Detection Layer
Use PRE-READY + READY compression states to stalk opportunities.
Execution Layer
Use POP / THRUST fires for entries.
Risk Layer
Use stacked POCs as dynamic support/resistance zones.
Important Notes
6SHOT is not a standalone trading system.
It is a structural-analysis framework designed to:
identify high-energy market conditions,
classify trend regimes,
and surface asymmetric breakout opportunities.
Best results come when combined with:
market context,
volume analysis,
macro structure,
and disciplined risk management. Indikator

Multi-Factor Regime Engine Pro [MarkitTick]💡 This indicator represents a robust framework designed to quantify market regimes by analyzing an array of price action, volatility, and momentum metrics. By synthesizing ten distinct market features into a unified confidence score, it dynamically adjusts its threshold bands, providing a highly adaptive approach to trend identification on any standard chart.
✨ Originality and Utility
Standard trend-following tools often rely on static lookback periods and fixed multipliers, which can lead to delayed signals during sudden market shifts or excessive false signals during consolidation. This indicator diverges from traditional methods by introducing a dynamic, feature-engineered confidence score. Instead of relying on a single data point like closing price or standard volatility, it aggregates inputs from momentum oscillators, directional movement indices, volume profiles, and standard deviation bands. This multi-dimensional analysis allows the indicator's bands to compress during high-confidence trends and expand during uncertain, low-confidence environments, offering a highly responsive and adaptive utility for modern chart analysis. Furthermore, it incorporates strict internal safeguards to prohibit execution on non-standard charts, ensuring the integrity of the data and preventing repainting vulnerabilities.
🔬 Methodology and Concepts
● The Feature Engineering Engine
The core of this indicator is built upon extracting ten distinct normalized features from the market data, evaluating multiple dimensions of price action simultaneously:
Momentum Normalization: Utilizes relative strength metrics, centered and scaled, to gauge underlying momentum bias without relying on absolute thresholds.
Directional Strength: Analyzes directional movement indices to quantify the strength of the current trajectory, applying directional penalties when negative movement overpowers positive movement.
Moving Average Distances: Measures the current price relative to fast and slow moving averages, standardizing the distance using the Average True Range to identify structural overextension.
Rate of Change Standardization: Normalizes the rate of change against its own rolling standard deviation to detect statistical anomalies in speed and acceleration.
Standard Deviation Extremes: Evaluates the position of the price relative to upper and lower Bollinger Bands, calculating the precise percentile of the close within the volatility envelope.
Volatility Stability: Compares short-term volatility against long-term volatility baselines to measure market stress and detect rapid expansions.
Volume Anomalies: Assesses current volume against its simple moving average, clamping the result to identify participation spikes that validate price movement.
Price Action Consistency: Calculates the ratio of bullish to bearish closes within the defined lookback period, serving as a raw footprint of buyer versus seller control.
● The Confidence Score Assembly
These standardized features are separated into distinct sub-components. A Directional Score identifies the probable path of the trend by weighting momentum and moving average slopes. A Quality Score measures the structural integrity of that trend by analyzing volume participation and volatility stability. These are mathematically combined to produce a Raw Confidence value. This raw output undergoes an adaptive smoothing process using a dynamic moving average, resulting in a highly stable, final Confidence Score bounded precisely between 0% and 100%.
● Adaptive Ratcheting Bands
The calculated Confidence Score directly influences the width of the trend bands. When the confidence is high, the internal multiplier decreases, tightening the bands closer to the price action to capture shifts quickly and protect accumulated distance. Conversely, when confidence is low, the bands expand to avoid noise and erratic whipsaws. The bands utilize a state-machine logic that only ratchets in the direction of the trend, acting as a trailing threshold that reacts to both price crosses and sudden regime shifts identified by extreme volatility spikes.
🎨 Visual Guide
● Heatmap Candles
The indicator actively repaints the chart candles based on a calculated mathematical "stress" metric.
Colors transition dynamically from a baseline trend color (Deep Sky Blue for bullish conditions, Radical Red for bearish conditions) to a bright orange "Regime Alert" color when underlying volatility spikes significantly.
Candle body opacity is heavily controlled by the alignment of the price action with the overall trend direction, fading to a darker tone during contrary movements or low-confidence pullbacks.
● ML Supertrend Band
Displayed as a prominent, solid line representing the adaptive trailing threshold on the chart.
This band is colored Deep Sky Blue during bullish market phases and Radical Red during bearish phases, updating in real-time as the state machine ratchets.
● Confidence Gradient Cloud
This visual element fills the spatial gap between the median price baseline and the trailing Supertrend band.
The exact opacity and gradient of this cloud are mapped directly to the Confidence Score. A highly opaque, solid cloud represents high confidence, while a highly transparent, fading cloud visually indicates low confidence and potential market transition.
● Visual Labels
Small directional visual markers appear directly above or below the price action when a trend flip occurs.
These labels display an arrow alongside a precise percentage value, representing the exact calculated Confidence Score at the moment the signal was generated.
● Info Table
Located statically in the top right corner, this dashboard displays crucial real-time internal metrics.
It includes the current trend direction, a visual text-based progress bar for the Confidence Score, the live Adaptive Multiplier value adjusting in real-time, the selected Model configuration, and a dynamic text alert that triggers during active Regime Shifts.
📖 How to Use
● Trend Identification
Observe the dominant color of the ML Supertrend Band and the Confidence Gradient Cloud. Deep Sky Blue strongly indicates a bullish environment, while Radical Red suggests a bearish environment. The visibility and thickness of the cloud serve as your primary visual gauge of the trend's structural health.
● Interpreting the Confidence Metric
Monitor the Confidence Score inside the Info Table or at signal generation. A high percentage (e.g., above 70%) suggests that multiple underlying market factors (volume, momentum, standard deviation) are in full agreement with the current directional bias. A rapidly dropping confidence score often precedes a period of choppy consolidation or warns of a potential reversal, allowing for tighter risk parameters.
● Reading Heatmap Candles for Shifts
When the standard colored candles begin transitioning toward the bright orange Regime Alert color, it indicates an abnormal spike in volatility combined with a directional momentum shift. This visually warns the user of a potential "Regime Shift" where the market is undergoing severe internal stress. These specific visual cues often signal an impending breakout from a range or a violent capitulation event.
⚙️ Inputs and Settings
● Model Configuration
Strategic Cycle Mode: Allows the choice between an "Auto" mode and a "Custom" mode. Auto mode dynamically selects the most mathematically optimal lookback lengths, thresholds, and weighting coefficients based purely on the current timeframe in seconds.
Strategic Cycle: When in custom mode, this determines the core lookback period for all volatility and momentum calculations. Smaller values drastically increase reactivity, while larger values provide smoother, long-term macroeconomic analysis.
Macro Trend Threshold: Sets the baseline mathematical width of the threshold bands. Higher values require significantly larger price movements to trigger a trend flip, reducing noise.
Prediction Weight: Controls the internal sensitivity of the bands to rapid changes in the Confidence Score, determining how aggressively the bands compress.
● Visual Settings & Colors
Dedicated toggles are provided to enable or disable the Confidence Labels, the Info Table, and the Heatmap Candles to keep the chart interface as clean as desired.
All core graphical colors, including the specific bands, gradient clouds, table text, and alert highlights, are fully customizable by the user via hex selection.
● Webhook Settings
The indicator is pre-configured to output detailed, formatted JSON payloads designed for external execution automation.
Users can securely define specific action strings for entering and closing both long and short positions directly within the settings menu, mapping exactly to their webhook parser logic.
🔍 Deconstruction of the Underlying Scientific and Academic Framework
● Multi-Variate Feature Standardization
The mathematical foundation of this tool relies heavily on statistical normalization techniques designed to process heterogeneous data. Financial time series data is notoriously non-stationary and spans vastly different numerical scales. To effectively combine disparate metrics like Volume (often measured in millions) and relative strength oscillators (strictly bounded between 0 and 100), the indicator employs rigorous Min-Max scaling and localized Z-score approximations. For instance, the rate of change is evaluated against its own rolling standard deviation over a defined period, successfully standardizing the momentum readout into a continuous, comparable spectrum bounded cleanly between -1.0 and 1.0.
● Linear Weighted Ensembles
The internal architecture utilizes a deterministic linear weighted model to synthesize the final output. By assigning highly specific fractional coefficients to directional features (like the exponential moving average slope and relative strength) and structural features (like Bollinger Band width extremes and volatility stability), the script constructs a singular composite index. This mirrors standard ensemble methodologies found in data science, where the consensus of multiple independent weak learners generates a stronger, more reliable predictive metric than any single indicator could achieve in isolation.
● Volatility-Adjusted State Machines
The adaptive threshold logic operates as a strict finite-state machine incorporating the Average True Range metric. The specific mathematical innovation lies in rendering the ATR multiplier as an inverse linear function of the composite confidence index. In quantitative terms, this produces a dynamically dampened volatility envelope. When the composite index approaches a maximum value indicating high convergence, the dampening factor aggressively compresses the envelope, mathematically acknowledging that high-conviction trends exhibit less erratic mean-reversion behavior and therefore require drastically tighter invalidation levels to preserve structural alpha.
⚠️ Disclaimer
All provided scripts and indicators are strictly for educational exploration and must not be interpreted as financial advice or a recommendation to execute trades. I expressly disclaim all liability for any financial losses or damages that may result, directly or indirectly, from the reliance on or application of these tools. Market participation carries inherent risk where past performance never guarantees future returns, leaving all investment decisions and due diligence solely at your own discretion. Indikator

GS Univsersal## GS Universal — Trading System Indicator
**GS Universal** is a clean, multi-layer TradingView indicator designed to help traders read market structure, trend quality, momentum, volatility, and signal strength in one organized chart system.
The goal of GS Universal is not to overload the chart with too many indicators, but to combine the most important trading conditions into a clear visual decision framework. It is built for traders who want a structured way to identify possible buy zones, warning areas, exit signals, and trend continuation setups.
---
## Core Purpose
GS Universal helps traders answer five key questions:
1. **Is the stock trending or ranging?**
2. **Is momentum improving or weakening?**
3. **Is volume supporting the move?**
4. **Is price extended or still healthy?**
5. **Is the signal strong enough to act on, wait, or avoid?**
---
## Main Features
* **Buy / Warning / Exit signal system**
* **A/B/C signal grading for easier decision-making**
* **EMA trend structure and EMA crossover logic**
* **Bollinger Bands for volatility and extension reading**
* **RSI momentum and overextension filter**
* **MACD momentum confirmation**
* **Volume and relative volume participation filter**
* **ATR-based risk and volatility awareness**
* **Dynamic trailing stop guidance**
* **Dashboard summary for quick interpretation**
* **Beginner / Professional terminology switch**
* **Clean chart layout with controlled labels**
---
## Signal Logic
GS Universal evaluates price using multiple confirmation layers:
### Trend Structure
The indicator checks whether price is above or below key moving averages and whether the short-term trend is aligned with the broader structure.
### Momentum
RSI and MACD are used to measure whether the move has strength, acceleration, or early weakness.
### Volume Confirmation
Volume and relative volume help confirm whether buyers are truly participating in the move or whether the signal is weak.
### Volatility and Extension
Bollinger Bands and ATR help identify whether price is expanding from compression, becoming overextended, or entering a risky zone.
### Signal Quality
Signals are graded to make interpretation easier:
* **A Signal** = Stronger setup with better alignment
* **B Signal** = Acceptable setup but needs caution
* **C Signal** = Weak or early signal, usually requires confirmation
---
## How to Use
GS Universal is designed as a decision-support tool.
A trader can use it to:
* Identify potential entry zones
* Confirm whether a breakout has strength
* Monitor whether an existing trade is still healthy
* Spot warning signs before momentum fails
* Use trailing stop guidance for trade management
* Avoid chasing overextended moves
The indicator works best when combined with support and resistance, market context, risk management, and personal trading rules.
---
## Important Notes
GS Universal is not a guaranteed buy or sell system.
It is an analytical framework that organizes trend, momentum, volume, and volatility conditions into clearer visual signals.
All signals should be used with proper risk management. Traders should always define their entry, stop-loss, position size, and exit plan before taking any trade.
---
## Disclaimer
This indicator is provided for educational and informational purposes only. It does not provide financial advice, investment recommendations, or guaranteed trading results. Trading involves risk, and users are responsible for their own trading decisions.
Indikator

Indikator

Acrofins - Momentum ScannerAcrofins - Momentum Scanner for Nifty and Index Traders
This is a multi-factor momentum scanner built specifically for index trading on Nifty 50, Bank Nifty, and similar instruments. It combines 10 independent technical conditions into a single composite score, and only generates a Buy or Sell signal when enough of those conditions align at the same time. The goal is simple: fewer signals, but each one backed by strong confluence across price, volume, trend, and market structure.
1. How the scoring works
Every bar on the chart is evaluated against 10 conditions. Each condition contributes 1 point to either the bull score or the bear score, except for a price breakout which contributes 2 points because it is historically the strongest signal. The maximum possible score is 11. You can set a minimum threshold in the settings (default is 5), and a signal is only generated when the score crosses that threshold. This means the indicator waits for multiple conditions to agree before calling a trade.
The 10 conditions are:
i. Price Breakout (2 points): Price closes above the highest high of the last 20 bars for a buy, or below the lowest low for a sell. This is the foundation of the signal.
ii. Directional Volume Spike: Volume is above 1.5x its 20-bar average AND the candle closes in the direction of the trade. This filters out volume spikes that occur on opposing candles, which most volume indicators ignore.
iii. RSI Zone (current timeframe): RSI is above 55 for bulls or below 45 for bears. Unlike a crossover, this is a persistent zone check so it does not fire and disappear in a single bar.
iv.RSI 1-Hour Confluence: The 1-hour RSI is checked simultaneously. If the higher timeframe RSI agrees with the signal direction, it adds a point. This is a simple multi-timeframe filter that prevents entering a short-term trade that is running against the larger trend.
v.Engulfing Candle Pattern: A classic bullish or bearish engulfing pattern on the signal bar adds a point for pattern confirmation.
vi. Candle Body Strength: The candle body must be at least 60% of the 10-bar average body size. This filters out doji and indecision candles so the entry bar itself shows conviction.
vii.DMI Direction (DI+ vs DI-): If the positive directional index is stronger than the negative, it adds a bull point and vice versa. This checks who is winning the tug of war between buyers and sellers.
viii. ADX Strength Bonus: If the ADX reading is above 25, an extra point is added. This rewards signals that appear during strong trending conditions.
ix. VWAP Bias: Price above the session VWAP adds a bull point, below adds a bear point. VWAP is the benchmark that institutional desks use as a reference during the day, so being on the right side of it matters.
x. Camarilla Proximity: If price is near a Camarilla support level (L3 or L4) it adds a bull point. Near resistance (H3 or H4) adds a bear point. These levels are calculated from the previous day's high, low, and close, and they act as natural reaction zones that many professional traders watch.
2. Regime gates (hard filters)
Two conditions must both be true before any signal can fire, regardless of the score. First, ADX must be above 20, which blocks all signals in flat and ranging markets. Second, the Bollinger Band width must not be in a squeeze, meaning the bands are not contracting relative to their 50-bar average. These gates exist because most false signals in momentum trading occur during consolidation phases.
3. EMA direction filter
There is an optional EMA-50 direction filter that can be toggled on or off. When active, buy signals can only fire when price is above the EMA-50, and sell signals can only fire when price is below it. This prevents counter-trend entries. On the chart you will see two EMA lines: the yellow EMA-20 which moves close to price and shows short-term direction, and the colored EMA-50 which turns green above and red below to show the overall trend.
4. Trade management
Once a signal fires, the indicator automatically calculates three levels based on the current ATR (Average True Range), which makes the levels adapt to the actual volatility of the instrument at that moment rather than using fixed percentages. The Stop Loss is set at 1.5x ATR below the entry for longs, above for shorts. The Take Profit is set at 3x ATR, giving a natural 1:2 risk-reward ratio. The Trailing Stop starts at 2x ATR but does not activate immediately. It only switches on after the trade has moved at least 1 ATR in your favour, which gives the trade room to breathe before the trail kicks in. Once active, it ratchets in your direction and never moves against you. After any exit, whether by stop loss, take profit, or trailing stop, the indicator enforces a cooldown of 5 bars before a new signal can be generated. This is the core fix that prevents the rapid signal repetition that many momentum indicators suffer from.
5. What you see on the chart
A large green BUY label below the bar and a large red SELL label above the bar are the primary action signals. An orange X mark appears when a trade is closed.
The blue dashed horizontal line is the entry price. The red solid line is the stop loss. The green solid line is the take profit. The orange dotted line is the trailing stop, which moves upward for longs as the trade progresses. The aqua VWAP line with faded bands shows where price stands relative to the session's volume-weighted average. The green and red dotted Camarilla levels (L3, L4, H3, H4) are the previous day's key support and resistance zones and remain fixed throughout the trading day. The background shading gives a quick read on market state. A faint green tint means price is above the EMA-50 and only buy signals are allowed. A faint red tint means price is below and only sell signals are allowed. When you are actively in a trade, the tint becomes brighter to confirm the open position.
6. The information table (top right)
The table shows the live status of every component in one place. Position, entry price, stop loss, take profit, and trailing stop are shown when a trade is open. Below that you can read the EMA trend direction, ADX value and strength rating, Bollinger Band regime status, India VIX with its 52-week IV rank percentile, RSI on both the current timeframe and the 1-hour, VWAP bias, Camarilla proximity, current bull and bear scores, and the indicator status which shows whether it is ready to trade, waiting out a cooldown, or paused due to a ranging market.
7. Settings you can adjust
All major parameters are grouped in the settings panel. You can change the EMA periods, the minimum score required to trade, the cooldown length, the ATR multipliers for stop loss, take profit and trailing stop, the ADX thresholds, the RSI zones, the volume spike multiplier, and the Bollinger Band period. Each group is labelled clearly so you can find what you need quickly. The indicator also comes with five built-in alerts covering buy entry, sell entry, long exit, short exit, and squeeze detection.
8. A note on India VIX
The India VIX data feed requires an NSE data subscription on TradingView. If it shows N/A in the table, this is a data access issue at the platform level and does not affect any of the signals. Indikator

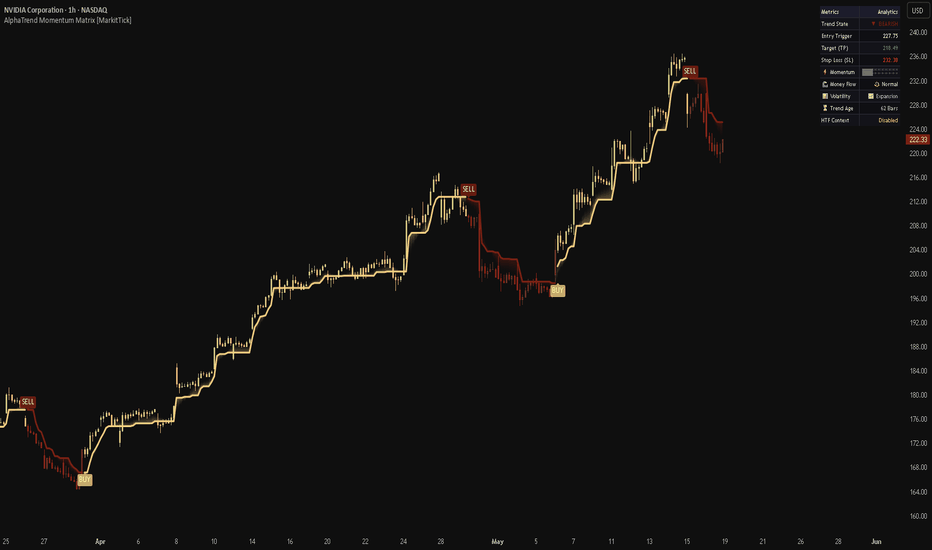
AlphaTrend Momentum Matrix [MarkitTick]💡 The AlphaTrend Momentum Matrix is an advanced, comprehensive trend-following architecture designed to dynamically track market momentum, manage dynamic trade states, and seamlessly bridge the gap between technical charting and automated execution. Far from a simple overlay, this script acts as a multi-layered analytical suite. It evaluates primary trend direction using volatility and volume-weighted money flow, filters out market noise with a custom state-matrix, and projects actionable higher-timeframe data onto the active chart. Furthermore, it incorporates an internal mathematical framework capable of dynamically calculating strict risk-to-reward targets and dispatching meticulously formatted JSON payloads for external webhook execution.
✨ Originality and Utility
● The Momentum Matrix Advantage
While traditional trend indicators rigidly lock onto moving averages or standard price bands, the AlphaTrend Momentum Matrix thrives on market dynamism. Its true utility lies in its multifaceted approach to trend validation. It introduces an exclusive "ATR Breakout Override" system—a custom logic module that forces a trend recalibration if an explosive price movement severely disrupts the standard deviation envelope, regardless of standard trailing conditions. This ensures the indicator remains highly responsive to sudden, high-impact market events without waiting for lagging conditions to catch up.
● Automated Payload and State Management
A standout feature of this tool is its embedded Trade State system. It does not merely paint a signal on the chart; it internalizes the exact entry price, computes a precise stop-loss based on the active AlphaTrend baseline, and mathematically projects a 1:2 risk-to-reward Take Profit target. This localized tracking seamlessly interfaces with the built-in Alert Engine, dynamically injecting these critical metrics into formatted JSON templates ready for third-party automated execution systems.
🔬 Methodology and Concepts
● AlphaTrend Core Engine
The primary directional engine relies on the interplay between the Average True Range (ATR) and the Money Flow Index (MFI). A trailing upper band (Support) and lower band (Resistance) are calculated using a user-defined ATR coefficient. The script interrogates the 14-period MFI; if the MFI reads above 50, indicating positive money flow momentum, the algorithm biases toward the Support band, updating it only when the price makes higher lows. Conversely, an MFI below 50 shifts the bias to the Resistance band.
● Breakout Override Protocol
To counteract the inherent lag of volume-weighted smoothing, the indicator employs a momentum breakout scanner. By measuring the absolute distance between the previous two closing prices and comparing it against the prior ATR multiplied by a sensitivity factor, the script can definitively detect volatility shocks. If a shock occurs concurrently with a directional price cross over the active AlphaTrend line, the system immediately forces a directional shift, bypassing the standard MFI requirements.
● Signal Filtering and Matrix Constraints
Raw signal crossovers are notoriously noisy during consolidation. To mitigate whipsaw trades, this script implements a continuous loop counter (the K and O matrices). It tracks the consecutive bars since the last primary buy or sell condition. A signal is only declared "valid" if it successfully breaks the historical sequence of the opposing trend counter, ensuring that localized micro-fluctuations do not trigger premature trade entries.
🔍 Deconstruction of the Underlying Scientific and Academic Framework
● Volatility and the Average True Range
Developed by J. Welles Wilder Jr. in 1978, the Average True Range is a foundational pillar of this indicator. The ATR scientifically quantifies absolute market volatility by decomposing the entire range of an asset's periodic price action, factoring in gaps and limit moves. By applying a multiplier to the ATR, this script establishes a statistically significant standard deviation envelope, distinguishing between normal market "breathing" and definitive structural shifts.
● Volume-Weighted Momentum via Money Flow Index
The MFI, created by Gene Quigley and Colin Dysart, represents an evolution of the Relative Strength Index (RSI). From an academic standpoint, the MFI incorporates volume into its momentum calculation, producing a more robust metric of buying and selling pressure. It uses the Typical Price (High + Low + Close / 3) multiplied by volume to calculate raw money flow. The 50-level threshold serves as the equilibrium point; sustaining above this level empirically signifies net accumulation, providing the mathematical justification for the indicator's bullish bias.
● Algorithmic State Machines
The signal filtering mechanism and the internal Trade State tracker are practical applications of Finite State Machines (FSM) commonly used in quantitative algorithmic design. The script holds memory of its current operational state (Long, Short, Neutral) and refuses state transitions unless specifically validated mathematical conditions (boolean logic gates) are met, significantly reducing error rates inherent in purely reactive, memory-less indicators.
● Repainting and Lookahead Warning
This script utilizes the request component to pull Higher Timeframe (HTF) context into the primary chart. Crucially, it employs the barmerge.lookahead_on parameter. While this creates a visually perfect, non-lagging representation of higher timeframe trends when analyzing historical data, it introduces lookahead bias. Traders must understand that historical HTF visuals and signals may appear with perfect precision on past bars, but real-time execution will lack this future data context, potentially resulting in different localized behavior in live markets.
🎨 Visual Guide
● The AlphaTrend Trailing Line
Up Trend (Bullish): A bold, solid step-line tracking below the price, rendered in a distinctive golden-yellow (#F0D080).
Down Trend (Bearish): A bold, solid step-line tracking above the price, colored in a deep crimson (#7A2010).
● The Cloud Fill
Dynamic Channel: A semi-transparent shaded area connecting the active AlphaTrend line to a central Cloud Reference Line (a smoothing of the typical price). This cloud visually represents the buffer zone of the current trend.
Color Coding: The cloud dynamically changes color to match the dominant trend (Gold for bullish, Crimson for bearish), allowing for rapid peripheral analysis of market conditions.
● Price Action Overrides
Colored Candles: The bodies and wicks of the actual price candles are uniformly colored to reflect the AlphaTrend matrix state, instantly identifying periods of alignment or divergence.
● Execution Elements
Signal Labels: Distinct "BUY" and "SELL" textual shapes appear precisely on the chart at the moment the state matrix validates a trend shift.
HTF Stepline: When enabled, a secondary, smoothed step-line appears to show the overarching macro trend, colored accordingly to dictate the broader market regime.
📖 How to Use
● Trend Riding and Context
The most effective way to utilize this tool is to align the primary chart timeframe with the HTF AlphaTrend line. If the HTF line is Gold, you should strictly look for "BUY" signals generated by the primary indicator to trade in the direction of the macro trend, ignoring temporary bearish signals as minor pullbacks.
● Momentum Breakout Confirmation
When you observe a sudden color change accompanied by an unusually large price bar, this is often the Breakout Override triggering. These scenarios represent high-momentum events. Instead of waiting for a retest, aggressive traders may use these specific signals to capture immediate volatility expansions, placing their stop-loss strictly on the opposite side of the newly formed AlphaTrend line.
● Automating Your Strategy
For quantitative traders, the indicator handles the heavy lifting of trade logic. Ensure you configure the exact JSON payload strings required by your third-party execution platform (like 3Commas, PineConnector, etc.) in the settings. The indicator will autonomously calculate your risk/reward parameters upon every valid signal and fire a perfectly formatted JSON alert.
⚙️ Inputs and Settings
• ⚙️ Core Calculations
ATR Multiplier: Defines the sensitivity of the trailing line. Lower values (e.g., 0.5) track price closely for scalping; higher values (e.g., 2.0) provide wide breathing room for swing trades.
ATR & MFI Lookback Period: The standard window (default 14) for calculating both volatility and volume momentum.
Display Signals: Toggles the visibility of the "BUY" and "SELL" chart labels.
• 🛡️ Breakout Override
Enable ATR Breakout Override: Turns the momentum-shock detection system on or off.
Breakout Sensitivity: Determines how large a price jump must be (relative to the ATR) to force a trend change. Lower values trigger more aggressively.
• 🕐 Higher Timeframe
Show HTF AlphaTrend: Projects the higher timeframe data onto the current chart.
HTF Timeframe: The specific macro timeframe to monitor (e.g., Daily "D" when trading on the 1-Hour chart).
• ☁️ Cloud Fill
Show Cloud Fill: Toggles the visual buffer zone on the chart.
Cloud Reference Length: Adjusts the smoothing period of the central reference line.
Color Candles: Enables or disables the overriding of standard chart candle colors based on trend direction.
• 🔌 Webhook Execution Config
Payload Actions: Four distinct text fields where you can define the exact syntax your external bot requires for entering longs, entering shorts, closing longs, and closing shorts. These values are automatically injected into the dynamic JSON alert string.
⚠️ Disclaimer
All provided scripts and indicators are strictly for educational exploration and must not be interpreted as financial advice or a recommendation to execute trades. I expressly disclaim all liability for any financial losses or damages that may result, directly or indirectly, from the reliance on or application of these tools. Market participation carries inherent risk where past performance never guarantees future returns, leaving all investment decisions and due diligence solely at your own discretion. Indikator
$crooge's - A.R.C. [Final]Overview
The A.R.C. Master (Adaptive Ratchet Channel) is a comprehensive trend-following and risk management engine designed for traders who demand precision across different asset classes. Unlike static indicators that fail when volatility spikes, the A.R.C. Master uses a dynamic "Ratchet" logic that recalibrates in real-time based on the specific Character of the asset you are trading.
Whether you are scalping NASDAQ:SNDK on the 1-minute chart or swing trading the S&P 500, this script provides a clear, institutional-grade "line in the sand" for every trade.
Key Features
1. ⏱️ Modular Strategy Horizons
No more changing settings every time you switch timeframes. The A.R.C. Master features four hard-coded modes that automatically adjust the engine’s sensitivity:
SCALP MODE (1m-2m): Ultra-tight tracking for momentum bursts.
INTRADAY MODE (5m-15m): Balanced smoothing for the "daily grind."
SWING MODE (1h-4h): Filters out intraday noise to capture multi-day trends.
TREND MODE (Daily): Focuses on major structural market shifts.
2. 💎 Asset Character Calibration
Different assets breathe differently. This script includes 10 pre-tuned presets to match the unique volatility profiles of:
INDICES: SPY, QQQ, SPX (Uses close for structural stability).
CHIPS / SEMIS: NASDAQ:SNDK , NASDAQ:NVDA , NASDAQ:MU (Optimized for high-velocity gaps).
EV SECTOR: NASDAQ:TSLA , NASDAQ:RIVN (Handles aggressive retail sentiment).
CRYPTO / BTC: Optimized for 24/7 high-beta volatility.
Also includes: Energy, Growth, Leveraged 3x, Forex, Retail, and Biotech.
3. 🏦 Institutional Volume Detection
Stop guessing where "Big Money" is entering. The script monitors volume relative to a 20-period average:
White Bar (Inst. Buy): High-volume absorption at support.
Orange Bar (Inst. Sell): Heavy distribution at resistance.
Visuals can be toggled on/off to keep your charts clean.
4. ⚙️ The "Zero-Reset" Override (New)
For specialized tickers or extreme market events, you can manually override the Volume Threshold or Scalar sensitivity.
The Power of Zero: Simply set the override to 0 to instantly revert to the optimized sector presets.
How to Use the A.R.C. Master
The Entry: Look for the Ratchet Line to flip Cyan (Bullish). Entry is highest conviction when a White Institutional Bar appears right as the price touches the Ratchet Line.
The Hold: As long as the price stays above the Cyan line, the trend is intact. The "Ratchet" will move up with the price, locking in unrealized gains.
The Exit: A candle close below the Ratchet Line (turning the line Pink) is a signal of a structural trend break. Exit or flip bias immediately.
Technical Breakdown
Core Engine: Adaptive ATR-based volatility buffer combined with dual-EMA smoothing.
Source Logic: Intelligently switches between hlcc4 (for volatile sectors) and close (for indices) to ensure you aren't stopped out by rogue wicks.
Disclaimer: Trading involves significant risk. The A.R.C. Master is a tool to assist in decision-making and does not guarantee profits. Use proper stop-losses and risk management at all times. Indikator

Pan Sniper Hybrid V12.7.6 CompleteTitle: Pan Sniper Hybrid V12.8 - Multi-Strategy SMC & Volumetric Signals
Description:
Pan Sniper Hybrid V12.8 is a comprehensive trading tool designed for professional scalpers and day traders. It combines Market Structure Analysis (SMC), Volumetric Delta Analysis, and FX Market Sessions into a single, high-performance indicator.
This script is optimized for lower timeframes (1m, 5m, 15m) to identify high-probability reversal and trend-following setups.
Key Features:
Automatic Market Structure: Real-time labeling of HH, HL, LL, LH to help you identify trend shifts and institutional order flow.
Volumetric Delta Signals: Includes Bull (🐂) and Bear (🐻) signals based on real-time Volume Delta calculations from lower timeframe data.
Shark SFP (Swing Failure Pattern): The Shark (🦈) signal identifies liquidity sweeps at key structural highs and lows—perfect for catching sharp reversals.
AMD Session Boxes: Automatically plots Asia, London, and New York sessions with visual boxes (Accumulation, Manipulation, Distribution) to help you trade session highs and lows.
Dynamic Fibo Zones: Features upper and lower Fibonacci-based bands to identify overextended price levels (Overbought/Oversold).
Gaussian Trend Filter: A smooth trend-following baseline that changes color based on market momentum.
How to use:
For Scalping (1m/5m): Increase the Shark % and Pivot Lookback in settings to filter out minor price noise.
Trend Confirmation: Look for Bull/Bear signals that align with the Gaussian Filter color.
Session Trading: Use the Opening Range (Yellow/Pink lines) as a breakout or mean-reversion boundary during major market opens.
Settings Highlights:
Signal Sensitivity: Fully customizable thresholds for Bull, Bear, and Shark signals to match your risk appetite.
MACD Customization: Adjustable Fast/Slow lengths to fine-tune signal entry timing.
Disclaimer: This indicator is for educational and analytical purposes only. It does not constitute financial advice. Past performance does not guarantee future results. Indikator

GS Signal Indicator Final## GS Signal Indicator — Beginner Description
* **GS Signal Indicator** helps you know when a stock is ready, still active, risky, or invalidated.
* It is best used on the **30-minute** and **1-hour** charts.
* The indicator combines trend, momentum, volume, candle strength, and risk into simple signals.
* The system now uses simple signal names:
```text
A = strongest setup
B = main buy setup
```
---
## Main Signals
* **A**
Strongest signal. Best-quality setup.
* **B**
Main buy signal. Structure and timing are both aligned.
* **A↑**
The stock was already in a trade and later upgraded to **A**.
This is usually a confirmation/hold signal, not automatically a new entry.
* **Warn**
Risk is increasing. Be careful, tighten risk, or monitor the trade.
* **Exit**
Exit or avoid. The setup is invalidated.
---
## Screener Status
* **Top A + 1H**
Best condition. 30m has **A** and 1H supports it.
* **Top B + 1H**
Strong condition. 30m has **B** and 1H supports it.
* **30m Only**
30m has **A** or **B**, but 1H is not supporting yet.
* **1H Only**
1H has **A** or **B**, but 30m is not ready yet.
* **Active**
An old **A/B** signal is still valid because no **Warn** or **Exit** appeared after it.
* **Warn**
A warning appeared after the last **A/B** signal. Do not chase.
* **Exit**
An exit appeared after the last **A/B** signal. Ignore the old signal.
The screener version you uploaded is designed to detect actionable states, keep old A/B-type signals visible while no later risk or exit appears, and mark risk/exit status after the last signal.
---
## How to Use It
* Use **30m** for entry timing.
* Use **1H** for confirmation.
* Focus mainly on:
```text
A = strongest setup
B = main buy setup
```
* Best alerts:
```text
Top A + 1H
Top B + 1H
```
* If status is **Active**, the old signal may still be valid, but do not chase if price is already far from the signal area.
* If status is **Warn**, avoid new buying unless a fresh **A** or **B** appears later.
* If status is **Exit**, the old setup is no longer valid.
---
## Simple Trading Rule
```text
Buy / Focus: A or B
Best Quality: Top A + 1H or Top B + 1H
Still Review: Active
Be Careful: Warn
Avoid / Exit: Exit
```
---
## Best Settings
* **Timeframe:** 30m or 1H
* **Display Mode:** Clean
* **Show Dashboard:** ON
* **Show Entry / Stop / Targets:** ON
* **Confirm Candle Close:** ON
Disclaimer
* This indicator is for education and analysis only.
* It does not guarantee profits.
* Always use proper risk management.
Indikator

RSI Predictive DivergenceRSI Predictive Divergence — Forming Divergence Detector
OVERVIEW
This indicator detects RSI divergences in two stages: a forming stage (early warning) and a confirmed stage (classic pivot-based). The forming stage is the unique component — it uses linear regression slope analysis to identify divergence conditions building up in real time, before a pivot is confirmed.
HOW IT WORKS
1. Slope Calculation
The indicator computes linear regression slopes for both RSI and price over a user-defined lookback period (default 5 bars). The price slope is ATR-normalized so that the comparison works consistently across different instruments and timeframes.
2. Slope Angles
Both slopes are converted to angles in degrees using the arctangent function. This gives a normalized way to compare RSI direction against price direction.
3. Opposition Counter
A counter tracks how many consecutive closed bars show opposing slopes (price down + RSI up = potential bullish divergence; price up + RSI down = potential bearish divergence). When the counter reaches the user-defined threshold (default 5 bars), a forming divergence is flagged.
4. Strength Score (0-100)
A composite score is calculated using three factors:
- Angle difference between RSI and price slopes (50% weight)
- Duration of slope opposition (30% weight)
- RSI zone context — oversold/overbought adds weight (20% weight)
Users can set a minimum strength threshold to filter low-quality signals.
5. Confirmed Divergence
Classic pivot-based divergence detection runs in parallel using RSI pivot highs and lows compared against price pivots. An anti-overlap gate prevents same-type labels from clustering too closely (default 8 bars minimum spacing).
NON-REPAINTING DESIGN
- All slope counters update only on confirmed bars (barstate.isconfirmed)
- Forming signals trigger only after bar close
- Confirmed divergence labels are drawn at the pivot bar, naturally
lagging by the pivot lookback period
- No lookahead_on, no future data access
INPUTS
- RSI Length, Source, Overbought/Oversold levels
- Slope lookback bars and minimum opposite-slope bars
- Minimum strength threshold for forming signals
- Pivot lookback for confirmed divergence
- Anti-overlap spacing between confirmed labels
- Label style: Compact, Icon Only, or Full
- Dashboard position, size, and compact/full mode
- Color customization for bullish, bearish, forming, and neutral states
DASHBOARD
A status table shows RSI value, RSI zone, slope angle difference, and live forming-divergence status with strength meters for both directions. Two display modes: Compact (7 rows) for minimal footprint or Full (10 rows) with detailed slope angles.
ALERTS
Four alert conditions available:
- Forming Bullish Divergence
- Forming Bearish Divergence
- Confirmed Bullish Divergence
- Confirmed Bearish Divergence
HOW TO USE
Forming divergences are early-warning signals — they indicate that divergence conditions are building. Wait for higher strength readings (60+) before acting, and combine with price-action context such as support/resistance, trend, and volume. Confirmed divergences provide
classical pivot-based signals after pivot formation. This indicator works across all timeframes.
NOTES
This is a technical analysis tool intended for educational and informational purposes. Past performance of any divergence signal does not guarantee future results. Always apply proper risk management and combine with your own trading methodology.
CREDITS
Original implementation. Uses standard RSI and pivot logic from TradingView's built-in functions combined with original slope-angle analysis methodology. Indikator

Trend Maturity Ladder [AGPro Series]Trend Maturity Ladder
🧠 Core Idea
Is the trend still early, healthy, mature, stretched, or vulnerable to exhaustion?
📌 Overview / What it does
Trend Maturity Ladder is a trend lifecycle visualization tool built to classify the stage of an active trend.
The script builds a staged trend ladder, maps a healthy pullback shelf, marks an invalidation shelf, tracks maturity score, evaluates extension, identifies exhaustion risk, and summarizes the current lifecycle state in an AG Pro panel.
It does not predict price direction, automate trades, or claim that a mature trend must reverse. It is a structured decision-support tool for reading trend stage, pullback quality, and late-trend risk.
🎯 Purpose & Design Philosophy
Many trend tools answer only one question:
Is price trending?
This script was built to answer a more useful question:
Where is the trend in its lifecycle?
The design goal is to help traders separate early trend development, healthy continuation, mature structure, stretched extension, and invalidation pressure.
⚡ Why This Script Is Different
Most trend tools focus on moving average direction, ribbon color, or generic trend strength.
This script does NOT act as another trend-strength meter or moving-average ribbon.
Instead, it models the trend as a ladder with stages: early trend, active trend, mature trend, stretched trend, exhaustion watch, and invalidation pressure. It combines trend alignment, slope, ADX, distance from the slow trend reference, trend age, pullback depth, and momentum risk into one visual lifecycle map.
⚙️ Methodology
1. Context Detection
The script checks fast, slow, and anchor trend alignment to determine whether the market has a bullish trend, bearish trend, or mixed structure.
2. Maturity Scoring
It scores trend age, ATR-adjusted extension, slope, ADX, and moving-average alignment to estimate how mature the trend is.
3. Pullback Evaluation
It builds a healthy pullback shelf around the trend references and checks whether price is pulling back without breaking the broader ladder.
4. Exhaustion and Invalidation Review
It identifies late-trend extension risk and invalidation pressure when price closes through the trend shelf.
5. Visual Output
The chart displays maturity ladder zones, pullback shelves, invalidation shelves, trend rails, event labels, right-side tags, alerts, and a compact AG Pro panel.
🗺️ How to Read the Chart
Trend Maturity Ladder = the active lifecycle zone around the current trend.
Healthy Pullback Shelf = the area where pullbacks can remain structurally constructive.
Invalidation Shelf = the area where the trend ladder becomes vulnerable.
Trend Rails = fast, slow, and anchor trend references.
EARLY TREND = trend alignment is fresh.
ACTIVE TREND = trend structure is aligned and still developing.
MATURE TREND = trend has aged and expanded meaningfully.
STRETCHED TREND = the trend is extended relative to its slow reference.
EXHAUSTION WATCH = maturity, extension, and momentum conditions suggest late-trend risk.
INVALIDATION PRESSURE = price has closed through the invalidation shelf.
Panel = summarizes trend stage, maturity score, direction, pullback health, exhaustion risk, age, extension, and next context.
🚦 Signals & States
• EARLY TREND → trend alignment is fresh and still developing.
• ACTIVE TREND → trend is aligned and not yet deeply mature.
• MATURE TREND → trend has aged and expanded.
• STRETCHED TREND → price is extended from the slow trend reference.
• HEALTHY PULLBACK → price has pulled into the trend shelf without invalidating it.
• EXHAUSTION RISK → maturity, extension, and momentum risk are aligned.
• INVALIDATION PRESSURE → price has closed through the invalidation shelf.
• NO CLEAR TREND → fast, slow, and anchor references are not aligned.
🔔 Alerts Logic
Alerts trigger when a major trend lifecycle state appears.
• Trend Maturity Transition → the active trend stage changes.
• Healthy Trend Pullback → price pulls into the healthy trend shelf without invalidating the ladder.
• Trend Exhaustion Risk → maturity, extension, and momentum conditions align.
• Trend Invalidation Pressure → price closes through the invalidation shelf.
Alerts are attention markers, not trade instructions.
🧩 Confluence Logic
The context becomes stronger when:
• Fast, slow, and anchor trend references align
• The slow reference has directional slope
• ADX supports directional structure
• Pullbacks respect the healthy shelf
• Extension is not excessively stretched
• The panel state agrees with the chart label
Late-trend caution increases when maturity, extension, and RSI pressure align.
📊 When to Use
• Trend-following review
• Pullback continuation planning
• Late-trend risk monitoring
• Crypto, stocks, futures, forex, and liquid markets
• 30m, 1H, 4H, 1D, and 1W charts
• Markets where trend structure is visible
⚠️ When NOT to Use
• Very choppy, non-directional markets
• Low-liquidity assets
• Extremely noisy micro timeframes
• Markets with frequent gaps that distort trend references
• Situations where a single trend score should not be over-interpreted
• When the user wants guaranteed entries or exits
🎛️ Key Inputs
• Fast Trend Length → controls short-term trend pressure.
• Slow Trend Length → controls the main maturity reference.
• Anchor Trend Length → filters weak or mixed trend regimes.
• ATR Length → controls ladder spacing, extension scoring, and label offsets.
• Early Trend Max Age → defines how long a fresh trend can remain early.
• Mature Trend Age → defines when age contributes strongly to maturity.
• Stretched Distance ATR → defines when trend extension becomes stretched.
• Healthy Pullback Width ATR → controls the pullback shelf thickness.
• Invalidation Shelf ATR → controls the distance of the invalidation shelf.
• Exhaustion RSI Level → adds momentum pressure to exhaustion-risk logic.
🖥️ Interface & Visual Design
The visual hierarchy is built around the trend lifecycle:
The ladder shows the active maturity zone.
The pullback shelf shows where continuation can be evaluated.
The invalidation shelf shows where the trend becomes vulnerable.
Event labels mark lifecycle transitions and risk states.
Right-side tags keep the current trend stage visible.
The AG Pro panel compresses the current trend lifecycle into a fast, readable summary.
🧪 Practical Usage Workflow
1. Read the panel trend stage.
2. Check whether trend direction is aligned.
3. Locate the healthy pullback shelf.
4. Watch whether price respects or breaks the shelf.
5. Check maturity score and exhaustion risk.
6. Confirm with market structure, liquidity, volume, and risk planning.
🔍 Interpretation Guidelines
An early trend does not guarantee continuation.
A mature trend does not guarantee reversal.
Exhaustion risk does not mean price must immediately turn.
Invalidation pressure means the current ladder structure has weakened.
The script is best used to understand trend lifecycle context, not to replace independent analysis.
🚫 What This Script Is NOT
This script is not a prediction engine.
It is not financial advice.
It is not an auto-trading system.
It does not provide guaranteed entry or exit signals.
It is not a moving-average ribbon or a simple trend-strength meter.
⚠️ Limitations & Transparency
Trend stages depend on timeframe.
Choppy markets can create frequent stage changes.
Strong news moves can stretch trend references quickly.
Low-liquidity markets may create unreliable trend readings.
Different assets may require different trend lengths.
🧠 Market Context Notes
Trends often move through recognizable phases:
alignment → expansion → maturity → extension → pullback or invalidation.
This script visualizes that sequence so the user can avoid treating every trend as equally fresh.
🧾 Use Case Examples
If trend references align shortly after a transition, the script may classify EARLY TREND.
If price pulls into the shelf while the ladder remains intact, the script may mark HEALTHY PULLBACK.
If the trend becomes aged and extended while RSI is stretched, the script may mark EXHAUSTION RISK.
If price closes through the invalidation shelf, the script may mark INVALIDATION PRESSURE.
🧱 System Philosophy
The goal is not to chase trend strength.
The goal is to understand trend timing.
This script treats trend as a lifecycle:
early → active → mature → stretched → vulnerable.
🔐 Non-Promise Statement
No trend stage guarantees future price direction.
No pullback shelf guarantees continuation.
No exhaustion label guarantees reversal.
All outputs should be interpreted as analytical context.
📉 Risk Disclosure
Trading involves risk.
This script is for educational and analytical purposes only.
It does not provide financial advice, investment advice, or guaranteed trading outcomes.
Users are fully responsible for their own decisions, risk management, and trade execution.
📚 Educational Note
Use the script to study where trends tend to age, stretch, reset, or fail.
The most important question is not only whether a market is trending.
The better question is whether the trend is still fresh enough to deserve attention.
Indikator

AI SMC Pro v2AI SMC Order Flow Pro v2.0 is an advanced Smart Money Concepts indicator combining ICT methodology, multi-timeframe analysis, Bayesian AI scoring, and order flow estimation — all in a single non-repainting overlay.
Core Features:
BOS & CHoCH structure detection
Bullish & Bearish Order Blocks (auto-invalidation)
Fair Value Gaps (auto-fill detection)
Liquidity levels (LQH / LQL)
Premium & Discount zones
Session High/Low (Asia, London, New York)
Support & Resistance (50-bar dynamic)
AI Engine:
Bayesian confidence score (0–100%) combining trend, momentum, MACD, volume, structure, order flow, MTF bias, session and zone
Three modes: Conservative / Balanced / Aggressive
Order Flow Module:
Estimated buy/sell pressure
Estimated delta & cumulative delta
Volume spike detection
Signals:
LONG / SHORT entries with SL, TP1, TP2
ATR-based risk management (customizable multipliers)
Minimum R:R filter (1:2 / 1:3 / 1:4)
Session filter (London & New York only)
MTF confirmation required
Built-in Backtest:
Win rate, Profit Factor, Expectancy
Max win/loss streak
Trailing stop & Break-even options
Best used on: EUR/USD · GBP/USD · 15m timeframe during London or New York session. Indikator

Indikator
Indikator
Indikator

Indikator
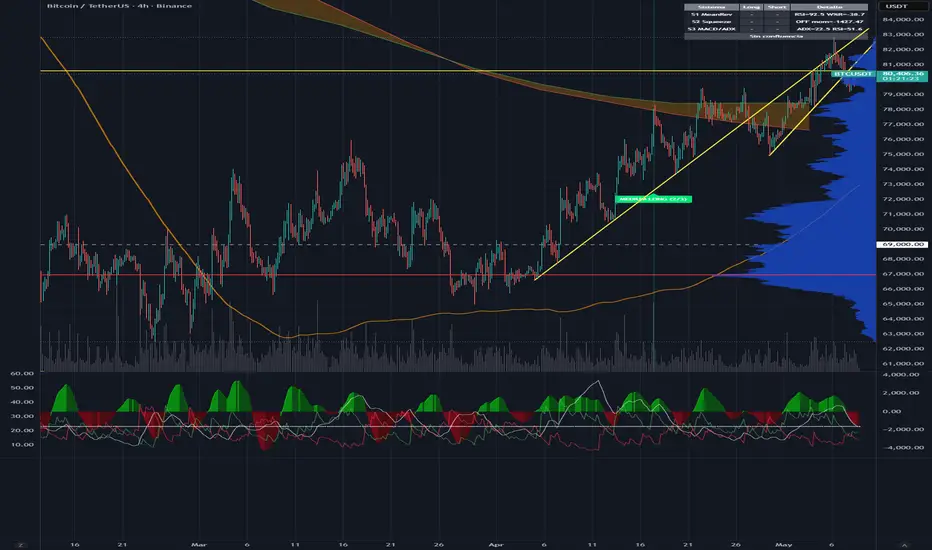
Multi-System (RSI2 + Squeeze + MACD/ADX)Confluence Multi-System combines three independent, well-documented signal frameworks into a single overlay and only fires alerts when two or more agree on direction. The goal is to filter noise: each system has its own logic and failure mode, so coincidence between them is statistically rarer and historically higher quality than any individual signal.
THE THREE SYSTEMS
System 1 — Mean Reversion (RSI-2 + Williams %R + 200 SMA)
Larry Connors-style countertrend setup. Trades only in the direction of the 200 SMA trend filter, requires RSI(2) at an extreme (<5 long, >95 short) and Williams %R(10) confirming (<-90 long, >-10 short). Designed for pullbacks within a trend, not reversals against it.
System 2 — TTM Squeeze
Classic John Carter volatility compression setup. Detects when Bollinger Bands(20, 2.0) contract inside Keltner Channels(20, 1.5) — a "squeeze" — then signals on the release in the direction of a linear-regression momentum oscillator. Catches breakouts after consolidation.
System 3 — Triple Confirmation (MACD + RSI + ADX)
Trend-following filter stack. Long requires MACD(12,26,9) bullish cross + RSI(14) > 50 + ADX(14) > 25. Short is the mirror. ADX gates out chop; RSI confirms the cross is in the dominant momentum side.
CONFLUENCE LOGIC
The indicator counts how many systems are signaling in the same direction on the same bar:
• 3/3 → STRONG signal (background tinted, label printed, dedicated alert)
• 2/3 → MEDIUM signal (lighter tint, dedicated alert)
• <2 → no signal, no alert
The minimum number of systems required can be configured (default 2). You can also disable any system individually if you want to test 2-of-2 confluence on specific pairs.
WHAT YOU SEE ON THE CHART
• Background tint on confluence bars (green/red strong, lime/fuchsia medium)
• Labels marking the bar where confluence first appears
• 200 SMA plotted as visual reference for the System 1 trend filter
• A status table (top-right) showing for each system: long/short state, key indicator values (RSI, Williams %R, ADX, squeeze state, momentum), plus a summary row with the current confluence level
ALERTS
Six alertconditions are exposed:
• STRONG LONG (3/3) / STRONG SHORT (3/3)
• MEDIUM LONG (2/3) / MEDIUM SHORT (2/3)
• ANY CONFLUENCE LONG / ANY CONFLUENCE SHORT (respect the configured minimum)
Alerts include ticker, interval, and close price via standard TradingView placeholders.
INPUTS
All three systems are fully parametrized: SMA length, RSI/Williams %R lengths and thresholds, Bollinger and Keltner lengths and multipliers, MACD periods, ADX length and minimum strength. Defaults match the original published values for each framework.
USE CASES
• Day trading on lower timeframes — wait for 2/3 or 3/3 to enter, exit on opposite confluence or your own stop
• Swing trading on 1H/4H/Daily — confluence becomes rare but high quality
• As a confirmation layer over your own strategy — read the table to see which systems agree before pulling the trigger
NOTES AND DISCLAIMERS
This is an indicator, not a strategy — it does not place orders, manage stops, or compute P&L. Win-rate ranges referenced for each underlying system come from the original literature (Connors, Carter, Wilder/Appel) and are heavily dependent on instrument, timeframe, and exit logic. Past performance does not guarantee future results. Always backtest with your own exit rules before trading live.
Open source — fork it, adapt the thresholds, plug in your own systems. Indikator

Indikator