Tectonic Regime Protocol [JOAT]Tectonic Regime Protocol
Introduction
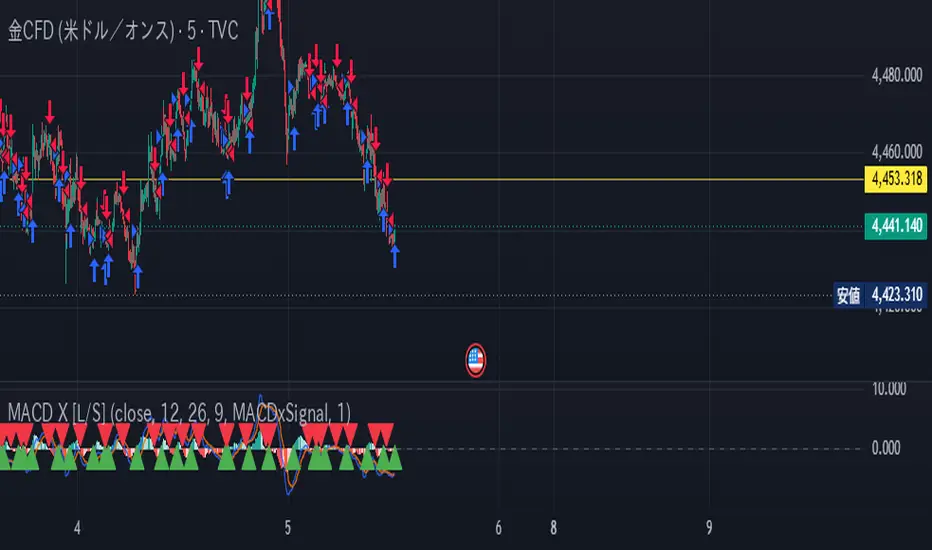
Tectonic Regime Protocol is an open-source Pine Script v6 strategy that combines four analytical modules into a single rule-based trading system: a four-state regime classifier, a three-layer trend filter, a six-pillar confluence entry engine, and an adaptive exit module using ATR-based partial take-profit and a regime-adaptive trailing stop.
The strategy is designed for traders who want a fully automated systematic framework to study how regime-gating affects signal quality. Its primary hypothesis is that directional entries made when (1) the market is classified as a trending regime, (2) trend filters across multiple timeframes align, and (3) multiple structural, volume, and momentum inputs agree, produce statistically better outcomes than entries based on any single condition alone.
Strategy Default Properties
Initial capital: $100,000
Order size: 2% of equity per trade
Commission: 0.04% per side
Slippage: 2 ticks
Maximum open positions: 1
These settings represent realistic conditions for a funded discretionary trader using a liquid futures or equity instrument. The 2% equity sizing limits maximum theoretical drawdown from any single trade while providing meaningful position exposure. Commission and slippage values reflect typical institutional-grade execution costs for electronically traded instruments.
Core Concepts
1. Four-State Regime Classifier
The regime module classifies each bar into one of four states using ADX relative to a threshold and the ATR-to-SMA(ATR) ratio: Trend Bull, Trend Bear, Range High-Vol, Range Low-Vol. Only Trend states are eligible for entry. Range classifications suppress all entries regardless of how strong the confluence score is. This is the primary market context filter.
2. Three-Layer Trend Filter
Three independently computed trend conditions must all agree before a long or short entry is considered: close versus VWMA(200) determines whether price is above or below long-term value; the relationship between fast and slow HMA lines determines medium-term momentum direction; and the close versus a 50-period EMA on a higher timeframe provides multi-timeframe context.
3. Six-Pillar Confluence Score
The entry engine scores six market dimensions and requires the composite bull or bear score to exceed 50 of 100 (default, configurable) with a directional lead of at least 8 points above the opposing score. The six pillars are: market structure, OBV slope direction, KAMA position + RSI + WPR composite, swing-low liquidity sweep detection, ATR ratio in productive range, and Fractal Efficiency Ratio above 0.30.
bool longSetup = validRegime and regime == 1 and trendBull
and bull >= confThreshold and (bull - bear) >= confGap
and barstate.isconfirmed
4. Adaptive Exit Module
The exit logic uses partial exits at two take-profit levels. TP1 closes 50% of the position at 1.0× risk distance. TP2 closes the remaining position at 2.0× risk distance. After TP1 is reached, the stop is moved to the entry price (breakeven). The stop before TP1 uses a regime-adaptive ATR trail — the stop multiplier is lower in low-volatility regimes (tighter) and higher in high-volatility regimes (looser). A 30-bar time-based exit closes any remaining position if neither TP nor stop is reached.
5. Non-Repainting Architecture
All entry conditions are evaluated only when barstate.isconfirmed is true. The HTF EMA is requested with lookahead=barmerge.lookahead_off. Pivot-based conditions use confirmed pivot detection with symmetric lookback. No future bar references are used.
Default Settings and Performance Notes
The strategy is published with the default Properties values listed above. Results shown on the publication chart are generated using these exact settings. Commission of 0.04% per side is representative of typical electronic execution on liquid instruments.
Win rate alone does not characterize strategy performance. The strategy is designed around a two-tier partial exit structure targeting positive expectancy (wins × average win greater than losses × average loss) rather than high win rate. The profit factor and average R-multiple are the more relevant metrics for this type of system.
Input Parameters
Regime Module:
ADX Trend Threshold (default: 20)
ATR Ratio High-Vol Threshold (default: 1.2)
Trend Filter:
VWMA Length (default: 200)
Ribbon Fast HMA and Slow HMA lengths
HTF Timeframe for EMA(50) filter (default: 240)
Enable HTF Filter toggle
Confluence Engine:
Min Score (default: 50, range 50–95)
Min Direction Lead (default: 8)
Min FER (default: 0.30)
FER Lookback (default: 14)
Individual pillar weights (Structure, Volume, Momentum, Liquidity, Volatility, FER)
Exit Module:
TP1 RR Multiple (default: 1.0)
TP2 RR Multiple (default: 2.0)
Stop Multiplier for Low / Med / High Volatility Regimes
Max Bars Hold (default: 30)
How to Evaluate This Strategy
Apply it to a liquid instrument with sufficient historical data to generate more than 100 trades. Compare profit factor, Sharpe ratio, average R-multiple, and maximum drawdown — not win rate in isolation. Test it across at least two different instruments or timeframes to assess whether the results reflect genuine structural edge or data-fitting to one specific market.
The strategy is not optimized for any single market. Default parameters are deliberately conservative to avoid overfitting. Users who adjust parameters to improve backtested results should recognize that improvement on historical data does not guarantee improvement on future data.
Strategy Limitations
On lower-timeframe charts with short histories, fewer than 100 trades may result, reducing the statistical reliability of the backtest
The HTF filter uses request.security() with a higher timeframe EMA. In live trading, the HTF value updates when the higher timeframe bar closes, which may differ slightly from live server-side execution
ATR-based stops and targets mean position sizes and outcomes scale with volatility. In abnormally low-volatility environments, commission costs represent a larger proportion of expected gain
The time-based exit at 30 bars may close profitable positions before TP2 is reached in slow-moving markets
Backtested performance on any instrument does not predict future performance. Markets change, and parameters that produced edge historically may not do so in future regimes
Originality Statement
Combining a four-state regime classifier, a three-layer multi-timeframe trend filter, a six-pillar confluence score including Fractal Efficiency Ratio, and a partial-exit adaptive trailing stop system in a single non-repainting open-source strategy is an original integration of methods
The Fractal Efficiency Ratio as a pillar in a multi-factor entry score, and as a required gate condition for entry, is not present in existing open-source Pine Script v6 strategy publications as of this writing
The regime-adaptive stop multiplier — loosening in high-volatility regimes and tightening in low-volatility regimes — is an original stop calibration approach within this strategic framework
The dual entry mode (edge transition OR re-entry when flat with elevated score) increases signal frequency without compromising the fundamental regime and trend filter requirements
Disclaimer
This strategy is provided for educational and informational purposes only. It is not financial advice or a recommendation to buy or sell any financial instrument. Backtested results are simulated and do not represent real trading. Simulated results have inherent limitations and may not reflect actual trading outcomes due to market impact, execution differences, and changing market conditions. Past backtested performance does not guarantee future results. Trading involves substantial risk of loss. Always conduct independent due diligence and apply proper risk management before using any strategy with real capital. The author accepts no responsibility for trading losses resulting from use of this strategy.
Made with passion by jackofalltrades
Strategi

Indikator

Indikator

QQE Trend Strategy [Long/Short]QQE Trend Strategy
A dual-band QQE (Quantitative Qualitative Estimation) strategy built on Pine Script v6.
Two independently tuned QQE bands — Fast and Slow — provide both responsive and filtered trend signals, with an optional 50-line direction filter and percentage-based stop loss.
━━━━━━━━━━━━━━━━━━━━━━━
🔹 HOW IT WORKS
━━━━━━━━━━━━━━━━━━━━━━━
QQE transforms RSI into a smoothed oscillator, then applies a double-EMA ATR trailing band to detect trend reversals.
When the QQE line crosses its trailing band:
- Bullish crossover → Buy signal
- Bearish crossover → Sell signal
Two band systems run in parallel:
- Fast Band (lower factor) — more responsive, earlier signals
- Slow Band (higher factor) — smoother, fewer false signals
Select which band drives your entries via the Signal Band setting.
━━━━━━━━━━━━━━━━━━━━━━━
🔹 FEATURES
━━━━━━━━━━━━━━━━━━━━━━━
- Dual QQE Bands (Fast + Slow)
→ Both plotted simultaneously for confluence analysis.
- 50-Line Direction Filter (optional)
→ When ON: Long entries only above 50, Short entries only below 50.
→ Helps eliminate counter-trend trades in strong trending conditions.
- Trade Direction control
→ Both / Long Only / Short Only
- Stop Loss (optional, percentage-based)
→ Calculated from average entry price.
→ Updated on every bar while in position.
- Display toggles
→ Fast Band, Slow Band, Histogram, Background Color, Bar Color, Signal Markers
→ All independently switchable — use as a standalone indicator or a full strategy.
- Commission & Slippage
→ Defaults: 0.03% commission, 1 tick slippage.
→ Adjustable via Strategy Properties tab without editing the script.
━━━━━━━━━━━━━━━━━━━━━━━
🔹 ALERT CONDITIONS (3 total)
━━━━━━━━━━━━━━━━━━━━━━━
- 🟢 Buy Signal — Bullish QQE trend reversal detected
- 🔴 Sell Signal — Bearish QQE trend reversal detected
- ⚡ Any Signal — Either direction triggered
All alerts include ticker and timeframe: {{ticker}}, {{interval}}
━━━━━━━━━━━━━━━━━━━━━━━
🔹 SETTINGS
━━━━━━━━━━━━━━━━━━━━━━━
- RSI Length : 14 (default)
- Smooth EMA Length : 5 (default)
- Fast Band Factor : 2.618 (default)
- Slow Band Factor : 4.236 (default)
- Signal Band : Slow (default)
- Lot Size : 1.0 (default)
Increase the Band Factor to reduce signal frequency.
Decrease it for more responsive entries on shorter timeframes.
━━━━━━━━━━━━━━━━━━━━━━━
⚠️ DISCLAIMER
━━━━━━━━━━━━━━━━━━━━━━━
This script is for educational and backtesting purposes only.
Past performance does not guarantee future results.
Always apply proper risk management before using any strategy in live markets. Strategi

Strategi

Indikator

Indikator

Strategi

Indikator
Indikator
Indikator

SPY ATR BandsAn all-in-one overlay that combines ATR-based deviation bands, all-time-high levels, and a weekly-EMA trend filter into a single clean tool. Built for swing dip-buying on SPY, but works on any symbol.
Features
• Multi-timeframe ATR bands (D / 4H / 1H) — Keltner-family bands built from an RMA centerline ± ATR × multiplier, with three depths each (narrow ×0.6 / main / wide ×1.5). Because they scale with ATR, a touch of the wide band means a statistically significant move relative to current volatility, not a fixed %. Lines are smoothed between higher-TF updates. Color-coded by TF (D / 4H / 1H), with optional narrow/wide layers.
• Intersection markers — A bubble is dropped at the deepest band touched within each incursion (narrow > main > wide), per timeframe. Instantly shows where price is interacting with each TF's volatility envelope.
• ATH line + pullback levels — Running all-time-high line plus −3 / −4 / −5 / −10 / −15 / −20 / −25% pullback levels (labels only). The ATH label shows price, days since the last ATH, and current trend-leg %. A live "Now" label shows price and exact % distance from the ATH (candle-colored).
• W EMA20 proxy (trend filter) — Approximates the weekly EMA20 on any timeframe (1H/Daily proxies, down to intraday) so you always see the higher-TF trend line. The line turns green when the last daily candle closes above it and red when it closes below — a clean bull/bear read. Includes a tolerance zone, an intersection marker, and an optional interpolation mode for a smooth line down to 5-minute charts.
• Built-in alerts — "Any intersection marker", "Lower-band touch (dip)", and "W EMA20 touch".
How to use
Watch for price tapping a lower band (oversold) while well below the ATH and above the W EMA20 line (trend intact). The deeper the band and the further from the ATH, the higher-conviction the pullback. The W EMA20 color tells you whether the broader regime is bullish or bearish.
Most colors, widths, tolerances and toggles are fully configurable in settings.
Not financial advice — for educational / technical-analysis use. Indikator

Indikator
Indikator

Indikator
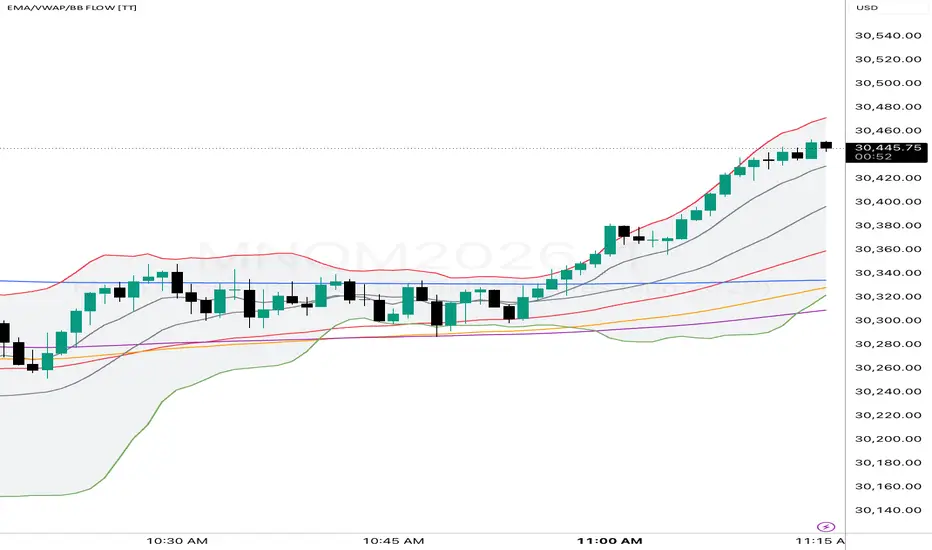
EMA/VWAP/BB FLOW [TT]# EMA/VWAP/BB FLOW
EMA/VWAP/BB FLOW is a streamlined trend and structure tool designed for traders who rely on moving averages, VWAP, and Bollinger Bands without unnecessary clutter.
This indicator combines multiple key EMAs, session VWAP, and customizable Bollinger Bands into a single lightweight package, allowing traders to build their preferred workflow while keeping charts clean and organized.
### Features
• 11 Exponential Moving Averages:
* EMA 5
* EMA 9
* EMA 14
* EMA 21
* EMA 30
* EMA 40
* EMA 50
* EMA 60
* EMA 100
* EMA 200
* EMA 800
• Fully customizable colors and line widths for every EMA
• Session VWAP
* VWAP only (no deviation bands)
* Adjustable color and line width
• Bollinger Bands
* Custom length and multiplier
* Independent colors for upper, middle, and lower bands
* Optional shaded fill between bands
* Adjustable line widths and shading color
### Default Layout
Enabled by default:
* EMA 9 (Gray)
* EMA 50 (Red)
* EMA 100 (Orange)
* EMA 200 (Purple)
Disabled by default:
* EMA 5
* EMA 14
* EMA 21
* EMA 30
* EMA 40
* EMA 60
* EMA 800
* VWAP
* Bollinger Bands
Bollinger Band defaults:
* Upper Band = Red
* Basis = Gray
* Lower Band = Green
### Designed For
EMA/VWAP/BB FLOW was built for futures, stocks, forex, and crypto traders who want quick access to key trend references while maintaining complete control over chart appearance.
Simple. Fast. Clean.
Indikator

Hitesh Nimje 2026To publish your indicator on TradingView, you need a clear, professional description that explains the features to potential users. Since your script is a powerful "All-in-One" suite, here is a template you can use.
Title Idea
Hitesh Nimje | Combined Trading Suite (EMA Bundle + Sessions + MTF Levels)
Description Template
Description:
This all-in-one trading tool combines essential trend-following indicators and market structure analysis to provide a clean, clutter-free workspace. Designed for intraday and swing traders, this suite eliminates the need for multiple indicators by merging three core functionalities into one.
Key Features:
TMT EMA Bundle: Includes 10 customizable Exponential Moving Averages (EMA 9, 11, 15, 21, 50, 51, 55, 100, 200, 400). You can toggle these on/off to suit your specific strategy.
MTF Highs/Lows & S/R: Automatically plots vital support and resistance levels from higher timeframes (Daily, Weekly, Monthly) and identifies All-Time Highs/Lows (ATH/ATL).
Market Session Tracking: Monitors four distinct trading sessions (A, B, C, D) with options for trendlines, VWAP, and range boxes to help you identify market volatility throughout the day.
Advanced Dashboard: A centralized, dynamic table that shows real-time session status, market bias, and volume analysis. The "Advanced" mode provides deep data on buyer/seller volume and delta.
Trend Context: Features a built-in EMA Trend monitor that helps you quickly gauge if the current price is trading above or below the 200 EMA.
How to use:
Add the indicator to your chart.
Open the "Settings" menu to toggle your preferred EMAs (9, 21, and 200 are enabled by default).
Use the Dashboard to track session activity and EMA trends at a glance.
Adjust the "Dashboard Location" and "Size" to fit your layout.
Settings:
Defaults: EMA 9, 21, and 200 are enabled by default for a clean trend-following approach.
Advanced Mode: Toggle the Advanced Dashboard for detailed volume/delta metrics. Indikator

Session Volume Moving Average [LuxAlgo]The Session Volume Moving Average indicator is a comprehensive volume analysis tool that plots volume bars directly on a moving average, providing a unique perspective on volume activity in relation to price trends.
It features session-specific volume profiling, streak detection, and a dynamic volume delta system to visualize market participation and institutional activity.
🔶 USAGE
The script serves as a multi-dimensional volume dashboard, allowing users to see not just the amount of volume, but also where it occurs within a price trend and who (buyers or sellers) is currently in control.
🔹 Moving Average Volume Bars
Traditional volume bars at the bottom of the chart can be difficult to relate to price action. This indicator plots volume bars anchored to a customizable moving average. Each bar's height is normalized using the 95th percentile of volume over a lookback period, ensuring that extreme outliers do not squash the rest of the data, providing a clearer view of relative volume changes.
🔹 Session Delta Bar & Candle Coloring
At the top of the active session, a gradient bar displays the cumulative volume delta (Bullish vs. Bearish volume percentage).
A pointer moves across the gradient to show the current balance.
The colors transition from your Bearish color to a Neutral color (at 50%), then to your Bullish color.
Users can enable the "Color Candles By Delta" setting to apply this same gradient to the chart candles, providing an immediate visual cue of session dominance.
🔹 Volume Profile & Streaks
The indicator automatically tracks trading sessions (New York, London, Tokyo, Sydney) and provides additional context:
A Volume Profile is drawn at the end of each session to highlight high-activity price levels.
Volume Streaks are highlighted with dashed boxes when volume increases or decreases for a consecutive number of bars, signaling building momentum or exhaustion.
🔶 DETAILS
🔹 Normalization Logic
To keep the volume bars visually consistent, the script scales their height relative to the Average True Range (ATR). By using the 95th percentile for normalization, the script ignores the top 5% of extreme spikes, which typically cause standard volume indicators to look flat and unreadable.
🔹 Delta Calculation
The delta is calculated by comparing bullish volume (volume on green candles) against total volume within the specific session. The gradient sensitivity is tuned to show significant color shifts between 35% and 65% delta, making it easier to spot shifts in control before they reach extremes.
🔶 SETTINGS
🔹 Moving Average Settings
Length: The lookback period for the moving average calculation.
Type: The type of MA to use (SMA, EMA, WMA, HMA, etc.).
Source: The price source for the MA calculation.
🔹 Session Settings
Past Sessions to Show: Controls how many historical session boxes and profiles remain on the chart.
Session 1-4: Toggles for specific global trading sessions with customizable times and time zones.
🔹 Volume Bar Settings
Height Multiplier: Adjusts the vertical scale of the volume bars on the MA.
Normalization Lookback: The period used to determine the 95th percentile volume.
Consecutive Trend Bars: The number of bars required to trigger a volume streak highlight.
Significant Vol Multiplier: Filters streaks so only high-volume sequences are highlighted.
🔹 Style & Volume Profile
Color Candles By Delta: Enables/disables the gradient candle coloring based on session volume.
Show Volume Profile: Toggles the session-end volume distribution histogram.
VP Bins: Controls the granularity of the Volume Profile.
Show Session Delta Bar: Toggles the gradient meter at the top of the session.
Indikator

EMA Horizon█ OVERVIEW
The EMA Horizon indicator offers a modern, structural upgrade to the classic Exponential Moving Average. While standard EMAs are indispensable tools for trend identification, they inherently suffer from "live candle blindness" —flickering wildly on the current unclosed bar and causing traders to miss critical intraday touches or fall into false breakout traps.
EMA Horizon solves this by calculating an immediate forward-looking volatility corridor based on the asset's actual physical extremes (High/Low), anchored tightly to its closing history. It provides an unchanging, reliable boundary range for the current candle asset space, allowing traders to see exactly where the EMA would be pushed under extreme conditions.
---
█ THE PROBLEM WITH STANDARD EMAs
A standard EMA updates continuously based on the live ticking close . During highly volatile periods, the indicator line bends and flexes dramatically inside the current bar. This real-time distortion creates two major issues:
The Flicker Trap: Price can spike out of an EMA zone and snap back before the candle closes, leaving no historical trace of the breach and causing missed execution opportunities.
Lagging Boundaries: Standard bands (like envelopes or Keltner channels) look backward at historical averages. They fail to tell you how a single massive, aggressive live expansion bar will mathematically impact the underlying moving average trend line right now.
---
█ THE SOLUTION & MECHANICAL EDGE
EMA Horizon does not simply calculate an EMA of all Highs or all Lows (which smoothly degrades accuracy over time). Instead, it preserves the integrity of pure historical closing prices up to the immediate moment.
From that clean historical baseline, it executes a "one-off" look-ahead calculation: it processes the current candle's High and Low as if they were the immediate next closing prices .
The High Band shows the ultimate ceiling the EMA could reach on the next step.
The Low Band shows the absolute floor the EMA could drop to on the next step.
By utilizing the built-in Bands Offset parameter, you can shift this entire calculation forward across your timeline. When shifted, the boundaries sitting under your live candle are locked—derived entirely from the previous candle's completed structure. This eliminates real-time repainting and gives you an unshakeable roadmap for price interaction.
---
█ FEATURES
Pure History Anchoring: The base EMA line relies strictly on closing prices, ensuring your core trend logic remains untainted by extreme wicks.
Next-Bar Step Simulation: Dynamically maps out the mathematical limits of the moving average based on immediate price expansion boundaries.
Global Visual Alignment: The script features a unique global offset parameter that shifts both the baseline EMA and its projection bands uniformly. This completely avoids visual distortion and allows you to perfectly map historical structures without losing physical perspective.
---
█ HOW TO USE
Add to Chart: Search for "EMA Horizon" in your TradingView indicator panel and apply it.
Configure your Length: Adjust the Length input to match your primary trend tracking asset class (e.g., 9 for short-term momentum, 21 or 50 for structural trends).
Set your Offset Look:
Set Bands Offset to 0 to observe the real-time maximum range expansion matching the current candle's high/low.
Set Bands Offset to 1 to push the indicator one bar to the right. This allows you to track how the current live asset price responds to the locked, unchangeable projection generated by the previous closed bar.
Identify True Deviations: Watch for instances where a candle aggressively drives through the green horizon cloud. If the asset price slices cleanly past the projected bands, it indicates an exhaustion phase or an institutional velocity breakout that goes beyond standard mathematical trend boundaries.
Indikator

Indikator

Indikator

ID004 VIX Fear Timing IndicatorA volatility-aware staged dip-recovery indicator designed to help traders study pullback recovery conditions using price action, staged DCA logic, higher-timeframe context, and VIX fear timing.
---------------------------------------------------------------------------------------------------
## 1. What this indicator is for 🧭
---------------------------------------------------------------------------------------------------
This indicator is designed to help traders study possible recovery zones after a meaningful market pullback. It does not try to buy every dip or react to every red candle. Instead, it waits for a more structured recovery setup where price has already dropped, then begins to show signs that downside pressure may be weakening.
The main idea is to help the user avoid random dip-buying. A market can look cheap and still continue falling. For that reason, the indicator checks price recovery behavior, market structure, and VIX fear conditions before showing staged labels.
The goal is not to catch the exact bottom. The goal is to identify structured recovery attempts after fear, weakness, or volatility stress has already appeared.
This indicator should be used as a decision-support tool. It does not replace your own analysis, risk management, or trade plan.
---------------------------------------------------------------------------------------------------
## 2. What the labels mean 🏷️
---------------------------------------------------------------------------------------------------
The indicator shows three staged recovery labels on the chart:
Buy : the first recovery stage after price has made a meaningful pullback.
DCA1 : the first deeper recovery stage after a Buy label has already appeared.
DCA2 : the final deeper recovery stage after Buy and DCA1 have already appeared.
These labels are not automatic trade instructions. They are visual signals for chart review. A label means the script found a specific recovery condition, but it does not mean the trade is guaranteed to work.
The DCA stages are not random extra buy signals. They belong to one structured sequence. DCA1 only matters after Buy. DCA2 only matters after Buy and DCA1.
Read the labels as staged recovery information, not as a complete trading system.
---------------------------------------------------------------------------------------------------
## 3. Simple workflow for using it ✅
---------------------------------------------------------------------------------------------------
A practical way to use the indicator:
Start with the default settings.
Use standard candlestick or OHLC charts.
Wait for a Buy label before thinking about DCA1 or DCA2.
Use DCA1 only if it appears after Buy and still fits your risk plan.
Use DCA2 only if it appears after Buy and DCA1, especially when VIX fear has started to cool.
Use alerts as reminders to review the chart, not as automatic trade commands.
Check trend, support, resistance, volume, liquidity, earnings, news, macro events, and broader market risk before acting.
This tool is usually easier to interpret on cleaner timeframes such as 1 hour, 4 hours, or 1 day. Very short timeframes can create more noise, especially during fast selloffs.
Before using staged entries, decide your maximum exposure, invalidation level, stop logic, profit-taking plan, and exit conditions.
---------------------------------------------------------------------------------------------------
## 4. How to read VIX fear timing 🌡️
---------------------------------------------------------------------------------------------------
VIX is used as a market fear and volatility filter. The indicator does not only ask whether price has dropped. It also asks whether fear is elevated and whether fear may be starting to cool.
A high VIX condition does not automatically mean price will recover. It only means fear or volatility stress is elevated. Price still needs to show recovery behavior before the script can confirm a staged label.
The VIX logic is different for each stage:
Buy can appear when price recovery and VIX stress conditions are acceptable.
DCA1 needs stricter fear confirmation when the VIX filter is active.
DCA2 is more selective and looks for VIX to have been very high recently, then cool lower.
This helps reduce the risk of adding too early while panic is still expanding.
---------------------------------------------------------------------------------------------------
## 5. Risk notes and correct expectations ⚠️
---------------------------------------------------------------------------------------------------
This indicator is not financial advice and does not guarantee future results. It does not open trades, close trades, manage stops, calculate position size, or decide how much money to risk.
DCA can increase losses if price continues falling. Every staged entry should be planned before the first signal appears. Do not use DCA1 or DCA2 only because a label appears. Use them only if the broader setup still fits your own risk plan.
Important user reminders:
A Buy label is not proof that the bottom is in.
DCA1 and DCA2 increase exposure and risk.
High VIX can mean opportunity, but it can also mean danger.
Alerts are review reminders, not trading instructions.
Synthetic chart types may distort OHLC behavior and can make signals less reliable.
Use the indicator to organize your chart review. Do not use it as a substitute for risk management.
---------------------------------------------------------------------------------------------------
## 6. Script structure and originality
---------------------------------------------------------------------------------------------------
This script is an overlay indicator, not a strategy.
It uses:
* indicator(..., overlay=true)
* plotshape() for Buy, DCA1, and DCA2 labels
* bgcolor() for VIX percentile background
* alertcondition() for monitoring alerts
It does not use:
* strategy.entry()
* strategy.exit()
* strategy.close()
* automated order placement
* position management logic
The originality of the script is in how the components are connected. The script does not simply display RSI, Bollinger Bands, MACD, VIX, and moving averages as separate tools. Instead, those components are used inside a staged recovery framework.
The integration works through:
1. A state machine that controls the sequence.
2. Price-drop requirements before a stage can qualify.
3. Recovery confirmation after weakness appears.
4. Quality scores that combine several technical clues.
5. Higher-timeframe danger filters.
6. Crash filters to avoid fast breakdowns.
7. VIX fear filters that change by stage.
8. Adaptive timing windows for DCA1 and DCA2.
9. Armed-zone logic before DCA confirmation.
10. Reset logic so old stages do not stay active forever.
The state model is central:
state = 0 means no active sequence.
state = 1 means Buy has triggered.
state = 2 means DCA1 has triggered.
state = 3 means DCA2 has triggered.
This is why DCA labels cannot appear randomly. DCA1 requires Buy first. DCA2 requires DCA1 first.
The script stores important stage references:
buyPrice
d1Price
d2Price
buyBar
d1Bar
d2Bar
These values are then used to calculate deeper zones, timing windows, basket average, and reset conditions.
---------------------------------------------------------------------------------------------------
## 7. Buy stage calculation
---------------------------------------------------------------------------------------------------
The Buy stage is the first recovery stage. It requires a meaningful pullback and early recovery evidence.
The script calculates a recent lookback high:
lookbackHigh = ta.highest(high, lookbackBars)
Then it calculates the percentage drop from that high:
dropFromLookbackHighPct = (lookbackHigh - close) / lookbackHigh * 100
The Buy drop threshold is adjusted by the selected Signal preset:
Aggressive = lower required drop
Balanced = default required drop
Conservative = higher required drop
The effective Buy drop is:
effBuyDropPct = buyDropPct * dropMult
The core Buy setup uses:
meaningfulDrop
wasOversold
momentumRecovery
priceRecovery
meaningfulDrop:
Price must fall enough from the recent lookback high.
wasOversold:
The script checks whether RSI was recently weak:
ta.lowest(rsi, 10) < 35
momentumRecovery:
The script checks whether RSI is improving and recovering from weak conditions.
priceRecovery:
The script checks whether price is showing local recovery by closing above the fast EMA or above the previous bar high.
The script also builds a Buy quality score. The score can include:
* meaningful drop
* recent oversold behavior
* RSI improvement
* price recovery
* oversold reclaim
* Bollinger Band reclaim
* support reclaim
* bullish divergence
* strong lower wick
* MACD histogram improvement
* structure shift
* volume confirmation
* strong VIX stress
* rare VIX event
* VIX fear cooling
The final Buy signal requires all major gates:
state == 0
cooldownOk
buyRegimeOk
crashOk
vixBuyOk
buySetup
buyQualityOk
This means Buy is more selective than a simple RSI oversold label. It needs price weakness first, then recovery behavior, then context and quality confirmation.
---------------------------------------------------------------------------------------------------
## 8. DCA1 and DCA2 calculation
---------------------------------------------------------------------------------------------------
DCA1 and DCA2 are staged deeper recovery zones. They depend on previously stored stage prices.
DCA1 uses the Buy price:
d1ZonePct = buyPrice * (1.0 - effD1DropPct / 100.0)
DCA2 uses the DCA1 price:
d2ZonePct = d1Price * (1.0 - effD2DropPct / 100.0)
In this version, the internal drop validation is set to "Percent only", so percentage-based validation is the active method.
DCA1 logic:
DCA1 requires state == 1.
This means Buy must already exist.
DCA1 must happen inside its timing window:
barsSinceBuy >= adaptiveD1Min
barsSinceBuy <= adaptiveD1Max
The DCA1 zone becomes armed when:
* state is 1
* price is below the Buy price
* price reaches the DCA1 zone
* the DCA1 timing window is valid
After the zone is armed, the script waits for a confirmation delay:
d1ConfirmDelay
DCA1 technical confirmation can come from:
B1 = bullish divergence and RSI improvement
B2 = Bollinger Band reclaim plus wick, candle, or MACD improvement
B3 = support reclaim or strong lower wick plus RSI or volume confirmation
Bscore = weighted recovery score
DCA1 also uses VIX score components:
* basic VIX stress
* strong VIX stress
* rare VIX event
* VIX fear cooling
The final DCA1 signal requires:
state == 1
d1Armed
d1ArmedLongEnough
inD1Window
recoveryCandleD1
dcaRegimeOk
crashOk
d1VixOk
d1TechnicalOk
d1QualityOk
DCA2 logic:
DCA2 requires state == 2.
This means Buy and DCA1 must already exist.
DCA2 must happen inside its timing window:
barsSinceD1 >= adaptiveD2Min
barsSinceD1 <= adaptiveD2Max
DCA2 also checks price against basket average:
basketAvg = average of active staged prices
The DCA2 zone becomes armed when:
* state is 2
* price reaches the DCA2 zone
* price is below basket average
* the DCA2 timing window is valid
DCA2 technical confirmation is stricter and can include:
C1 = higher-timeframe RSI or MACD improvement plus local recovery
C2 = capitulation-style volume spike, strong lower wick, and large range
C3 = structure shift plus RSI improvement
Cscore = weighted score using higher-timeframe improvement, capitulation evidence, structure shift, wick rejection, bullish engulfing, volume spike, and higher-timeframe MACD improvement
The final DCA2 signal requires:
state == 2
d2Armed
d2ArmedLongEnough
inD2Window
recoveryCandleD2
dcaRegimeOk
crashOk
d2VixOk
d2TechnicalOk
d2QualityOk
This explains why DCA1 and DCA2 are not only lower-price signals. A zone must be reached first, then recovery evidence must appear before confirmation.
---------------------------------------------------------------------------------------------------
## 9. VIX, timeframe, and regime filters
---------------------------------------------------------------------------------------------------
The script requests VIX data from the selected VIX symbol:
vixSymbol = input.symbol("CBOE:VIX", "VIX symbol")
VIX uses the active chart timeframe:
vixTf = timeframe.period
The VIX function returns:
* VIX close
* VIX percentile
* VIX percentile jump
* whether VIX is falling
* whether VIX percentile is falling
The script builds several VIX conditions:
vixAbsoluteOk:
VIX close is above an internal stress level.
vixHighPercentileOk:
VIX percentile is above the selected stress percentile.
vixJumpOk:
VIX percentile jumped sharply.
vixRareEvent:
VIX percentile or absolute VIX level is extremely high.
vixStressBasic:
Basic fear condition is active.
vixStressStrong:
Stronger fear condition is active.
vixFearCooling:
Fear is elevated and VIX or VIX percentile is falling.
For DCA2, the script uses a special cooling model:
vixRecentPeakPercentile = recent highest VIX percentile
vixWasTooHighRecently = VIX percentile was very high recently
vixCooledFromPeak = VIX percentile cooled by the selected cooling amount
vixCoolingButStillElevated = VIX is still high but falling
DCA2 can pass VIX cooling when:
* VIX cooled enough from a recent high peak
* a rare VIX event is active and fear is cooling
* VIX is still elevated but percentile is falling
The stage-specific VIX design is important:
Buy can use basic VIX stress or fear cooling.
DCA1 requires stricter stress confirmation.
DCA2 requires recent high fear followed by cooling.
The script also adapts to chart profiles:
15 minutes
30 minutes
1 hour
4 hours
1 day
The profile affects:
* price lookback
* VIX lookback
* DCA timing windows
* confirmation delays
* higher-timeframe reference
* crash detection window
Higher-timeframe regime logic checks:
* higher-timeframe close
* higher-timeframe EMA 50
* higher-timeframe EMA 200
* higher-timeframe RSI
* higher-timeframe RSI direction
* higher-timeframe MACD histogram improvement
The danger regime blocks normal recovery signals when higher-timeframe trend and momentum are too weak, unless rare fear and local recovery behavior justify an exception.
The crash filter checks for fast, high-volume selloffs and helps avoid triggering recovery labels during active breakdown pressure.
---------------------------------------------------------------------------------------------------
## 10. Inputs, alerts, background, and resets
---------------------------------------------------------------------------------------------------
The script uses 10 visible inputs to keep the user interface focused:
1. Signal preset
Controls strictness:
Aggressive, Balanced, Conservative
2. Buy drop from recent high %
Controls the minimum pullback before Buy can qualify.
3. DCA1 drop below Buy %
Controls how far price must move below Buy before DCA1 can arm.
4. DCA2 drop below DCA1 %
Controls how far price must move below DCA1 before DCA2 can arm.
5. Rejection wick %
Controls the minimum lower-wick rejection requirement.
6. VIX mode
Off, Conservative, Very Strict
7. VIX symbol
Default VIX source is CBOE:VIX.
8. VIX stress percentile
Main percentile threshold for elevated fear.
9. DCA2 VIX cooling drop
Required cooling from the recent VIX percentile peak.
10. Low VIX color percentile
Defines unusually low VIX percentile conditions.
Hidden internal defaults include:
* RSI length
* fast EMA length
* ATR length
* Bollinger Band length and multiplier
* volume average length
* swing length
* cooldown bars
* profile-based lookbacks
* adaptive timing sample rules
* VIX rare-event thresholds
* VIX background transparency
* reset timing
Alerts:
The script includes seven alert conditions:
1. Buy confirmed
2. DCA1 zone armed
3. DCA1 confirmed
4. DCA2 zone armed
5. DCA2 confirmed
6. VIX cooled after high
7. VIX too low percentile
Alert meaning:
* Armed alerts mean price reached a DCA zone, but confirmation is not complete.
* Confirmed alerts mean the full stage logic is complete.
* VIX alerts describe fear-regime behavior.
Background:
The script calculates high and low VIX percentile background conditions. In the current plotted version, the visible green background marks very high VIX percentile. This means elevated fear or volatility stress, not automatic bullishness.
Reset logic:
The script resets the active sequence when:
* DCA2 has completed and enough bars have passed.
* DCA1 did not appear inside the valid window after Buy.
* DCA2 did not appear inside the valid window after DCA1.
This prevents old signals from staying active forever and helps each staged sequence remain connected to the original recovery setup.
Publication note:
This description is written so users can understand the script without reading Pine code. It explains what the script does, why the components are combined, how the staged logic works, and how traders can use it responsibly.
Open-source transparency note: if any external open-source code, function, or logic was reused, the original author and source should be credited clearly in the publication.
Indikator

Indikator