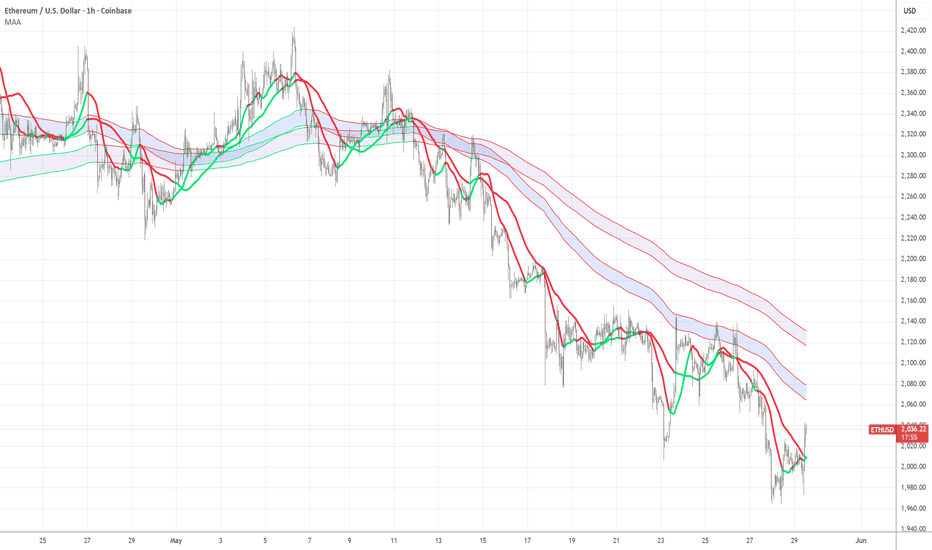
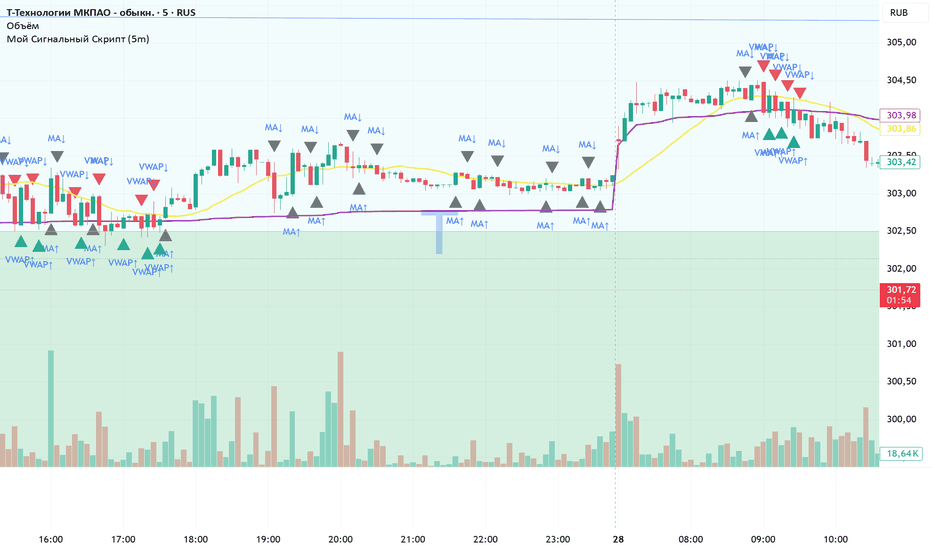
EMA 9 + VWAP Strategy with ATR Trailing Stop - WIN THE TRADEEMA 9 + VWAP Strategy with ATR Trailing Stop
A simple trend-following strategy that combines the power of the 9 EMA , VWAP , and an ATR-based trailing stop for cleaner entries and dynamic trade management.
This strategy is designed for traders who want a straightforward system with minimal discretion and clear buy/sell conditions.
Strategy Logic
Buy Conditions
A long position is opened when the 9 EMA crosses above VWAP.
Sell Conditions
A short position is opened when the 9 EMA crosses below VWAP.
Trade Management
Uses an ATR trailing stop to automatically lock in profits and manage risk. The trailing stop dynamically adjusts based on market volatility.
Features
EMA + VWAP crossover entries
ATR-based trailing stop exits
Visual BUY/SELL labels
Dynamic trailing stop lines plotted on chart
Built-in alerts
Works well for scalping, intraday trading, and trend continuation setups
Best Markets
This strategy can be used on Forex, Gold (XAUUSD), Indices, Crypto, and Stocks.
Recommended Timeframes
Popular timeframes include 1 Minute, 5 Minute, 15 Minute, and 1 Hour.
Lower timeframes generally produce more signals, while higher timeframes can provide cleaner trends.
Inputs
ATR Length controls the ATR calculation period.
ATR Multiplier adjusts the trailing stop distance.
Increasing the ATR multiplier gives trades more room to breathe, while lowering it creates tighter exits.
Alerts
The script includes ready-to-use JSON webhook alerts for automation and bot integrations.
You can connect it to trading bots, Discord alerts, Telegram alerts, trade execution systems, and prop firm automation tools.
Disclaimer
This strategy is for educational purposes only and should not be considered financial advice. Always test and optimize settings before using on a live account.
Strategi

Simple MA TPO
Simple MA TPO
■Description
■Concept & Purpose
This indicator was developed with a single core concept: to discover the "true power" and foster a deeper understanding of the Time Price Opportunity (TPO) profile—often considered a super-tool in market analysis. By combining traditional TPO mechanics with market gravity (Moving Averages), this script aims to provide traders with a clearer, more visual representation of value and price deviation over time.
■Originality & How It Works
While traditional TPO profiles use letters (A, B, C...) to denote time periods and static colors for volume/time areas, this script introduces two highly original mechanics to add value to the community:
Sequential Numbering: Instead of letters, each TPO block is numbered sequentially (1, 2, 3...) based on its formation order. This drastically simplifies reading the flow of time within a session.
MA Deviation Gradient Coloring: The most unique feature is its coloring logic. TPO blocks are not colored randomly. Instead, their color is determined by their deviation from a baseline Moving Average (acting as the market's center of gravity).
■Calculations & Output
To ensure complete transparency in how the visual data is generated, here is the specific calculation used for the block colors:
Formula: Deviation % = ((Price / MA) - 1.0) * 100.0
Why this calculation? This calculates the exact percentage distance between the TPO block's price level and the baseline Moving Average at the time that specific block was formed. It visualizes how "overextended" the market was when time was spent at that price.
Actual Output: The output is a percentage float value (e.g., if the MA is $100 and the block price is $102, the output is 2.0 or 2%). This value is then clamped by the user-defined Max Deviation % input (default 2.0%).
Color Mapping: The clamped percentage is fed into a gradient. Negative deviations (undervalued relative to MA) shift towards Cyan, while positive deviations (overvalued) shift towards Magenta.
■How to Use
Identify Value Areas: Look for the "POC" (Point of Control) line, which indicates the price level where the most time (highest number of blocks) was spent.
Assess Reversion Risk: Blocks that are bright Magenta or bright Cyan indicate that time was spent far away from the Moving Average. Traders can use this to visually gauge if a breakout is sustainable or if a mean-reversion is likely.
Customize Your View: You can adjust the TPO timeframes (Daily/Weekly/Monthly), the block interval (e.g., 30 minutes), and choose your preferred MA type (SMA, EMA, WMA, HMA).
Disclaimer: This indicator is designed for educational and analytical purposes. TPO is a tool for understanding market structure and time spent at price levels, not a standalone trading signal generator. Past performance of price around value areas does not guarantee future results.
説明文
コンセプトと開発目的
このインジケーターは「相場分析におけるスーパーツールであるTPO(マーケットプロファイル)の真の力を見出し、深い理解を得る」というコアコンセプトのもとに開発されました。伝統的なTPOの仕組みと相場の重心(移動平均線)を融合させることで、時間の経過に伴う価値の推移と価格の乖離を、より視覚的かつ明確にトレーダーに提供します。
オリジナリティと機能
従来のTPOプロファイルは時間枠をアルファベット(A、B、C...)で表し、静的な色を使用しますが、このスクリプトはコミュニティに新たな付加価値を提供するために2つの独自機能を備えています。
連番表示: アルファベットの代わりに、各TPOブロックは形成された順番に沿って(1、2、3...)と連番で表示されます。これにより、セッション内での時間の流れを直感的に読み取ることが劇的に容易になります。
MA乖離率によるグラデーション着色: 最大の特徴はその着色ロジックです。TPOブロックは、相場の重心として機能する基準移動平均線(MA)からの「乖離率」に基づいて色が決定されます。
計算式と出力値の根拠
視覚データがどのように生成されているかを完全に透明化するため、ブロックの着色に使用されている具体的な計算式を明記します:
計算式: 乖離率(%) = ((価格 / MA) - 1.0) * 100.0
なぜこの計算なのか? この式は、特定のTPOブロックが形成された瞬間において、その価格水準が基準となる移動平均線からパーセンテージでどの程度離れているか(価格がどれほど伸びきっているか)を正確に測定するために使用されます。
実際の出力値: 出力はパーセンテージの浮動小数点数になります(例:MAが100ドルで、ブロックの価格が102ドルの場合、出力は 2.0 つまり2%になります)。この値は、ユーザーが設定した「最大の限界乖離率」(デフォルト2.0%)によって制限されます。
カラーマッピング: 制限されたパーセンテージはグラデーション関数に渡されます。マイナスの乖離(MAに対して割安)はシアン(水色)に近づき、プラスの乖離(割高)はマゼンタ(赤紫)に近づくように色が変化します。
使用方法
バリューエリアの特定: 最も多くの時間(ブロック数)が費やされた価格帯を示す「POC(Point of Control)」ラインを探し、相場の中心的価値を把握します。
平均回帰リスクの評価: 鮮やかなマゼンタやシアンのブロックは、移動平均線から遠く離れた場所で時間が費やされたことを示します。トレーダーはこれを視覚的な基準として、ブレイクアウトが持続可能か、あるいは平均回帰(MAへの戻り)が起こりやすいかを判断できます。
柔軟なカスタマイズ: TPOの期間(日/週/月)、ブロックの区切り(例:30分)、そして好みのMAタイプ(SMA、EMA、WMA、HMA)を自由に変更できます。
免責事項:このインジケーターは教育および分析目的で設計されています。TPOは市場構造と価格帯での滞在時間を理解するためのツールであり、単独の売買シグナルではありません。バリューエリア周辺での過去の価格動向は、将来の結果を保証するものではありません。
Indikator

Hull VWMA + THMAHull VWMA + THMA
Hull VWMA + THMA is a volume-weighted Hull-style moving average designed to combine the responsiveness of Hull Moving Average logic with volume-adjusted price weighting.
Instead of applying the Hull calculation to a standard WMA, this indicator uses a volume-weighted WMA structure, where price movement is adjusted by trading volume. This helps the moving average respond more strongly to price action that occurs with higher volume, while reducing the influence of lower-volume moves.
The indicator supports two Hull variations:
HMA Mode
Uses a volume-weighted Hull Moving Average calculation for a smooth and responsive trend-following line.
THMA Mode
Uses a faster THMA-style Hull variation, designed to react more aggressively to short-term price changes.
The line changes color based on its slope:
Green = the average is rising
Red = the average is falling
This makes it easy to visually identify trend direction, momentum shifts, and potential continuation or reversal areas.
Features
Volume-weighted Hull Moving Average calculation
Optional THMA variation for faster response
Optional geometric mode using log-price transformation
Adjustable source and length
Optional line smoothing with EMA, RMA, or WMA
Dynamic color based on trend direction
Works directly on the price chart
How to Use
This indicator can be used as a trend filter, dynamic support/resistance reference, or momentum direction tool.
Common usage ideas:
Price above the line may indicate bullish trend conditions
Price below the line may indicate bearish trend conditions
A green line suggests upward momentum
A red line suggests downward momentum
Slope changes may help identify early trend shifts
THMA mode may be useful for shorter-term or more reactive trading styles
HMA mode may be preferable for smoother trend following
Inputs
Length
Controls the calculation period. Lower values make the line faster; higher values make it smoother.
Source
Selects the price source used in the calculation.
Hull Variation
Choose between HMA and THMA modes.
Geometric
Applies a logarithmic transformation before calculation and converts the result back afterward. This may be useful for assets with large percentage-based moves.
Line Smoothing
Optional smoothing can be applied using EMA, RMA, or WMA.
Line Smoothing Length
Controls the strength of the optional smoothing.
Notes
This indicator is intended to help visualize volume-adjusted trend direction and momentum. It should not be used as a standalone trading system. Always combine it with proper risk management and additional market analysis. Indikator

Indikator

ID0009 Rebound Exit Planner [ReconHK]━━━━━━━━━━━━━━━━━━━━━━━━━━━━━━
OVERVIEW
━━━━━━━━━━━━━━━━━━━━━━━━━━━━━━
ID 0009 — Rebound Exit Planner is an advanced trading concept designed mainly for 15-minute, 1-hour, and 4-hour timeframes . It is built for day trading and swing trading , where timing, capital efficiency, and realistic exits matter.
This indicator does not try to predict the whole future of the ticker. It focuses on one professional question:
Inside this defined box, what is the realistic rebound potential of this ticker based on its historical behavior?
━━━━━━━━━━━━━━━━━━━━━━━━━━━━━━
1. CORE MINDSET — WHAT MATTERS IS INSIDE THE BOX
━━━━━━━━━━━━━━━━━━━━━━━━━━━━━━
ID 0009 is for traders who want high-quality, controlled rebound trades . The main idea is not to predict everything that happens after the move. The main idea is:
Can this ticker reach a realistic historical target inside the box?
What happens outside the box is not the main focus. Price may continue higher after the box, drop again, or move sideways. For this indicator, the important question is:
Did the trade do what we wanted inside the box?
The box gives the trader a defined area to test whether the target is realistic, whether the timing is realistic, whether price reached the target before the box ended, whether the ticker showed enough rebound strength, whether the sample quality was acceptable, and whether the capital was used efficiently.
Key point: ID 0009 does not make trading risk-free. Position size must always follow risk management. The advantage is that it connects target, timing, historical samples, and exit discipline inside one box.
Short version: What happens inside the box matters most. If the ticker can repeatedly reach realistic targets inside the box, the trader can close faster, manage capital better, and avoid holding trades with no clear exit plan.
━━━━━━━━━━━━━━━━━━━━━━━━━━━━━━
2. CORE CONCEPT — WHAT THIS INDICATOR REALLY DOES
━━━━━━━━━━━━━━━━━━━━━━━━━━━━━━
ID 0009 is mainly an exit-planning indicator , not a simple buy-signal tool. Its purpose is to help traders build a higher-quality rebound trade by defining where price could realistically rebound, how much time the move may need, and where the trader should close or reduce the position .
The box shows the ticker’s historical rebound potential within a specific active-market time window. The bands inside the box are not random targets; they are based on how far similar rebounds reached in the past.
Correct use: Enter with your own strategy or the optional LONG helper, then use ID 0009 to manage the exit professionally.
The focus is not only “Can price go up?” The better question is:
Can this ticker reach a realistic target inside the box before the time window becomes unattractive?
━━━━━━━━━━━━━━━━━━━━━━━━━━━━━━
3. WHAT THE BOX MEANS
━━━━━━━━━━━━━━━━━━━━━━━━━━━━━━
The box is your trade management area . It tells you:
From this point, price has this amount of time to reach a realistic rebound target.
Use it like this: find a possible long entry using your own strategy or the optional LONG triangle, look at the box and choose a realistic exit band, use P68 more carefully in weak markets, use P50 / P40 only when the trend is strong, freeze the box if you want to test that exact moment, and watch only what happens inside the box .
If price reaches your selected band, close or reduce. If price moves too slowly and the box is almost finished, stop waiting or reduce risk.
Practical rule: Target reached inside the box = take profit. Box ending without target = do not keep capital blocked.
The box is not about predicting the full future. It is about making the trade more controlled, faster, and easier to manage.
━━━━━━━━━━━━━━━━━━━━━━━━━━━━━━
4. HOW TO READ THE LABEL CORRECTLY
━━━━━━━━━━━━━━━━━━━━━━━━━━━━━━
Each band has a label on the right side of the box.
Example: P68 +4.00% | 104.00 | N 64
Read it like this: P68 is the band type, +4.00% is the expected rebound target from the projection base price, 104.00 is the target price level, and N 64 means 64 historical samples were used for this projection.
This label does not mean there is a 68% chance price will go up.
Correct meaning: This is the historical rebound target zone, the target price, and the number of samples used.
Practical rule: Use the label to identify the target price and sample count quickly. Do not read it as a guaranteed probability of price increase.
Screenshot example:
━━━━━━━━━━━━━━━━━━━━━━━━━━━━━━
5. HOW TO USE IT CORRECTLY IN AN UPTREND
━━━━━━━━━━━━━━━━━━━━━━━━━━━━━━
In an uptrend, the main market direction supports the rebound, so price may have a better chance to reach higher bands.
Confirm the ticker is really in an uptrend, enter using your own strategy or the optional LONG triangle, and use the box to plan the exit before the trade becomes emotional. Take partial profit at safer bands like P80 or P68 . If momentum stays strong, you can allow part of the position to aim for P50 or P40 . If price reaches a band and starts rejecting, reduce or close instead of waiting blindly. If price does not move well inside the box, do not keep capital blocked.
Practical rule: In an uptrend, P50 or P40 can be possible, but protect profit step by step.
Goal: Do not hold forever. Use trend strength to reach a better exit inside the box.
━━━━━━━━━━━━━━━━━━━━━━━━━━━━━━
6. HOW TO USE IT CORRECTLY IN A DOWNTREND
━━━━━━━━━━━━━━━━━━━━━━━━━━━━━━
A downtrend is one of the best ways to test the real power of ID 0009. Downtrends are difficult because rebounds are usually weaker, faster, and less reliable. If the indicator can help identify where to exit in a downtrend, it shows how useful the box really is.
Downtrend goal: Catch a controlled rebound, close faster, and avoid staying in the trade before price drops again.
Find a ticker that is clearly in a downtrend. Use your own entry logic or the optional LONG triangle only as a helper. Open the indicator box and check the realistic rebound zones. Be more defensive with the target. Focus mainly on safer zones like P68 , not aggressive zones like P40 . Use Freeze Projection from the GUI where a long entry would make sense, then use TradingView Replay Mode to watch how price behaves inside the frozen box. Repeat this many times on different downtrend examples.
The important question in a downtrend is not “Will this become a new uptrend?” The better question is:
How much can this ticker realistically rebound before weakness returns?
Practical rule: In a downtrend, use ID 0009 carefully. Enter only with confirmation, target safer zones like P68, close faster, and do not wait too long for P40 unless the structure clearly improves.
Screenshot example:
Recommended test: Use Freeze Projection + Replay Mode in downtrends to check again and again whether the indicator can guide controlled exits before price drops again.
━━━━━━━━━━━━━━━━━━━━━━━━━━━━━━
7. THE 3 SETTINGS USERS SHOULD UNDERSTAND
━━━━━━━━━━━━━━━━━━━━━━━━━━━━━━
Most settings are already explained in the GUI. For normal use, focus only on these three:
Rebound Window — controls how much active market time the ticker has to reach the target. Shorter window = faster trade. Longer window = more time for the rebound.
Freeze Projection — locks the box at one exact moment. Use it with Replay Mode to test if price reaches the target inside the box.
Optional LONG Triangles — only an entry helper, not the main indicator. Use it if helpful, or disable it if you have your own entry method.
Important: The main value is still the exit box, not the entry triangle.
━━━━━━━━━━━━━━━━━━━━━━━━━━━━━━
8. THE TABLE — CHECK QUALITY BEFORE TRUSTING THE BOX
━━━━━━━━━━━━━━━━━━━━━━━━━━━━━━
The table tells you if the projection is strong enough to use. Focus on three things: Samples , Status / Fit , and Window .
Samples show how many historical cases were used. More samples usually means more reliable context. Status / Fit shows whether the setup has enough historical support or should be treated carefully. Window shows how much active market time the ticker has to reach the target.
Practical rule: If samples are low or status is weak, do not trust the box too much. Use smaller risk or skip the trade.
━━━━━━━━━━━━━━━━━━━━━━━━━━━━━━
9. GOOD MINDSET VS BAD MINDSET
━━━━━━━━━━━━━━━━━━━━━━━━━━━━━━
Good mindset means using ID 0009 as an exit-plan tool: enter with your own strategy, use the box to plan the exit, close or reduce when price reaches the selected label target, use P68 more carefully in downtrends, use P50 or P40 only when the trend is strong, stop waiting if the box is ending and price is still weak, check the sample table before trusting the box, and care most about what happens inside the box.
Bad mindset means treating the indicator like a guaranteed signal: buying only because the LONG triangle appears, thinking the label means price must go up, waiting for P40 in a weak downtrend, ignoring low samples, holding after the box ends with no plan, thinking the indicator removes risk, or caring more about what might happen after the box than what happens inside it.
Practical rule: Use ID 0009 to exit with discipline, not to hope longer.
━━━━━━━━━━━━━━━━━━━━━━━━━━━━━━
FINAL SHORT EXPLANATION
━━━━━━━━━━━━━━━━━━━━━━━━━━━━━━
ID0009 is a historical rebound exit-plan indicator . It helps traders understand what a ticker can realistically achieve inside a specific active-market time window based on historical samples.
The indicator is not mainly for entry. It is mainly for planning where and when to close or reduce a long position before the rebound becomes weak or capital stays blocked too long.
Very short version: Enter with your own strategy. Use ID0009 to plan the exit. The box shows the ticker’s realistic rebound potential, the labels show target zones, and the table shows whether the projection has enough historical support.
Please subscribe and follow the next releases so you do not miss upcoming indicators and improvements. I am also working on other promising ideas, including tools related to Dollar Cost Average, liquidity, and other advanced trading concepts . Indikator

Indikator

[ A L P H A X ] VOIDAlphaX VOID — Fair Value Gap Confluence System: FVG Detection, 5-Layer Retest Entries, CE Rejection Filter & ATR Trailing Exit Engine
AlphaX VOID is a professional-grade smart money confluence system built around the single most powerful concept in institutional price action: the Fair Value Gap. Where price moves so aggressively that it leaves an unmitigated imbalance in the order book — a void — institutions return to fill orders at those levels. VOID detects every qualifying gap in real time, tracks its state, and waits. When price returns to retest that void, a 5-layer confluence engine evaluates the quality of that retest across EMA structure, squeeze momentum, volume delta pressure, VWAP bias, and ADX directional strength. Only when enough layers agree does a signal fire — not on the gap formation, not on the first touch, but on a confirmed, high-quality institutional retest with the trend and momentum behind it. Designed for active traders on crypto, forex, gold, and indices across the 1-minute to 15-minute timeframes.
━━━━━━━━━━━━━━━━━━━━━━━━━━━━━━━━━━━━━━━━
🕳 What Is a Fair Value Gap?
A Fair Value Gap (FVG) is a three-candle price structure where the middle candle moves with such force that it creates a gap between the wick of the first candle and the wick of the third candle — a zone where no two-sided trading occurred. Price moved through that area too fast for the market to establish fair value.
Bull FVG: The low of candle 3 is above the high of candle 1. Price left a gap to the upside — an unmitigated bullish imbalance. When price returns to this zone, institutions are likely resting buy orders there.
Bear FVG: The high of candle 3 is below the low of candle 1. Price left a gap to the downside — an unmitigated bearish imbalance. When price returns to this zone, institutions are likely resting sell orders there.
Why FVGs matter to institutional traders: Market makers and large institutions cannot fill their full order size in a single fast move. When price revisits the FVG zone, they use the retest to complete their position. This is why FVG retests so frequently produce high-velocity continuation moves — they are not random support/resistance, they are unfilled institutional order clusters.
AlphaX VOID does not simply draw FVG boxes. It tracks the lifecycle of every gap — from formation through active, retest, and filled — and only presents entry signals when the retest coincides with genuine multi-layer confluence.
━━━━━━━━━━━━━━━━━━━━━━━━━━━━━━━━━━━━━━━━
🔬 FVG Detection Engine — Quality Filters
Not every gap is worth trading. Gaps formed during weak, choppy price action are noise. VOID applies two mandatory quality filters to every detected gap before registering it as valid.
Displacement Filter:
The middle candle of the three-candle structure must show genuine displacement — its body must exceed the average body size over the last 14 bars by a configurable multiplier (default: 1.15×). This ensures the gap was formed by a real impulsive move, not a slow grind that happened to leave a small gap. A gap without displacement is a weak gap.
Minimum Gap Size Filter:
The physical size of the gap (the distance between the relevant wicks of candle 1 and candle 3) must meet a minimum threshold expressed as a multiple of ATR (default: 0.15×). This eliminates micro-gaps that are too small to be meaningful — gaps so narrow that spread and noise would immediately invalidate any retest entry.
Only gaps passing both filters are registered, stored, and tracked.
FVG Lifecycle Tracking:
Every registered FVG is stored in memory arrays with its top, bottom, direction, formation bar, and fill state. On every bar, VOID updates the state of all active gaps:
Active — gap is unmitigated. Box and CE line extend forward in real time
Filled — price has fully closed through the gap boundary. Box color shifts to neutral gray, CE line fades. Optionally hidden entirely via the Hide Filled FVGs setting
Age cutoff — gaps older than the configured Max FVG Age (default: 120 bars) are excluded from retest scanning. Old gaps lose institutional relevance as market structure evolves
━━━━━━━━━━━━━━━━━━━━━━━━━━━━━━━━━━━━━━━━
📐 The FVG Visual System
Every active FVG is rendered directly on the price chart as a structured visual zone with three components.
FVG Box:
A shaded rectangle spanning the full gap from top to bottom. Bull gaps are shaded in semi-transparent yellow-green; bear gaps in semi-transparent red. The box extends forward by the configured number of bars (default: 30) and updates in real time as price evolves. When a gap fills, the box shifts to neutral gray — or is removed entirely if Hide Filled FVGs is enabled.
CE Line (Consequent Encroachment — 50% Level):
A dashed line at the exact midpoint of the FVG zone. This is the Consequent Encroachment level — the 50% retracement into the gap. This level is critical for entries: the most reliable FVG retests are those where price dips into the gap but closes back above (bull) or below (bear) the CE line, demonstrating that the institutional zone held and rejected price cleanly. The CE Rejection filter is on by default and can be toggled in settings.
FVG Formation Dots:
Small squares appear below (bull FVG) or above (bear FVG) the bar at the moment a new qualifying gap is formed, providing instant chart-level notification of every new gap without requiring dashboard attention.
━━━━━━━━━━━━━━━━━━━━━━━━━━━━━━━━━━━━━━━━
🧠 The Retest Detection Engine
Detecting a gap is the easy part. Detecting a high-quality retest of that gap is the core intellectual challenge VOID is built to solve.
On every bar, VOID scans all active, unfilled FVGs of the appropriate direction for a valid retest condition. A retest requires all of the following to be true simultaneously:
1. Price overlap: The current bar's low must be at or below the FVG top, and the current bar's high must be at or above the FVG bottom. Price is physically inside or touching the zone.
2. Candle rejection: The bar must close in the correct direction — a bullish close (close above open) for a bull FVG retest, a bearish close for a bear FVG retest. Price entered the gap but the candle closed back out, demonstrating rejection.
3. CE rejection (when enabled): For bull retests, the close must be at or above the CE midline — not just any bullish close, but one that reclaims the institutional midpoint. For bear retests, the close must be at or below the CE midline. This is the single most important retest quality filter in the system. A retest that fails to reclaim the 50% level is a weak, indecisive retest.
4. Age validation: The gap must be no older than the configured maximum age. Gaps older than this threshold are excluded even if all other conditions are met.
5. Most recent qualifying gap priority: When multiple gaps qualify simultaneously, VOID selects the most recently formed gap — the freshest institutional imbalance takes precedence.
━━━━━━━━━━━━━━━━━━━━━━━━━━━━━━━━━━━━━━━━
📊 The 5-Layer Confluence Engine
A valid FVG retest alone is not sufficient for a signal. VOID requires that the retest occur within a high-quality confluence environment across five independent layers. Each layer casts a directional vote on every bar. Signals only fire when a configurable minimum number of votes align (default: 3 of 5).
━━━━━━━━━━━━━━━━━━━━━━━━━━━━━━━━━━━━━━━━
Layer 1 — EMA Ribbon (Trend Structure)
A triple EMA ribbon using Fast (default: 8), Slow (default: 21), and Signal (default: 50) EMAs. All three must stack in directional order and price must be on the correct side for a full ribbon vote.
Bull: Fast above Slow above Signal, close above Fast EMA.
Bear: Fast below Slow below Signal, close below Fast EMA.
A separate EMA Trend Alignment setting (default: on) enforces that bull FVG retest signals only fire when the fast EMA is above the slow EMA — the minimum trend structure condition — even if the full ribbon stack is not met. This prevents counter-trend FVG entries that carry the lowest success rate.
The ribbon is plotted on the chart as a gradient fill between the Fast and Slow EMA lines — yellow-green fill during bull structure, red during bear, gray during flat.
━━━━━━━━━━━━━━━━━━━━━━━━━━━━━━━━━━━━━━━━
Layer 2 — Squeeze Momentum (Energy Detection)
The TTM Squeeze momentum engine measures whether energy is building or releasing and in which direction.
Squeeze state: When Bollinger Bands compress inside Keltner Channels, volatility is contracting and a directional breakout is loading. This state is displayed as an orange background tint and flagged on the dashboard as ⚡ SQZ. An FVG retest that coincides with a squeeze release is one of the highest-quality setups the system can detect — the gap provides the structural level, the squeeze provides the breakout energy.
Momentum direction: Calculated via linear regression of price relative to the midpoint of the recent high-low range. Positive and rising = bull momentum. Negative and falling = bear momentum.
━━━━━━━━━━━━━━━━━━━━━━━━━━━━━━━━━━━━━━━━
Layer 3 — Volume Delta (Institutional Pressure)
A proprietary volume pressure model that splits each candle's volume into estimated bullish and bearish components based on the close position within the high-low range, smoothed by EMA. A secondary OBV slope confirms the dominant pressure direction over the configured lookback.
Bull vote: Bull volume EMA exceeds bear, delta EMA is positive, and OBV slope is rising — three independent volume signals all confirming buying pressure.
Bear vote: The full inverse.
An FVG retest with genuine volume delta confirmation means real capital is flowing into the gap zone, not just price drifting back. This is the distinction between a high-probability institutional retest and a low-energy drift that is likely to fail.
━━━━━━━━━━━━━━━━━━━━━━━━━━━━━━━━━━━━━━━━
Layer 4 — VWAP Bias (Institutional Session Reference)
The Volume Weighted Average Price anchored to the session provides the clearest single reference for institutional directional bias. Price above VWAP means institutions are net buyers for the session. Price below means net sellers.
Bull vote: Close above VWAP.
Bear vote: Close below VWAP.
A bull FVG retest that occurs while price is above VWAP is a with-institution trade. A bull FVG retest while price is below VWAP is counter-institutional — the gap exists, the retest is clean, but the session-level bias is working against the entry. This distinction is worth one full confluence point and often determines whether a retest succeeds or fails.
The VWAP filter can be toggled off, and the VWAP line itself can be shown or hidden independently.
━━━━━━━━━━━━━━━━━━━━━━━━━━━━━━━━━━━━━━━━
Layer 5 — ADX Directional Strength (+DI / -DI)
The ADX filter in VOID operates at two levels. First, the ADX value must meet the minimum threshold (default: 18) confirming the market is trending rather than ranging. Second, the directional component is used — +DI versus -DI — to confirm that the ADX strength is aligned with the signal direction.
Bull vote: ADX above threshold and +DI exceeding -DI — the trend strength is directionally bullish.
Bear vote: ADX above threshold and -DI exceeding +DI — the trend strength is directionally bearish.
This is fundamentally different from a simple ADX on/off gate. An ADX reading of 25 with +DI above -DI in a bull FVG setup is confirming. An ADX reading of 25 with -DI above +DI in a bull FVG setup means the trend strength is bearish — directionally opposed to the signal — and this layer will not vote for it.
━━━━━━━━━━━━━━━━━━━━━━━━━━━━━━━━━━━━━━━━
🏷 Signal Firing Logic
A VOID signal fires when all of the following are simultaneously true:
A valid FVG retest is detected (overlap + candle rejection + CE rejection if enabled + age check)
The confluence score meets or exceeds the configured minimum (default: 3 of 5 layers)
ADX confirms a trending market (value above minimum threshold)
Session filter confirms active hours
Signal cooldown has elapsed since the last signal (default: 8 bars) — prevents repeated signals during extended retest zones
EMA trend alignment condition is met if the Require EMA Trend Alignment setting is enabled
Edge triggering: The signal fires only on the bar where all conditions first become true simultaneously — not on every bar they remain true. Each triangle on the chart represents a distinct, fresh confluence event.
Score label: Every signal prints a label (e.g., 4/5 FVG ) showing the live confluence score at signal time. The FVG suffix confirms this is an institutional gap retest entry, not a generic momentum entry.
━━━━━━━━━━━━━━━━━━━━━━━━━━━━━━━━━━━━━━━━
🎯 FVG-Anchored Stop Loss Placement
VOID includes a purpose-built stop loss mode unique to FVG trading: Place SL Beyond FVG Edge (default: on).
When enabled, the stop loss for a bull retest entry is placed at the bottom of the retested FVG minus an ATR buffer — not below the current bar's low. For a bear retest, the stop is placed at the top of the retested FVG plus an ATR buffer.
Why this matters: The FVG boundary is the institutional invalidation level. If price closes beyond the far edge of the gap, the imbalance has been fully absorbed — the institutional thesis for the retest is gone and the trade is structurally invalid. Using the FVG edge as the stop base produces stops that are:
Structurally meaningful — anchored to the actual invalidation level, not an arbitrary ATR distance from entry
Tighter when gaps are narrow — better risk-reward on high-quality, precise gaps
Wider when gaps are large — providing the trade room to breathe within the full institutional zone
When this setting is off, the stop reverts to a standard ATR-based distance from the bar's low or high — consistent with the Pulse Scalper behavior.
━━━━━━━━━━━━━━━━━━━━━━━━━━━━━━━━━━━━━━━━
🛡 Dynamic ATR Exit System
All three exit mechanisms from the VOID exit engine work together on every open trade:
Stop Loss: Placed at the FVG far edge (when enabled) or bar low/high, minus/plus an ATR buffer (default: 1.2×). Your maximum risk boundary. Does not move.
TP1 — Partial Target (50%): 1.8× ATR from entry. Scale out half the position here and move the remainder to breakeven. A small circle marker appears at the TP1 bar.
TP2 — Full Target: 3.5× ATR from entry. Full position exits and the system resets. A labeled TP marker confirms the exit on the chart.
ATR Trailing Stop: A dynamic stop that advances with price every bar — always positioned 1.5× ATR behind the current bar's low (bull) or high (bear). Plotted as a live orange line. In strong institutional continuation moves, the trail captures significantly more than the fixed TP2 target. In weak retests that stall early, the trail cuts the loss before the fixed SL is reached — providing a tighter actual exit than the structural stop.
All exit levels are plotted as live lines on the chart for the duration of the trade and cleared automatically on exit.
━━━━━━━━━━━━━━━━━━━━━━━━━━━━━━━━━━━━━━━━
📊 Live Dashboard
The real-time dashboard displays the complete internal state of the indicator across four sections, updated on every bar.
FVG STATE
Bull FVGs — count of currently active, unfilled bull FVGs being tracked
Bear FVGs — count of currently active, unfilled bear FVGs being tracked
Retest — live retest detection status: ▲ BULL RETEST or ▼ BEAR RETEST when a valid gap touch is occurring, — NONE otherwise. This updates in real time so you can see a retest developing before the full signal fires
MARKET
Session — ✓ ACTIVE or ✗ OFF-HOURS. Confirms whether the session filter gate is open
ADX — live ADX value with ✓ or ✗ pass/fail. Confirms whether market structure is trending strongly enough to support FVG retest entries
CONFLUENCE
L1 EMA — current ribbon state: ▲ BULL, ▼ BEAR, or — FLAT
L2 Momentum — current momentum state: ⚡ SQZ (squeeze building), ▲ BULL, ▼ BEAR, or — FLAT. The squeeze state is the highest pre-signal alert condition
L3 Vol Delta — current volume pressure: ▲ BULL, ▼ BEAR, or — NEUTRAL
L4 VWAP — current VWAP position: ▲ ABOVE (institutional bull bias) or ▼ BELOW (institutional bear bias)
L5 ADX Dir — ADX directional vote: ▲ BULL (+DI dominant), ▼ BEAR (-DI dominant), or — FLAT
Bull Score — live 0–5 score. Background highlights yellow-green when the minimum threshold is met
Bear Score — live 0–5 score. Background highlights red when the minimum threshold is met
POSITION
Position — current tracked position: ▲ LONG, ▼ SHORT, or — FLAT with background color highlight
Stop Loss — the active SL level (FVG-anchored or ATR-based depending on settings), color-coded by direction
TP1 / TP2 — the active first take-profit level; TP2 is tracked internally and triggers the full exit marker
Bars in Trade — bars elapsed since entry, tracking trade duration
━━━━━━━━━━━━━━━━━━━━━━━━━━━━━━━━━━━━━━━━
📈 Chart Visual System
FVG Boxes (yellow-green / red) — active imbalance zones extending forward in real time. Color shifts to gray on fill
CE Dashed Lines — the 50% midpoint of every active FVG. The key level for CE rejection filtering
Formation Dots — small squares marking the exact bar a new qualifying FVG was detected
▲ Triangle (below bar) — bull retest entry signal. All conditions met
▼ Triangle (above bar) — bear retest entry signal. All conditions met
Score Label (e.g. 4/5 FVG) — confluence score at signal time, printed on every entry triangle
EMA Ribbon Fill — yellow-green fill during bull EMA structure, red during bear, gray during flat
VWAP Line (purple) — optional, toggleable session VWAP reference
Orange Squeeze Background — active during Bollinger/Keltner squeeze conditions
Yellow-green background tint — active during open long trades
Red background tint — active during open short trades
SL Line — fixed stop loss level, active while trade is open
TP1 Line — first partial take-profit target
TP2 Line (bright) — full exit target
Trail Line (orange) — dynamic trailing stop, advances with price every bar
TP marker — confirms TP2 hit and full exit
SL marker — confirms stop loss or trail triggered
━━━━━━━━━━━━━━━━━━━━━━━━━━━━━━━━━━━━━━━━
🚀 How to Trade with AlphaX VOID — Step by Step
Step 1 — Read the FVG State
Check the dashboard: how many active bull and bear FVGs are on the chart?
Multiple active FVGs in one direction indicate a well-defined institutional order cluster — a zone with stacked imbalances that price is likely to respect strongly on retest
Zero active FVGs in a direction means no institutional retest opportunity exists yet — wait for a new gap to form
Step 2 — Watch for Retest Alert on the Dashboard
The RETEST row updates in real time. ▲ BULL RETEST or ▼ BEAR RETEST appearing means price is currently inside a valid FVG zone with a rejection candle forming
This is your cue to check the confluence score rows. Watch the bull or bear score building in real time on the current bar — if it is approaching or has crossed the threshold, a signal may be seconds away
Step 3 — Enter on the Signal Triangle
A ▲ triangle below the bar is a confirmed bull FVG retest entry. All conditions — FVG retest quality, confluence score, ADX, session, cooldown, trend alignment — are met simultaneously
A ▼ triangle above the bar is a confirmed bear FVG retest entry
Read the score label. A 5/5 signal is the maximum confluence available — all five layers and the gap retest aligned simultaneously. These are the highest-conviction setups VOID produces
Enter on the close of the signal bar or the open of the next bar
Step 4 — Manage the Trade with Live Exit Lines
The SL line is your structural invalidation. If you used the FVG-anchored SL, price closing beyond this level means the institutional gap has been fully absorbed — the thesis is invalid
Watch the orange Trail Stop advancing with price as the trade moves in your favor
At TP1, scale out 50% of the position. Move your stop to breakeven on the remainder
Let the trailing stop manage the rest — it captures whatever continuation the institutional imbalance produces
Step 5 — Exit and Reset
A TP marker confirms TP2 hit. Full exit and system reset
An SL marker confirms stop or trail triggered. Accept the loss and wait — the FVG that was retested is now filled or invalidated, and a new setup will develop from the next qualifying gap
Never re-enter immediately after a stopped trade. Wait for the confluence score to rebuild and a new qualifying gap to form or a fresh retest of a different active gap
━━━━━━━━━━━━━━━━━━━━━━━━━━━━━━━━━━━━━━━━
⚠ Identifying Low-Quality Conditions — When Not to Trade
Stand aside when:
ADX ✗ on the dashboard — the market is not trending. FVG retests in ranging markets are frequently absorbed rather than rejected, producing whipsaw exits
RETEST shows ▲ or ▼ but no triangle appears — a retest is occurring but the confluence score or other filters are blocking the signal. This is the system explicitly telling you the quality threshold is not met — do not override it manually
Session ✗ OFF-HOURS — thin liquidity environments produce unreliable FVG reactions. The institutional actors who created the gap are not active
Multiple gap fills in quick succession — if several FVGs are filling rapidly without producing entries, the market is in a trending impulse phase eating through old imbalances rather than respecting them. Wait for the new gaps being created by this impulse to age and become valid retest candidates
Score stuck at 1 or 2 of 5 — the confluence environment is fragmented. Too few layers agree for a reliable institutional retest
Orange squeeze background present but score below threshold — energy is coiling but the directional confluence is not established. Wait for the squeeze to release in a clear direction with score confirmation before acting
What to do:
Monitor the dashboard for the RETEST row and confluence scores building simultaneously — the ideal setup shows both developing on the same bar
Prioritize gaps with the CE Rejection filter active — CE-rejected retests are the cleanest institutional entries available
Wait for ADX to confirm — a trending ADX above threshold combined with a directional +DI/-DI alignment is the ideal background for FVG retest entries
The highest-quality VOID setup: active squeeze on the dashboard, price retesting a fresh FVG at the CE level, 5/5 confluence score, ADX ✓, session ✓. These conditions together rarely occur — when they do, they produce the strongest continuation moves the system identifies
━━━━━━━━━━━━━━━━━━━━━━━━━━━━━━━━━━━━━━━━
⚡ Key Features
🕳 Real-time FVG detection engine — identifies all qualifying bull and bear Fair Value Gaps with displacement and minimum gap size filters
📦 Full FVG lifecycle tracking — every gap stored in memory arrays with top, bottom, direction, age, and fill state updated on every bar
📐 CE (Consequent Encroachment) filter — requires price to reclaim the 50% midpoint of the gap on retest, eliminating weak, indecisive touches
🧠 5-layer confluence gate — EMA Ribbon, Squeeze Momentum, Volume Delta, VWAP Bias, and ADX Directional Strength must agree before a retest signal fires
📊 Live confluence scoring — bull and bear scores updated every bar, displayed on the dashboard before the signal appears
🎯 FVG-anchored stop loss — places the SL at the structural invalidation level (the far FVG edge) rather than a generic ATR distance, producing structurally meaningful risk levels
⚡ Squeeze momentum integration — TTM-style Bollinger/Keltner squeeze detection flags pre-breakout energy buildup with orange background tint and dashboard state
📡 VWAP session bias — confirms whether a retest is with or against institutional session direction
🔬 ADX directional filter — uses both the ADX value and +DI/-DI directionality, not just a simple trend/no-trend gate
🛡 Dynamic ATR trailing stop — orange line advances with price every bar, capturing extended institutional continuation moves beyond the fixed TP2 level
📈 EMA ribbon with trend alignment enforcement — prevents counter-trend FVG entries that carry the lowest success rate
🕐 Session filter — restricts entries to active market hours, eliminating thin-liquidity false retest reactions
⏱ Signal cooldown — prevents repeated signals during extended retest zones, ensuring each entry represents a distinct high-quality event
📊 21-row live dashboard — FVG State, Market, Confluence, and Position sections updated in real time
🔔 10 alert conditions — new FVG formation, retest entry, TP1/TP2 hits, stop hits for both bull and bear
🎨 Fully cohesive dual-tone color system — yellow-green for all bullish elements, red for all bearish elements, orange for squeeze and trail, gray for filled gaps and neutral states
⚙ Fully configurable — FVG parameters, confluence layers, EMA periods, squeeze settings, VWAP filter, ADX threshold, exit multipliers, session window, and all colors are independently adjustable
━━━━━━━━━━━━━━━━━━━━━━━━━━━━━━━━━━━━━━━━
⚙ Settings Reference
Fair Value Gaps
Show FVG Zones — toggle FVG boxes on or off
Show CE (50%) Lines — toggle the consequent encroachment midpoint lines
Max Active FVGs — maximum number of FVGs stored in memory simultaneously (default: 40)
Zone Extend (bars) — how many bars forward the FVG box and CE line project (default: 30)
Max FVG Age for Entries — gaps older than this bar count are excluded from retest scanning (default: 120)
Min Gap Size (ATR x) — minimum gap width as a multiple of ATR required for gap registration (default: 0.15)
Min Displacement (body x) — middle candle body must exceed average body by this multiplier (default: 1.15)
Require CE Rejection — close must reclaim the 50% gap midpoint on retest (default: on — strongly recommended)
Hide Filled FVGs — removes boxes and CE lines for gaps that have been fully mitigated (default: off)
EMA Ribbon
Fast EMA — fastest ribbon line (default: 8)
Slow EMA — intermediate ribbon line (default: 21)
Signal EMA — macro trend anchor (default: 50)
Show EMA Ribbon — toggle ribbon fill and lines
Squeeze Momentum
BB Length / BB Mult — Bollinger Band parameters for squeeze detection (defaults: 20 / 2.0)
KC Length / KC Mult — Keltner Channel parameters (defaults: 20 / 1.5)
Momentum Length — linear regression period for momentum direction (default: 12)
Volume Delta
Volume MA Length — EMA smoothing for bull and bear volume estimates (default: 14)
OBV Slope Length — lookback for OBV slope directionality (default: 10)
VWAP
Use VWAP Filter — when on, Layer 4 requires close to be on the correct side of VWAP (default: on)
Show VWAP Line — toggle the VWAP line on the chart (default: off)
Confluence Gate
Min Layers Required — minimum confluence votes needed for a signal (default: 3 of 5)
Session Filter — toggle active hours restriction
Active Session — configurable session window (default: 0700-2000)
Signal Cooldown — minimum bars between consecutive signals (default: 8)
Require EMA Trend Alignment — enforces minimum EMA directional alignment even when full ribbon is not stacked (default: on)
ADX Filter
Use ADX Filter — toggle the trend quality and directional gate
ADX Length — calculation lookback (default: 14)
ADX Minimum — threshold below which all signals are suppressed (default: 18)
Exit Settings
ATR Length — lookback for all ATR exit calculations (default: 10)
SL ATR Mult — stop loss ATR buffer beyond FVG edge or bar low/high (default: 1.2)
TP1 ATR Mult — first take-profit target (default: 1.8)
TP2 ATR Mult — full exit target (default: 3.5)
Use ATR Trailing Stop — toggle dynamic trailing stop
Trail ATR Mult — trailing distance from current bar's extreme (default: 1.5)
Show Exit Levels — toggle SL, TP1, TP2, and trail lines on the chart
Place SL Beyond FVG Edge — anchors stop to the structural gap invalidation level (default: on)
Display
Show Confluence Score Label — prints live score on every signal triangle
Show Dashboard — toggle the full dashboard panel
Dashboard Position — Top Left / Top Right / Bottom Left / Bottom Right
Colors
Bull / Bull Bright — yellow-green family for all bullish signals, fills, ribbons, and labels
Bear / Bear Bright — red family for all bearish signals, fills, ribbons, and labels
Squeeze — orange for squeeze tint and trailing stop line
Bull FVG / Bear FVG — gap box fill and border colors
Filled FVG — neutral gray for mitigated gaps
EMA Fast / Slow / Signal — individual EMA line colors
Ribbon Fill Bull / Bear / Flat — ribbon fill colors for each trend state
VWAP Line — VWAP plot color (default: purple)
SL / TP / TP2 / Trail Lines — individual exit level line colors
Long Zone BG / Short Zone BG — active trade background tints
Bull Label Text / Bear Label Text — text color for score labels on bull and bear signals
Dash Text / Dash BG / Dash Header / Dash Section / Dash Frame — full dashboard color control
━━━━━━━━━━━━━━━━━━━━━━━━━━━━━━━━━━━━━━━━
🔔 Alert Conditions (10 total)
FVG Formation Alerts
New Bull FVG Formed — a qualifying bullish Fair Value Gap has been detected. Watch for retest entry
New Bear FVG Formed — a qualifying bearish Fair Value Gap has been detected. Watch for retest entry
Entry Alerts
Bull FVG Retest Entry — all conditions met: bull FVG retest, CE rejection, confluence score, ADX, session
Bear FVG Retest Entry — all conditions met for a short institutional retest entry
Exit Alerts
Bull TP1 Hit — price reaches the first bull take-profit. Scale out 50%
Bull TP2 Hit — price reaches the full bull exit target. Position closed
Bull Stop Hit — stop loss or trailing stop triggered on a long position
Bear TP1 Hit — price reaches the first bear take-profit. Scale out 50%
Bear TP2 Hit — price reaches the full bear exit target. Position closed
Bear Stop Hit — stop loss or trailing stop triggered on a short position
All alert messages are formatted as const strings for clean webhook and notification platform integration.
━━━━━━━━━━━━━━━━━━━━━━━━━━━━━━━━━━━━━━━━
🎯 Recommended Settings by Instrument & Timeframe
The default configuration is optimized for XAUUSD, major forex pairs, and crypto on M1–M5 :
Min Layers at 3/5 — strong confluence without requiring perfection on every bar
CE Rejection on — the single most important FVG quality filter. Leave this enabled in all configurations
ADX minimum at 18 — slightly more permissive than the Pulse Scalper default, accounting for the structural quality already provided by the FVG retest condition
FVG-anchored SL on — structurally superior stop placement for all FVG-specific entries
Max FVG Age at 120 bars — covers approximately 2 hours on M1, 10 hours on M5. Sufficient for intraday imbalances without trading excessively old gaps
For other instruments or timeframes, adjust:
Higher timeframes (M15, H1, H4) — increase Max FVG Age to 200–300, increase Retest Cooldown to 15–25, increase TP2 to 4.5–5.5× ATR, raise Min Confidence to 4/5
Crypto (BTC, ETH) — increase Min Gap Size to 0.25–0.35× ATR to filter micro-gaps in volatile crypto price action, increase KC Mult to 2.0 for the squeeze layer
Indices (NAS100, US30) — use defaults with session tightened to 09:30–16:00. Increase displacement multiplier to 1.3 for cleaner gap quality on index moves
More signals — lower Min Layers to 2, disable CE Rejection, increase Max FVG Age, reduce Cooldown
Fewer, higher-quality signals — raise Min Layers to 4 or 5, keep CE Rejection on, raise ADX minimum to 22–25, reduce Max FVG Age to 60–80 bars
━━━━━━━━━━━━━━━━━━━━━━━━━━━━━━━━━━━━━━━━
👥 Who This Is For
🏦 Smart money and institutional price action traders — VOID is built on the core concept that institutional order flow creates imbalances and returns to fill them. This is the foundational logic of ICT methodology applied with quantitative confluence filters
🥇 Gold (XAUUSD) and forex scalpers — FVGs are particularly reliable on gold and major forex pairs where institutional order flow is most dominant
📊 Crypto and index traders — the displacement and gap size filters adapt the system to higher-volatility instruments without producing noise
🎯 Precision entry traders — the CE rejection filter and FVG-anchored stop produce tighter, more structurally defined entries than generic momentum systems
🧠 Systematic traders — the 5-layer confluence score provides a quantitative quality metric for every retest event, not just a visual signal
📉 Traders who want to stop chasing breakouts — VOID forces you to wait for price to return to the institutional level, eliminating the discipline failure of entering on extended, overheated moves
⚠ Traders who struggle with stop placement — the FVG-anchored SL system provides structurally meaningful stop levels determined by the market's own imbalance boundaries, not arbitrary ATR multiples
━━━━━━━━━━━━━━━━━━━━━━━━━━━━━━━━━━━━━━━━
📝 Notes
All signals are confirmed on bar close — the indicator is non-repainting by design. FVG boxes and CE lines may extend or update visually on the current bar, but no signal is generated until bar close confirmation
The CE Rejection filter is strongly recommended. Disabling it allows signals on any touch of the FVG box, including weak wicks that are unlikely to produce clean continuation moves
Maximum 500 labels, 500 lines, and 500 boxes are rendered. On very low timeframes with extended chart history, the oldest FVG boxes, CE lines, and signal markers may be automatically removed by TradingView's rendering limits. Reduce Max Active FVGs if this becomes an issue
FVG fill state is based on bar close — a wick through the gap boundary that closes inside or above the zone does not mark the gap as filled. Only a close beyond the boundary constitutes a fill
The VWAP calculation resets at the start of each session. On 24-hour crypto instruments, the VWAP anchors to the chart's visible history. For best VWAP behavior on crypto, consider disabling the VWAP filter (Layer 4) and relying on the remaining four layers
Gap age counting begins from the formation bar. A gap formed 5 bars ago on M5 is 25 minutes old — very fresh. The same gap age on H1 is 5 hours old — potentially stale. Adjust Max FVG Age to your timeframe context
The Trade Status section tracks position direction from signal to exit within a single chart session — it does not connect to your broker or brokerage account
━━━━━━━━━━━━━━━━━━━━━━━━━━━━━━━━━━━━━━━━
⚠ Disclaimer
This indicator is a technical analysis and visualization tool intended for educational and informational purposes only. It does not constitute financial advice or a recommendation to buy or sell any financial instrument. All signals are generated from historical and real-time price data using mathematical calculations — their accuracy or profitability is not guaranteed. Past performance of any signal type does not guarantee future results. Always conduct your own analysis, use proper risk management, and consult a licensed financial advisor before making any trading decisions. The author accepts no responsibility for any losses incurred from the use of this indicator.
━━━━━━━━━━━━━━━━━━━━━━━━━━━━━━━━━━━━━━━━
Built for traders who understand that price always returns to where it left unfinished business — and who want a system precise enough to be there when it does. Indikator

Strategi

Indikator

Strategi

Indikator

Strategi

Indikator

Strategi

Helios Pullback Framework [JOAT]Helios Pullback Framework
Introduction
Helios Pullback Framework evaluates pullback quality using ALMA trend stack, regression trajectory, pullback depth, wick recovery, liquidity capture, compression, and HTF bias.
This open-source indicator is designed as a context tool, not a standalone trading system. It focuses on explaining the current market state with restrained visuals and confirmed-bar logic where signals are used.
Core Concepts
1. ALMA Trend Stack
Fast and slow ALMA lines define execution and institutional spines.
2. Regression Trajectory
A regression envelope provides dynamic path context rather than static zones.
3. Pullback Quality
Pullback depth, wick recovery, phase impulse, and stretch are scored.
4. Liquidity Capture
Confirmed sweeps of recent highs or lows contribute only when aligned with bias.
score = bias + pullDepth + wickRecovery + sweep + compression + htf
Features
ALMA trend stack
Regression trajectory envelope
Pullback depth and wick recovery scoring
Liquidity capture markers
Sparse P+ and P- labels
Input Parameters
ALMA lengths
Volatility and trajectory length
HTF and optional session gate
Signal score, cooldown, and max stretch
Display toggles
How to Use This Script
Use P+ and P- labels as pullback-quality events inside an existing bias. Gold circles mark liquidity capture without full confirmation.
Limitations
The script uses historical OHLCV data and cannot know future prices.
Signals and states can be late during fast reversals because confirmed-bar logic is used to reduce repainting.
Model outputs should be interpreted with market context, risk controls, and independent analysis.
No visual state should be treated as a certain trade outcome.
Originality Statement
Helios is original in replacing supply/demand boxes with a cleaner model that scores pullback elasticity, trajectory, and liquidity capture.
Disclaimer
This indicator is provided for educational and informational purposes only. It is not financial advice, investment advice, or a recommendation to buy or sell any financial instrument. All calculations are derived from historical market data and may produce inaccurate readings in some market conditions. No indicator can predict future market behavior. Use proper risk management and independent judgment.
-Made with passion by jackofalltrades
Indikator

Indikator

Mean Reversion Pro 📊 Mean Reversion Pro — Data-Driven Edge on Any Market, Any Timeframe
Most mean reversion indicators tell you the price is "too far" from the moving average. This one tells you exactly how far is statistically worth trading — using your own chart's historical data as proof.
Works on all instruments and timeframes: futures (NQ, ES, CL, GC…), crypto (BTC, ETH, SOL…), forex (EUR/USD, GBP/USD…), indices (SPX, DAX, NASDAQ…), stocks, commodities — anything with a price and volume.
─────────────────────────────────────────
🔍 WHAT THIS INDICATOR DOES
─────────────────────────────────────────
Mean Reversion Pro silently analyses every historical instance where price deviated from a moving average by a given distance. For each of 15 tested threshold levels it computes:
• Win rate — % of times price returned to the MA within the timeout
• Expectancy — (win-rate × avg MFE) − (loss-rate × avg MAE)
• Profit Factor — gross gain / gross loss ratio
• Avg MAE — average adverse excursion (how far against you before reverting)
• Avg MFE — average favourable excursion (how far in your favour)
• Avg return time — average bars needed to reach the MA
It then automatically selects the threshold with the highest expectancy that also satisfies your minimum win-rate and minimum occurrences filters — and only then shows a signal. No manual optimisation. No curve-fitting.
─────────────────────────────────────────
⚙️ KEY FEATURES
─────────────────────────────────────────
✅ Universal — works on futures, crypto, forex, indices, stocks, commodities
✅ 3 threshold modes: fixed Points, ATR multiples, Z-Score (adapts to any volatility regime)
✅ 5 MA types: EMA, SMA, WMA, VWMA, Hull MA
✅ Auto-optimised threshold — the indicator finds the best level by itself
✅ Real-time dashboard: win-rate, expectancy, profit factor, MAE, MFE, return time (Long & Short)
✅ Dynamic bands: 1× and 1.5× optimal threshold zones drawn on the chart
✅ Non-repainting signals — only fires on confirmed, closed bars
✅ Optional filters: trend (EMA 50), volume, US session, minimum ATR
✅ Minimum history guard — signals are held until enough bars have been analysed
✅ All parameters fully exposed and documented with tooltips
─────────────────────────────────────────
📈 WHO IS THIS FOR
─────────────────────────────────────────
• Futures traders — NQ, MNQ, ES, MES, CL, GC, SI, ZB…
• Crypto traders — BTC, ETH, SOL and all altcoins on any exchange
• Forex traders — all major, minor and exotic pairs
• Index traders — SPX, NDX, DAX, FTSE, CAC, Nikkei…
• Stock traders and swing traders looking for mean reversion pullbacks
• Prop firm traders who need a systematic, rules-based edge
• Any trader tired of arbitrary support/resistance levels with no statistical backing
─────────────────────────────────────────
🧠 HOW TO USE IT
─────────────────────────────────────────
1. Apply to any chart on any timeframe
2. Let at least 500 bars load (recommended: 1000–2000 for robust statistics)
3. Choose Threshold Mode:
— Points → best for futures and indices (fixed price distances)
— ATR → best for crypto and forex (volatility-adjusted)
— Z-Score → best for statistical/quant approaches
4. Set your minimum Win Rate (default 65%) and minimum Occurrences (default 15)
5. A signal appears only when all statistical conditions are met AND your filters pass
6. Read the dashboard to assess setup quality before entering a trade
─────────────────────────────────────────
💡 WHY EXPECTANCY MATTERS MORE THAN WIN RATE
─────────────────────────────────────────
A strategy with 80% win rate can still lose money if the average loss is 5× the average win. Mean Reversion Pro uses expectancy — the only metric that combines win rate, average gain and average loss into a single number — as its selection criterion. A signal only appears when the math is in your favour.
─────────────────────────────────────────
⚠️ DISCLAIMER
─────────────────────────────────────────
This indicator is a decision-support tool only. It does not provide financial advice and does not guarantee future results. Past statistical performance is not indicative of future performance. Always use proper risk management. Indikator

Echelon Trend Filter [JOAT]Echelon Trend Filter
Introduction
Echelon Trend Filter is a recursive digital trend filter that creates a clean trend spine, optional step-state transitions, EMA context, and pivot zones.
This open-source indicator is designed as a context tool, not a standalone trading system. It focuses on explaining the current market state with restrained visuals and confirmed-bar logic where signals are used.
Core Concepts
1. Recursive Filter
The source is smoothed recursively to reduce minor bar noise.
2. Step-State Transitions
Optional step mode holds the trend state until a meaningful transition occurs.
3. EMA Context
A long EMA gives broader context for the filtered state.
4. Pivot Context Zones
Recent pivots create reference zones around prior turning areas.
state = step > step ? 1 : step < step ? -1 : state
Features
Digital trend spine
Optional step-state behavior
EMA cloud context
Pivot context zones
Confirmed transition alerts
Input Parameters
Filter length and source
Step mode toggle
Institutional EMA length
Pivot length and zone width
Cloud, candle, and panel toggles
How to Use This Script
Use the spine as trend context. Long and short transition labels mark confirmed state changes, while the EMA cloud helps judge broader alignment.
Limitations
The script uses historical OHLCV data and cannot know future prices.
Signals and states can be late during fast reversals because confirmed-bar logic is used to reduce repainting.
Model outputs should be interpreted with market context, risk controls, and independent analysis.
No visual state should be treated as a certain trade outcome.
Originality Statement
Echelon is original in combining recursive smoothing, held state transitions, EMA context, and pivot zones into a minimal trend overlay.
Disclaimer
This indicator is provided for educational and informational purposes only. It is not financial advice, investment advice, or a recommendation to buy or sell any financial instrument. All calculations are derived from historical market data and may produce inaccurate readings in some market conditions. No indicator can predict future market behavior. Use proper risk management and independent judgment.
-Made with passion by jackofalltrades
Indikator

ES 1m - 3m Momentum - Signal Flip ExitsHow the strategy works on both timeframes
The core logic is identical — four filters must all agree before a trade fires: the fast EMA (8) crosses the slow EMA (21), price is on the correct side of the 50 EMA, smoothed RSI is above or below 50, and volume is above its 20-bar average. When all four line up, you enter long or short. You stay in the trade until the opposite signal fires or the 1-point take profit is hit.
On the 1-minute chart the crossovers fire constantly — you could see 40–80 signals per day. The volume and RSI filters cut most of them, but commission ($5 round-trip) eats deeply into a 1-point target. To make it work on 1m you'd want to tighten the RSI threshold to 52/48 instead of 50/50, and possibly raise the volume multiplier to 1.5× to further reduce trade count. It's workable but requires extra tuning.
On the 3-minute chart (the version built for you) the signal count drops to a healthier 15–30 trades per day. Each bar represents 3× the price action so the EMA and RSI readings are more stable, the trend filter is more meaningful, and you're less likely to get chopped by random 1-minute noise. This is why 3m was the right choice — the filters have room to breathe.
The key risk on both timeframes is a trending day where the signal never flips. You enter long, ES runs 5–10 points, and you sit through the full move. That's fine — that's the plan. The danger is a choppy, range-bound day where you keep flipping long and short at the same price level. The volume filter is your main protection against that scenario. Strategi

Concordance Execution Model [JOAT]Concordance Execution Model
Introduction
Concordance Execution Model is a strategy framework that integrates regime detection, trend bias, structure direction, pressure, relative volume, regression confidence, and ATR risk management.
This open-source strategy is a research framework, not a performance claim. It demonstrates how rule-based confluence, realistic costs, risk controls, and confirmed-bar execution can be organized in Pine Script v6.
Core Concepts
1. Regime Filter
ALMA, EMA, structure, and regression confidence determine whether long or short entries are allowed.
2. Multi-Factor Entry Gate
Entries require confirmed structure or pullback context plus pressure, RVOL, and cooldown alignment.
3. ATR Risk Model
Stops, targets, trailing stops, structure invalidation, and time stops manage exits.
4. Confirmed-Bar Execution
Entry conditions are evaluated with confirmed bars to reduce repainting behavior.
longEntry = confirmed and regimeBull and pressureBull and rvolOk and cooled
Features
Regime, structure, pressure, and regression filters
ATR stop and target exits
Optional trailing stop
Structure invalidation and time stop exits
Dashboard and candle regime colors
Input Parameters
Structure pivot length and HTF bias
ALMA and regression confidence settings
Delta pressure, RVOL, and cooldown
ATR stop, target, trailing, and time stop
Panel and candle display toggles
Strategy Properties
Initial capital: 100000
Position sizing: 10 percent of equity
Pyramiding: 0
Commission: 0.02 percent
Slippage: 2 ticks
Stops and targets: ATR-based, with optional trailing stop
How to Use This Script
Use this as a transparent research framework. Test on multiple markets and review trade samples rather than relying on a single backtest.
Limitations
The script uses historical OHLCV data and cannot know future prices.
Signals and states can be late during fast reversals because confirmed-bar logic is used to reduce repainting.
Model outputs should be interpreted with market context, risk controls, and independent analysis.
No visual state should be treated as a certain trade outcome.
Originality Statement
Concordance is original in combining several independent model families into a realistic, non-pyramiding execution framework with explicit risk exits.
Disclaimer
This indicator is provided for educational and informational purposes only. It is not financial advice, investment advice, or a recommendation to buy or sell any financial instrument. All calculations are derived from historical market data and may produce inaccurate readings in some market conditions. No indicator can predict future market behavior. Use proper risk management and independent judgment.
-Made with passion by jackofalltrades
Strategi

EMA Edge - Multi-EMA Backtest Table with Golden/Death CrossEMA Edge — Multi-EMA Backtest Table with Golden/Death Cross
A clean, all-in-one performance dashboard that backtests 6 long-only strategies side-by-side against a Buy & Hold benchmark — 5 single-EMA crossover strategies plus a classic Golden Cross / Death Cross strategy — with on-chart cross markers and built-in alerts.
Instead of guessing which EMA length works best for a given stock or timeframe, this indicator runs the math for you and shows the answer in a single glance, ranked against simply holding the asset.
What It Does
For each of 5 user-defined EMA lengths, the indicator simulates a simple long-only strategy:
Buy when price closes above the EMA (when flat)
Sell when price closes below the EMA (when long)
Equity starts at 100 and compounds across trades using the close-to-close return of each trade
A 6th strategy row tests the classic Golden/Death Cross:
Buy when the fast EMA crosses above the slow EMA (Golden Cross)
Sell when the fast EMA crosses below the slow EMA (Death Cross)
Special first-bar handling: if the fast EMA is already above the slow EMA at the start of your backtest window (i.e., we're mid-trend with no fresh Golden Cross to wait for), the strategy enters immediately at that bar's opening price. This avoids the unrealistic outcome of sitting in cash for years waiting for a cross that already happened.
All strategies are compared against a Buy & Hold baseline that starts at the close of the first in-range bar. If a position is open at the last bar, its equity is marked-to-market so every strategy is compared on equal terms — fully invested vs. partially invested at the cutoff.
Features
5 configurable EMAs — defaults 9 / 21 / 50 / 100 / 200, fully editable
Golden/Death Cross strategy — uses independent fast/slow EMA inputs (default 50 / 200)
Performance table showing Return %, delta vs. Buy & Hold, and Outperform / Underperform status per strategy
Flexible backtest window — X weeks, X years, or full chart lifetime
On-chart GC / DC markers with optional subtle background tint on cross bars
Built-in alerts for both Golden Cross and Death Cross events
Fully customizable table — 9 position options, 6 text sizes, all colors exposed as inputs
Soft, light color palette designed not to dominate the chart
Optional EMA plotting (off by default to keep the chart clean)
How To Read The Table
ColumnMeaningStrategyThe rule being testedReturnTotal % return of the strategy over the chosen windowVs StockDifference between the strategy's return and Buy & HoldStatus▲ Outperform if the strategy beat Buy & Hold, ▼ Underperform if not
Green-tinted rows = strategy beat Buy & Hold
Red-tinted rows = strategy underperformed Buy & Hold
Cream row = the Buy & Hold baseline itself
How To Use
Add the indicator to any chart — works on stocks, ETFs, crypto, forex, any timeframe.
Choose your backtest window (e.g., 1 Year, 5 Years, or Lifetime).
Scan the table to see which strategy historically beat Buy & Hold on this asset.
Use the on-chart GC / DC labels to spot historical and live cross events. Right-click any marker → Add Alert to be notified on new crosses.
Tip: Test the same EMA lengths across daily and weekly timeframes and across different assets. You'll usually find that what works on a steady index like SPY does not work on a volatile single stock, and vice versa. That's the entire point of the table — to make those differences visible instead of assumed.
Key Inputs
EMA 1–5: Lengths for the 5 single-EMA strategies
Show EMAs: Plot EMAs on chart (off by default)
Use Lifetime Performance: Backtest from the very first bar instead of a fixed window
Performance Timeframe Type / Value: Weeks or Years lookback
Crosses group: Toggle GC/DC display, set fast/slow EMA lengths, customize colors
Table Style group: Position, text size, background and text colors
Notes & Limitations
All strategies are long-only — no shorts, no leverage, no stops, no commissions, no slippage. This is a clean rule-based comparison, not a turnkey trading system. Live results will differ.
Entries and exits use close prices, except for the GC/DC strategy's first-bar entry when already in a golden state, which uses open.
Open positions at the last bar are marked-to-market so the comparison vs. Buy & Hold is apples-to-apples.
Past performance is not indicative of future results. Use this as a research and screening tool.
The GC/DC strategy uses separate EMA lengths from the 5 table EMAs by design, so you can run 9/21/50/100/200 in the table while still testing the classic 50/200 cross.
Alerts Available
Golden Cross: Fast EMA crossed above Slow EMA
Death Cross: Fast EMA crossed below Slow EMA
If you find this useful, a boost is appreciated. Suggestions and feedback welcome in the comments.
Open-source — feel free to study, fork, and adapt. Indikator

Combined RSI + ADX/DI + Stochastic + EMA StackShort Description
A compact market structure indicator that combines EMA stack alignment, ADX/DI trend strength, RSI vs RSI SMA, Stochastic positioning, and an optional trend filter to present bull, bear, neutral, and no-trade conditions in a clear visual format.
Long Description
Combined RSI + ADX/DI + Stochastic + EMA Stack is a compact market-structure indicator designed to help traders evaluate directional alignment, trend strength, and momentum conditions in one place.
The indicator combines:
EMA stack alignment
ADX trend strength
DI directional confirmation
RSI relative to its SMA
Stochastic position above or below the midline
Optional trend filter using EMA 100 or EMA 200
How it works
The main structural check is the selected EMA stack. The user can choose how strict that stack should be, from a simple 9 > 21 relationship to a broader multi-EMA sequence.
A bullish state requires:
the selected EMA stack to be aligned bullish
ADX above the no-trade threshold
+DI above the DI threshold
RSI above its SMA
Stochastic above 50
price above the selected trend filter when the filter is enabled
A bearish state requires:
the selected EMA stack to be aligned bearish
ADX above the no-trade threshold
-DI above the DI threshold
RSI below its SMA
Stochastic below 50
price below the selected trend filter when the filter is enabled
A no-trade state appears when ADX is below the defined threshold. This helps filter out weaker market conditions where trend strength may not be sufficient.
How to read the panel
The compact panel is designed to make the current condition easy to understand at a glance.
Green indicates bullish alignment
Red indicates bearish alignment
Amber indicates a no-trade condition because ADX is below threshold
Neutral coloring indicates partial alignment, but not enough confirmation for a full bullish or bearish state
Each row shows the current value and whether that condition is currently supporting the active side.
Exit consideration
The script also includes stochastic-based exit context.
For long trades:
monitor when %K crosses below %D from an overbought area, typically above 80
this can indicate that bullish momentum is weakening
For short trades:
monitor when %K crosses above %D from an oversold area, typically below 20
this can indicate that bearish momentum is weakening
Suggested use
This indicator is best used as a trend-alignment and market-structure tool rather than as a standalone trading system. It can help traders:
identify whether bullish or bearish conditions are structurally aligned
avoid weaker market environments through the ADX no-trade filter
confirm direction with DI, RSI, and Stochastic
apply a broader directional bias using EMA 100 or EMA 200
monitor stochastic crossover conditions as possible exit considerations
Default settings are intended to provide a balanced starting point, while still allowing users to make the EMA stack and trend filter stricter or more flexible.
Notes
This indicator is intended for chart analysis and educational use. It should be used alongside broader market context, risk management, and personal trade planning.
Preferred time frame D or W chart for stocks.
Attribution
This script includes logic derived in part from “ADX Di+ Di- ” by gu5tavo71.
Original source:
www.safecreative.org
© gu5tavo71 (Gustavo Cardelle)
License notice provided by the original author:
Attribution-NonCommercial 4.0 International (CC BY-NC 4.0)
creativecommons.org
Summary of the author’s stated terms:
Share, copy and redistribute this script
Adapt, transform and build on this script
NonCommercial: You may not use the material for commercial purposes
Release Notes
Initial Release — Sam George
Combined RSI + ADX/DI + Stochastic + EMA Stack was created to make multi-factor trend alignment easier to read in a clear, compact format.
This first release includes:
Configurable EMA stack alignment for flexible trend structure analysis
ADX no-trade filter to help avoid weaker trend conditions
DI threshold confirmation for directional strength
RSI vs RSI SMA for momentum bias
Stochastic midline confirmation for additional trend alignment
Optional Trend Filter using EMA 100 or EMA 200
Compact state panel showing bull, bear, neutral, and no-trade conditions
Stochastic-based exit context for long and short trade management
Improved visual structure for faster decision support and easier interpretation
This version is intended to provide a structured view of market condition, trend quality, and alignment across multiple components in one place. Indikator

MA Cloud System by @cumacevikCustomizable MA Cloud System (Multi-Timeframe)
This premium Pine Script v5 indicator maps short, medium, and long-term market structures simultaneously using 4 independent moving averages and 3 distinct trend clouds.
Key Features:
Dual-Mode Timeframe (MTF): Scales automatically with your chart interval or locks to a specific macro timeframe (Daily, Weekly, etc.). Built-in lookahead protection guarantees zero data leak bias during backtesting.
EMA / SMA Selector: Toggle the entire calculation engine between EMA and SMA closing prices with a single click.
Granular Line Control: Customize each MA line independently—adjust period length, color, thickness (1−4px), and line typography (Solid, Dashed, or Dotted).
Fault-Tolerant Cloud Engine: Toggling a line off shifts its color to 100% transparency rather than dropping the data array. This prevents the clouds from fracturing, ensuring seamless visual trend tracking.
Clean UI Architecture: Zero clutter. All useless, anonymous checkboxes inside TradingView's "Style" tab are eliminated. Every control is cleanly organized within the primary "Inputs" panel. Indikator