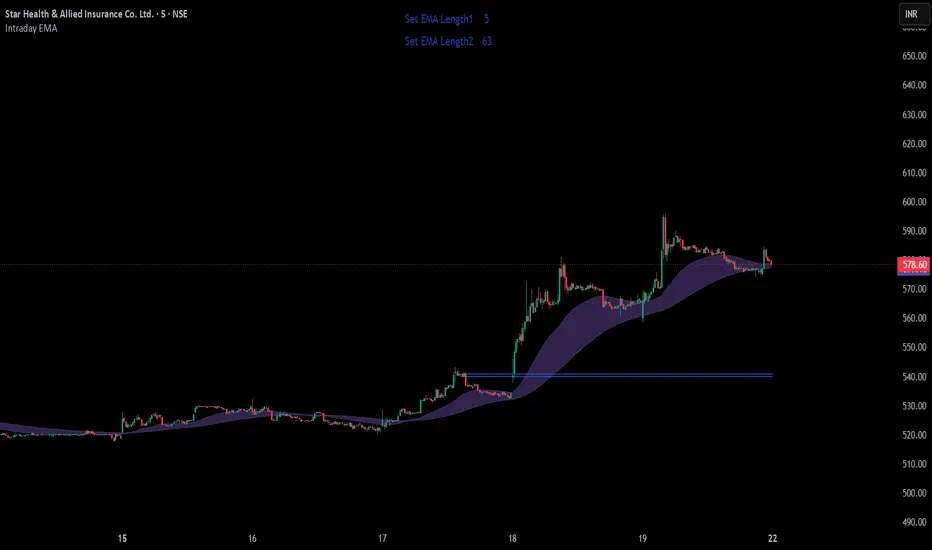
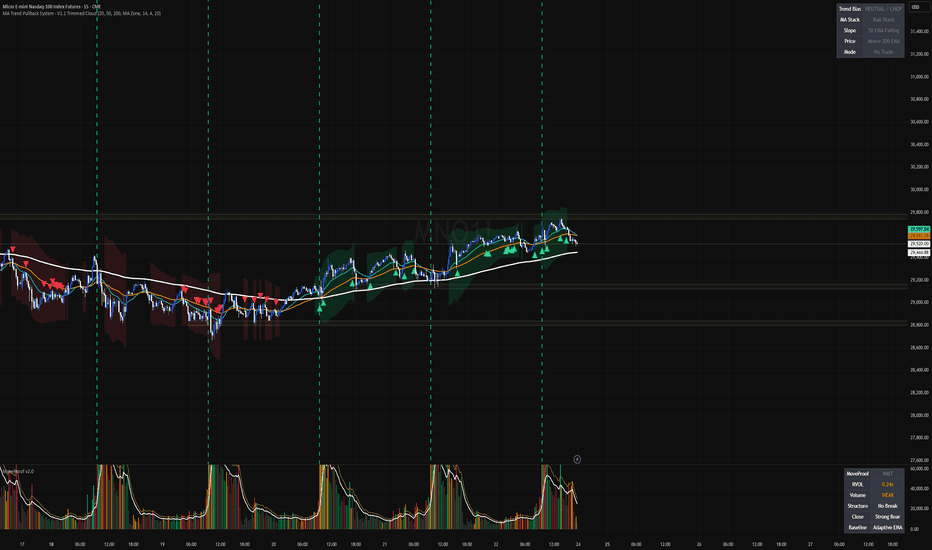
MA Trend Pullback System - V1.0This indicator was built for traders who like using moving averages as a simple way to read trend, direction, and pullback areas.
It uses the 20 EMA, 50 EMA, and 200 EMA to help separate cleaner trending conditions from choppy, low-quality price action. When the market is showing a strong bullish or bearish structure, the background will lightly shade green or red so the current bias is easy to see at a glance. When there is no background, that usually means conditions are mixed or choppy, and I personally treat that as a warning to slow down or stay out.
The arrows are designed to mark possible pullback-continuation areas. They are not meant to be automatic buy or sell signals. They are more of a heads-up that price has pulled back toward the moving-average zone and may be worth watching for confirmation.
I also added a dashed vertical line at the regular U.S. market open, 9:30 AM Eastern, because that is an important reference point for intraday trading and helps visually separate the premarket from the main session.
The basic idea is simple:
Trade with the trend.
Wait for price to pull back.
Look for confirmation.
Avoid chop.
Manage risk first.
This is meant to be a clean visual framework for building discipline around moving-average pullback trades, not a magic signal system. Use it alongside your own market structure, risk management, and trade plan. NOT FINANCIAL ADVICE Indikator
Indikator

MA Trend Pullback SystemMA Trend Pullback System
This indicator is built around a simple but powerful trading idea: use moving averages to define trend, avoid chop, and focus only on high-quality pullback continuation setups.
The system uses the 20 EMA, 50 EMA, and 200 EMA to identify bullish, bearish, or neutral market conditions. When the moving averages are stacked and sloping with clear direction, the indicator highlights the active trend bias and marks potential pullback zones where price may be setting up for continuation.
The goal is not to create blind buy/sell signals. Instead, this tool is designed to act as a disciplined visual framework for trend-following traders who want to filter out low-quality trades, avoid sideways markets, and focus on clean setups with strong risk/reward potential.
Core concept:
Trade with the trend.
Wait for the pullback.
Look for confirmation.
Avoid chop.
Protect capital first.
This is intended as a decision-support tool for developing a consistent moving-average-based trading process. Indikator

Indikator

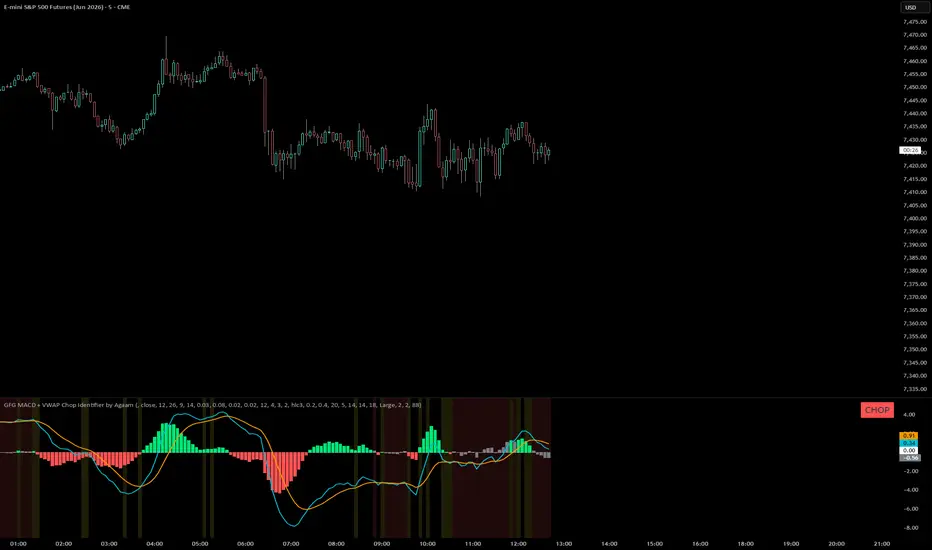
GFG MACD + VWAP Chop Identifier by Agaam**GFG MACD Chop Identifier + VWAP Filter by Agaam**
The GFG MACD Chop Identifier + VWAP Filter is designed to help traders recognize when MACD conditions are clean, cautious, or choppy. Instead of only showing a standard MACD, this indicator analyzes the behavior of the MACD line, signal line, histogram, ADX, and VWAP relationship to help identify when the market may not be offering a clean trading environment.
This indicator is especially useful for traders who want help avoiding low-quality setups, sideways movement, weak momentum, and fake MACD signals.
**What the indicator shows**
The indicator displays a MACD panel with:
* MACD line
* Signal line
* MACD histogram
* Zero line
* Chop-colored histogram
* Background warning colors
* Fixed top-right status badge
The status badge shows one of three conditions:
**CLEAN**
MACD conditions are stronger and cleaner. The market may have better directional movement.
**CAUTION**
Some chop or weakness is present. Traders may want extra confirmation before entering.
**CHOP**
MACD is compressed, flat, flipping too often, near the zero line, too close to VWAP, or showing weak trend conditions. This is a warning that the market may be messy or not ideal for trading.
**Main logic**
The indicator checks several conditions:
1. **MACD Histogram Compression**
If the histogram is very small compared to ATR, the market may be losing momentum.
2. **MACD Near Zero Line**
When MACD is close to the zero line, price may be in transition or chop.
3. **Flat MACD Slope**
If the MACD line is not moving strongly, momentum may be weak.
4. **Flat Signal Line**
A flat signal line can show low momentum or sideways action.
5. **Histogram Flip Chop**
If the histogram flips above and below zero too many times in a short period, the market may be choppy.
6. **ADX Weak Trend Filter**
Low ADX can suggest weak trend strength.
7. **VWAP Distance Filter**
If price is too close to VWAP, the market may be balanced or undecided.
8. **VWAP Cross Chop Filter**
If price crosses VWAP too many times, it may indicate sideways or messy price action.
**How to use it**
Use this indicator as a market-condition filter.
When the badge says **CLEAN**, the MACD environment may be better for looking for setups.
When the badge says **CAUTION**, wait for more confirmation from price action, supply/demand zones, VWAP, EMA trend, or higher timeframe direction.
When the badge says **CHOP**, consider avoiding new trades or reducing risk. CHOP does not mean price cannot move. It means the current MACD/VWAP structure may be lower quality, more mixed, or more likely to create false signals.
**Good use cases**
This indicator can help identify:
* Choppy MACD conditions
* Weak momentum
* Sideways price action
* Too many histogram flips
* VWAP balance zones
* Low ADX trend strength
* No-trade or caution environments
**Best used with**
This tool is best used together with:
* Supply and demand zones
* VWAP
* EMA 12/26 trend
* Market structure
* Higher timeframe bias
* Key levels such as ORB, premarket high/low, previous day high/low
* News awareness and risk management
**Important note**
This is not a buy or sell signal indicator. It is a condition filter. Its purpose is to help traders recognize when the market may be clean, cautious, or choppy.
**Disclaimer**
This indicator is for educational and informational purposes only. It is not financial advice, investment advice, or a recommendation to buy or sell any financial instrument. Trading stocks, futures, forex, crypto, and other markets involves risk, and losses can exceed expectations. Always use proper risk management, confirm signals with your own analysis, and trade at your own risk. Past performance does not guarantee future results.
Indikator

Indikator

Indikator

Indikator

Indikator

Bitcoin WMA Bands | Astral Vision Bitcoin WMA Bands | Astral Vision 💠🌠
This indicator constructs a volatility-adjusted band system around a Weighted Moving Average of price, using the standard deviation of logarithmic daily returns as the volatility measure rather than the standard deviation of price itself. The result is a channel whose width adapts dynamically to the current volatility regime, expanding during high-volatility periods and contracting during low-volatility ones, while remaining anchored to the WMA as the structural fair value reference.
Calculation ⚙️
The base reference line is a Weighted Moving Average of close over a configurable lookback in days. WMA weights recent bars more heavily than older ones using a linearly declining weight schedule, making it more responsive to recent price action than an SMA of the same length while being less erratic than an EMA.
The volatility measure is computed from logarithmic returns: for each bar, the log return is log(close / close ). The standard deviation of these log returns over a configurable lookback window is then multiplied by a configurable scale factor to produce the band half-width `s`. Using log returns rather than raw price changes ensures that the volatility measure is proportional across different price levels, making a 5% move at $10,000 and a 5% move at $100,000 contribute equally to the standard deviation.
The four bands are then computed as: band = WMA × exp(±n × s), where n is 1 or 2. The exponential transformation converts the log-space deviation back to price-space, ensuring the bands are multiplicatively symmetric around the WMA rather than additively symmetric. This means the upper and lower bands are equidistant in percentage terms rather than in absolute dollar terms.
The oscillator in the sub-panel is the log ratio of close to the WMA: log(close / WMA), which measures in log-space how far price has deviated from its trend. The same ±1σ and ±2σ levels are plotted in the sub-panel, allowing direct visual comparison of the oscillator's position within the band structure. Candles on the price chart are colored only when price is outside the ±1σ band, leaving them neutral in the fair value zone between the bands.
Crossover signals are generated when the oscillator crosses back inside the ±1σ boundary from outside: a triangle appears above the bar when the oscillator crosses back below the upper +1σ level from above, and below the bar when it crosses back above the lower -1σ level from below.
Plots 📊
WMA reference line on the price chart
Four volatility-adjusted bands at ±1σ and ±2σ on the price chart
Candle coloring on the price chart when price is outside the ±1σ band
Background color on the price chart between the ±1σ and ±2σ zones
Re-entry signals: triangle above bar on upper band exit, triangle below bar on lower band exit
Log-ratio oscillator in the sub-panel with matching ±1σ and ±2σ reference lines
Inputs 🎛️
STH Length: WMA lookback period in days
StDev Length: rolling window for the log return standard deviation
Band Scale: multiplier applied to the standard deviation before computing band width
Colors 🎨
5 Astral Vision presets + custom override. Default: Paradiso.
Purpose 🎯
Standard Bollinger Bands apply a fixed standard deviation multiple to a simple moving average computed on raw prices, which means the band width in percentage terms varies across different price levels and the bands do not correctly represent proportional deviations. This indicator applies the volatility measure in log-return space and converts back with the exponential function, producing bands that are geometrically consistent across Bitcoin's full price history. The WMA further reduces the lag of the central reference compared to an SMA, making the band system more responsive to trend changes without introducing the instability of shorter lookbacks.
Disclaimer ⭕️
This indicator is for informational and educational purposes only. It does not constitute financial advice. Past performance is not indicative of future results. Always do your own research before making investment decisions. Indikator

Multi-Timeframe MA Structure & RSI ConfluenceThis indicator combines multi-timeframe moving averages, RSI-based swing structure labels, and a compact RSI confluence panel into one chart overlay.
Features:
EMA/SMA 50 and 200 for 15m, 1h, 4h, Daily and Weekly timeframes
Optional automatic hiding of lower-timeframe MAs on higher-timeframe charts
EMA/SMA visual distinction using solid and dashed lines
RSI-based swing high/low labels: HH, HL, LH, LL
Developing swings marked with “?”
Structure-based label coloring: HH/HL green, LH/LL red
Regular bullish and bearish RSI divergence labels
Compact RSI panel showing RSI value, regime, momentum, RSI vs MA, recent MA cross and recent divergence
The indicator is designed as a visual market-structure and confluence tool. It does not generate buy or sell signals and should not be used as a standalone trading system.
The swing logic is inspired by RSI overbought/oversold cycle concepts originally published by BalintDavid. Indikator

Indikator

Indikator

Indikator

Indikator

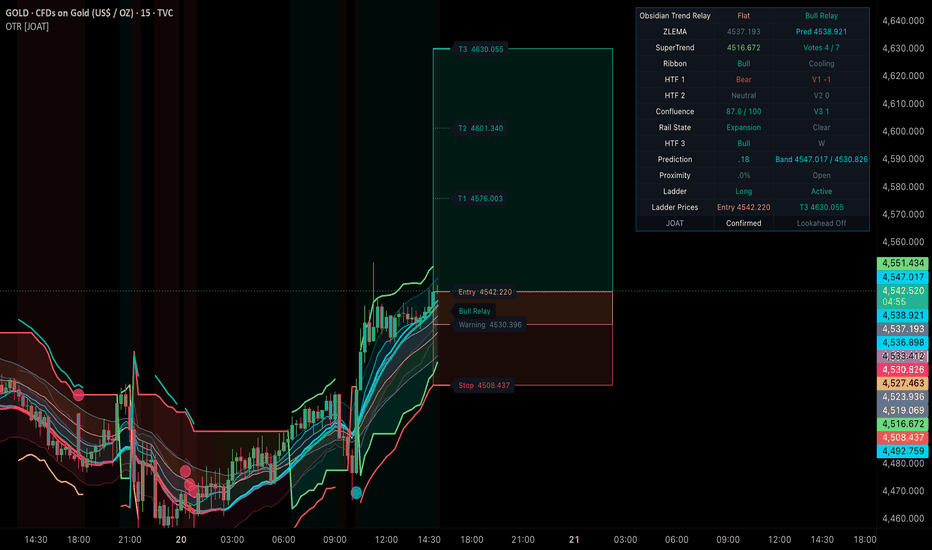
Obsidian Trend Relay [JOAT]Obsidian Trend Relay
Introduction
Obsidian Trend Relay is an open-source multi-timeframe trend and risk-ladder indicator. It combines zero-lag EMA logic, SuperTrend, an EMA ribbon, three higher-timeframe confirmation votes, prediction threshold rails, proximity warnings, candle coloring, risk ladder boxes, right-side price labels, and a top-right dashboard.
The script is built for users who want a directional trend context layer with structured visual planning. It does not claim to forecast price. Instead, it shows when local trend, ribbon structure, SuperTrend, and higher-timeframe votes align or conflict.
Core Concepts
1. Zero-Lag EMA Core
The zero-lag component reduces the smoothing delay of a standard EMA by comparing the first EMA against a second smoothing pass. This creates a responsive trend anchor used for reclaim and rejection logic.
// Conceptual summary
// zlema = 2 * ema(source, length) - ema(ema(source, length), length)
2. SuperTrend and EMA Ribbon
SuperTrend provides an ATR-based directional rail. The EMA ribbon checks whether fast, mid, slow, and base averages are stacked in directional order. Both must be read together with the zero-lag line.
3. Multi-Timeframe Relay Votes
Three higher-timeframe checks compare zero-lag and EMA structure using request.security() with lookahead off. The dashboard displays each vote and the total confluence score.
4. Prediction and Proximity Rails
The prediction engine creates upper/lower threshold rails around the trend anchor. Proximity warnings identify when price is near a key transition rail and may be close to a directional decision point.
5. Risk Ladder
When a relay signal appears, the script can draw a reward box, risk box, warning zone, entry, stop, and T1/T2/T3 rails. These are visual planning tools only.
Features
Zero-lag trend anchor: Responsive baseline for reclaim and rejection context
SuperTrend filter: ATR-based directional rail
EMA ribbon: Visual trend stack using multiple moving averages
Three HTF votes: Higher-timeframe confluence with lookahead off
Prediction rails: Upper/lower threshold bands around the zero-lag engine
Proximity warning: Highlights price near key trend rails
Risk ladder boxes: Draws risk, warning, reward, entry, stop, and T1/T2/T3 levels
Gradient candle tinting: Colors candles from confluence and trend state
Top-right dashboard: Shows local trend, ribbon, HTF votes, prediction, proximity, and ladder state
Confirmed-bar logic: Relay and ladder events use confirmed bars
Input Parameters
Trend Engine:
Source
Zero Lag Length
SuperTrend ATR Length
SuperTrend Factor
Ribbon Fast, Mid, Slow, and Base lengths
MTF and Risk:
Higher Timeframe 1, 2, and 3
Minimum Confluence Votes
Stop ATR Mult
Target ATR Mult
Show Risk Ladder
How to Use This Indicator
Step 1: Check confluence
Use the dashboard to see whether the local trend and higher timeframes agree.
Step 2: Read the ribbon
A clean stacked ribbon provides stronger trend context than a mixed ribbon.
Step 3: Watch proximity rails
Proximity warnings indicate price is near a transition threshold.
Step 4: Treat the ladder as a visual plan
The risk ladder maps possible risk and reward levels, but it does not execute trades or ensure outcomes.
Indicator Limitations
Higher-timeframe values can update during an unfinished higher-timeframe candle
Trend tools can lag during sharp reversals
Risk ladder levels are visual only
Sideways markets may generate mixed confluence readings
Originality Statement
Obsidian Trend Relay combines zero-lag trend anchoring, SuperTrend, EMA ribbon stacking, three higher-timeframe votes, prediction thresholds, proximity warnings, and managed risk ladders into one open-source Pine v6 trend relay. Its purpose is to organize trend alignment and risk visualization in one coherent chart layer.
Disclaimer
This script is for educational and informational use only. It is not financial advice or a promise of future results. Always use independent judgment and risk management.
-Made with passion by jackofalltrades
Indikator
Stochastic Bot with SL/TPStochastic Momentum Bot with Risk Management
Description
This trading bot is an automated strategy designed for TradingView. It aims to capitalize on short-term price reversals by identifying when an asset is temporarily "oversold" (priced too low) or "overbought" (priced too high) using the Stochastic Oscillator.
Unlike basic indicator scripts that simply highlight buy and sell signals on a chart, this is a full Strategy Script. This means it virtually executes trades using historical data, applying strict Stop-Loss (SL) and Take-Profit (TP) percentages to protect your capital.
It is highly customizable, allowing you to fine-tune the parameters to suit different assets and timeframes.
How the Logic Works
Entry (Buy): The bot enters a Long position when the %K line crosses above the %D line, but only if both lines are below the 20 threshold (indicating the asset is heavily oversold and momentum is shifting upward).
Exit 1 (Take Profit): The bot will automatically close the trade if the price rises by your set Take-Profit percentage.
Exit 2 (Stop Loss): The bot will automatically cut its losses and close the trade if the price drops by your set Stop-Loss percentage.
Exit 3 (Momentum Reversal): If neither the SL nor TP is hit, the bot will close the trade early if the %K line crosses below the %D line while above the 60 threshold (indicating the asset is overbought and momentum is dying).
Step-by-Step Guide to Using the Bot
Part 1: Loading the Script into TradingView
Open TradingView and load the chart you want to trade (e.g., TAO/USDT on the 15-minute timeframe).
At the very bottom of the screen, click on the Pine Editor tab.Delete any existing code in the editor window so it is completely blank.
Copy the Pine Script code provided previously and paste it into the editor.
Click the Save button (floppy disk icon) at the top right of the Pine Editor and give your script a name (e.g., "Stochastic Bot").
Click the "Add to Chart" button.
Part 2: Customizing the Strategy SettingsOnce the script is on your chart, a new menu will appear at the top left of your chart area with the name of your script.Hover over the script's name and click the Gear Icon (Settings).Click on the Inputs tab.
Here is what each setting controls:
Setting Name
Default
Description
%K Length14
The number of previous candles used to calculate the main momentum line.%K Smoothing3Smooths out the %K line to reduce false signals.%D Smoothing3The moving average of the %K line, used as the trigger line for crossovers.
Stop Loss (%)2.5
The maximum percentage of price drop you are willing to risk before exiting a trade.
Take Profit (%)6.0
The percentage of price increase required to automatically lock in profits and exit.
Part 3: Reading the Strategy Tester
Once the bot is on your chart, the Strategy Tester tab at the bottom of the screen will automatically populate with backtesting data based on your current settings and timeframe.
Net Profit: The total amount of money the bot made (or lost) over the given time period.
Total Closed Trades: How many times the bot bought and sold.
Percent Profitable (Win Rate): The percentage of trades that ended in a profit.
Max Drawdown: The largest percentage drop in your account balance from its peak. This is a crucial metric for understanding risk; a high drawdown means the bot experienced severe losing streaks.
List of Trades: A tab inside the Strategy Tester that shows you every single historical entry, exit, and the exact price it triggered at. Strategi

Helios Institutional Synthesis Strategy [JOAT]Helios Institutional Synthesis Strategy
Introduction
Helios Institutional Synthesis Strategy is an open-source Pine v6 strategy that integrates regime detection, trend bias, VWAP location, premium/discount context, liquidity sweeps, volatility gating, structured ATR stops, target levels, trailing exits, time exits, and visual trade-zone boxes.
The strategy is designed as a realistic testing framework, not a performance promise. It uses confirmed-bar triggers, process-on-close order handling, commission, slippage, risk sizing, and daily risk guard logic. The default settings were made active enough to generate more samples across timeframes while still keeping basic risk controls in place.
Core Concepts
1. Regime and Trend Bias
An adaptive baseline, EMA momentum, DMI/ADX, and volatility score determine whether the market is bullish, bearish, or ranging. Long setups require bullish context, and short setups require bearish context unless other confluence factors compensate.
2. VWAP and Premium/Discount Context
The strategy compares price to session VWAP and to a rolling premium/discount range. This helps distinguish continuation entries from recovery or rejection setups.
3. Liquidity and Retest Triggers
Confirmed sweeps, daily level reclaims/rejections, VWAP bounces, baseline crosses, and channel reclaim/rejection logic can contribute to entries. This creates more than one path into a trade while still requiring a confluence score.
4. Volatility and Risk Gates
The strategy filters by volatility score, ATR percent of price, daily equity guard, and minimum planned R. These controls are included to avoid unbounded entries in abnormal conditions.
5. Structured Exits
Stops use ATR and recent key levels. Targets use ATR multiples. A trailing stop can tighten the exit as price moves, and a max-hold rule can close trades that remain open too long.
Default Strategy Properties
Initial capital: 100000
Commission: 0.01 percent
Slippage: 1 tick
Pyramiding: 0
Orders processed on close: true
calc_on_every_tick: false
Default risk per trade: 1.0 percent
Default minimum confluence score: 4 out of 8
Default cooldown: 4 bars
Default ATR stop multiple: 1.8
Default ATR target multiple: 2.8
Default trailing ATR multiple: 1.35
Default daily equity guard: 3 percent
Features
8-point confluence model: Combines regime, VWAP, premium/discount, momentum, volatility, sweeps, squeeze release, and HTF bias
Confirmed-bar entries: Long and short triggers use barstate.isconfirmed
HTF confirmation: Uses request.security() with lookahead off and previous higher-timeframe values
Risk-based sizing: Calculates quantity from equity, stop distance, and risk percentage
ATR stop and target: Structured stop/target logic with optional trailing behavior
Daily guard: Blocks new trades after a configured intraday equity drawdown threshold
Max-hold exit: Closes positions that exceed the configured bar count
Trade-zone boxes: Shows reward/risk boxes on the chart
Right-side risk rails: Labels active entry, stop, target, and R:R
Dashboard: Shows regime, position, confluence, risk gate, setup, volatility, VWAP sigma, liquidity, HTF bias, PD state, session, day guard, hold bars, stops, and key levels
Input Parameters
Core Engine:
Adaptive Baseline Length
Efficiency Lookback
ATR Length
ADX / DMI Length
Institutional Anchor Length
Confirmation Timeframe
Filters:
Enable Longs and Enable Shorts
Restrict to Session
Min Confluence Score
Cooldown Bars
Volatility score bounds
Risk Controls:
Risk percent per trade
ATR stop, target, and trailing multiples
Minimum planned R multiple
Max ATR percent of price
Daily equity guard percent
Max hold bars
How to Use This Strategy
Step 1: Start with a private draft
Before publishing results, test the strategy privately and verify the chart, settings, and description.
Step 2: Use realistic costs
The script defaults to 0.01 percent commission and 1 tick slippage. Adjust them to match the market being tested.
Step 3: Check sample size
Use enough historical data to evaluate whether the strategy has a meaningful number of trades. Avoid drawing conclusions from a small sample.
Step 4: Review the dashboard
The dashboard shows whether a blocked trade is caused by risk, volatility, session, confluence, or daily guard logic.
Strategy Limitations
Backtests are hypothetical and do not ensure future results
Performance can vary significantly by symbol, session, timeframe, and cost settings
The strategy may trade frequently on lower timeframes; costs and slippage matter
HTF confirmation uses non-lookahead requests, but higher-timeframe context can still evolve while a higher-timeframe bar is unfinished
Risk controls reduce some bad conditions but cannot remove market risk
Originality Statement
Helios Institutional Synthesis Strategy combines adaptive regime detection, VWAP sigma location, premium/discount context, liquidity sweep triggers, squeeze state, higher-timeframe confirmation, risk-based sizing, ATR exits, daily guard logic, time exits, and visual trade-zone mapping in one open-source Pine v6 strategy. Its purpose is to test a multi-factor decision process with transparent components rather than present a black-box signal system.
Disclaimer
This strategy is for educational and informational use only. It is not financial advice, and backtested results do not ensure future performance. Trading involves substantial risk of loss. Always test with realistic commissions, slippage, and position sizing before making any decision.
-Made with passion by jackofalltrades
Strategi

Indikator
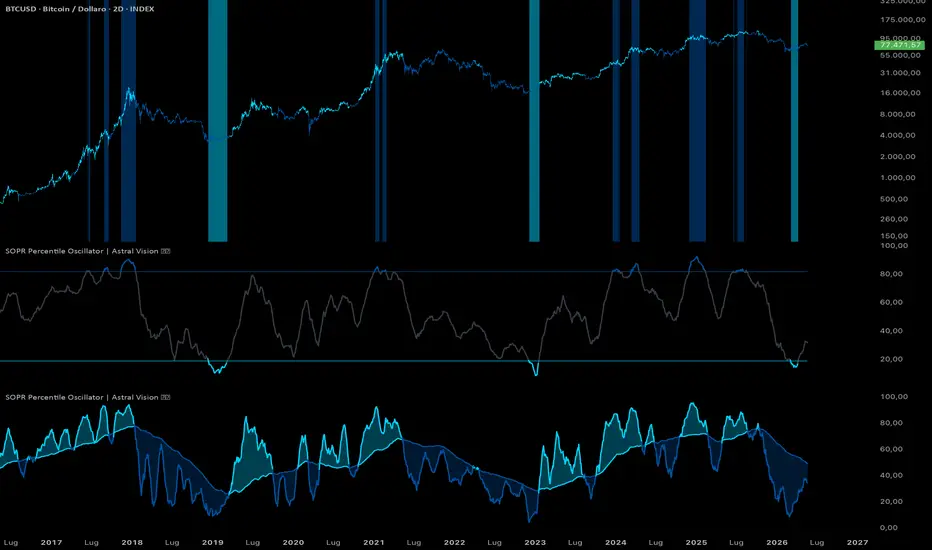
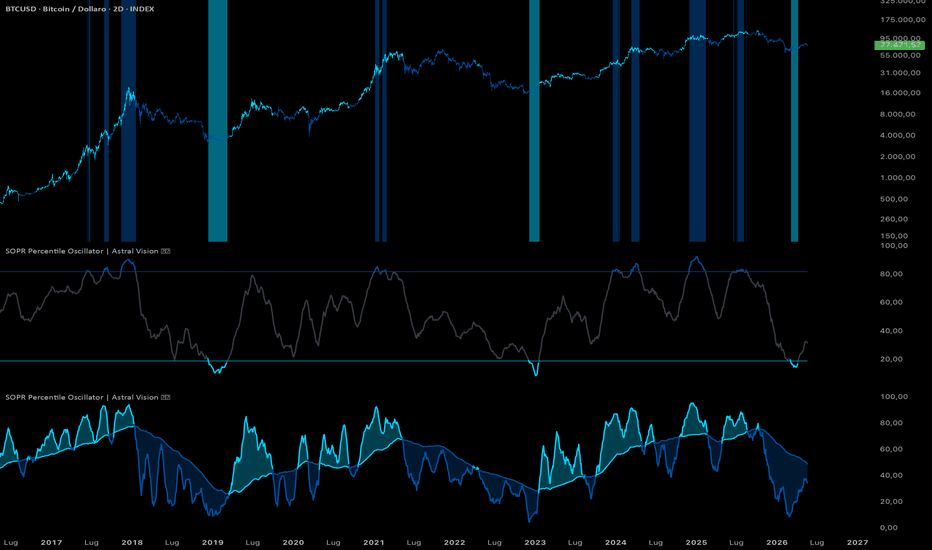
SOPR Percentile Oscillator | Astral Vision SOPR Percentile Oscillator | Astral Vision 🌠💠
This indicator transforms the Spent Output Profit Ratio into a percentile-ranked oscillator, measuring where today's SOPR reading sits relative to its own history over a configurable lookback window. SOPR is an on-chain metric that divides the realized value of all Bitcoin outputs spent on a given day by their value at the time they were created: a reading above 1.0 means coins are being sold at a profit on aggregate, below 1.0 means coins are being sold at a loss.
Calculation ⚙️
The raw SOPR is fetched from Glassnode on a daily timeframe. A percentile rank is then computed over a configurable lookback window using `ta.percentrank`, which counts how many of the past N values are lower than the current value and expresses the result as a percentage from 0 to 100. A reading of 85 means the current SOPR is higher than 85% of all daily readings over the lookback period, placing it in historically elevated territory. A reading of 15 means SOPR is lower than 85% of historical readings, placing it in historically depressed territory.
Two simple moving averages are applied to the percentile rank series: a short-term SMA over a configurable window (default 30 days) that captures recent momentum, and a long-term SMA over a configurable window (default 365 days) that represents the structural trend of the percentile rank. The short-term SMA is the primary signal line; the long-term SMA is used in Trend mode as the reference for directional classification.
The indicator operates in two modes.
Extremes mode colors the oscillator neutrally between the configurable overbought and oversold percentile thresholds, and highlights only when the short-term SMA enters one of the two extreme zones, also applying background color to the price chart.
Trend mode compares the short-term SMA against the long-term SMA: when the short is above the long, the regime is bullish; when below, bearish. A fill between the two lines visually represents the spread between short and long-term percentile positioning.
Plots 📊
Short-term SMA of the SOPR percentile rank, colored by mode and regime
Long-term SMA of the SOPR percentile rank (Trend mode only)
Fill between short and long-term SMA (Trend mode only)
Overbought and oversold percentile threshold lines (Extremes mode only)
Background color on the price chart when short SMA enters extreme zones (Extremes mode)
Candle coloring on the price chart reflecting current regime in both modes
Inputs 🎛️
Mode: Extremes or Trend
Short Term SMA: smoothing window applied to the percentile rank for the signal line
Long Term SMA: smoothing window for the structural trend reference
Lookback: historical window for the percentile rank computation
Overbought Threshold: upper percentile level marking historically elevated SOPR
Oversold Threshold: lower percentile level marking historically depressed SOPR
Colors 🎨
5 Astral Vision presets + custom override. Default: Paradiso.
Purpose 🎯
Raw SOPR fluctuates around 1.0 on an expanding scale as Bitcoin matures, making fixed absolute thresholds unreliable across different market cycles. Converting to a percentile rank normalizes the series against its own historical distribution, so a percentile reading of 85 in 2017 and a reading of 85 in 2024 are statistically equivalent statements about how extreme current on-chain profit-taking behavior is relative to its own history. The dual SMA structure further separates short-term extremes from structural regime shifts, which are analytically distinct signals that a single moving average cannot distinguish.
Disclaimer ⭕️
This indicator is for informational and educational purposes only. It does not constitute financial advice. Past performance is not indicative of future results. Always do your own research before making investment decisions. Indikator
MTF MA System by ogudora# MTF MA System by ogudora
A multi-timeframe moving average indicator designed for traders who need to read multiple MAs at a glance without losing track of which line belongs to which timeframe.
## What it does
Plots short, mid, and long-term moving averages from up to four timeframes simultaneously: the current chart timeframe, 1H, 4H, and Daily. Each line is identified by three independent visual dimensions:
- **Color** indicates the period (short / mid / long)
- **ATR-based halo width** indicates the timeframe (higher TF = wider halo)
- **Line style and thickness** add another layer of timeframe distinction
This three-axis encoding eliminates the common problem of MTF MA indicators where users lose track of which line is which.
## Key features
**RTH-only calculation by default.** Upper timeframe MAs are calculated using Regular Trading Hours data only, independent of the chart's Extended Hours setting. This ensures that the same MA value appears regardless of which timeframe chart you are viewing. ETH-inclusive mode is available as a toggle.
**ATR-based halo bands.** Instead of a single thin line, each MA is drawn with a translucent halo whose width scales with current ATR. Higher timeframes get wider halos, so a daily MA visually feels like a zone, while a 1H MA reads as a precise line.
**Per-timeframe line thickness and style.** Each TF group has independent settings for line thickness (1 to 4) and style (plain / stepline / stepline with diamonds). The default uses a diamond stepline for 4H to give it a distinctive "ladder" appearance.
**Keep-out labels.** Optional labels along each MA line at regular intervals, useful for marking visual zones across the chart.
**Auto TF filtering.** Lower timeframe MAs are automatically hidden when you switch to a higher chart TF, preventing visual clutter on long-term charts.
## Default configuration
- **MA type:** EMA, periods 20 / 50 / 200
- **Timeframes:** 1H, 4H, Daily (current chart TF off by default)
- **Session:** RTH only
- **Colors:** magenta (short) / green (mid) / purple (long)
- **Halo widths:** 1H = 0.1×ATR, 4H = 0.1×ATR, Daily = 0.4×ATR
- **Line thickness:** 1H = 3, 4H = 1, Daily = 3
- **4H line style:** stepline with diamonds
These defaults are tuned for U.S. equities and Japanese equities on intraday-to-swing timeframes. All values are user-configurable.
## Notes on session handling
For U.S. stocks, the 4H EMA200 calculated from RTH data and from ETH-inclusive data can differ by 10–15% during volatile periods. The default RTH mode aligns with how most institutional desks read moving averages. If you trade extended-hours moves and prefer ETH-inclusive calculation, toggle the session setting in the indicator inputs.
## Compatible markets
Designed and tested on U.S. equities (NASDAQ, NYSE) and Japanese equities. Should work on any symbol where the underlying exchange has a defined Regular Trading Hours session.
## Why I built this
After years of running MTF MA indicators that became unreadable once more than four or five lines were on screen, I wanted a system that uses encoding redundancy — color, halo width, and line style — so that any single line could be identified without reading its legend. This indicator is the result of that iteration.
Feedback and suggestions are welcome. Indikator

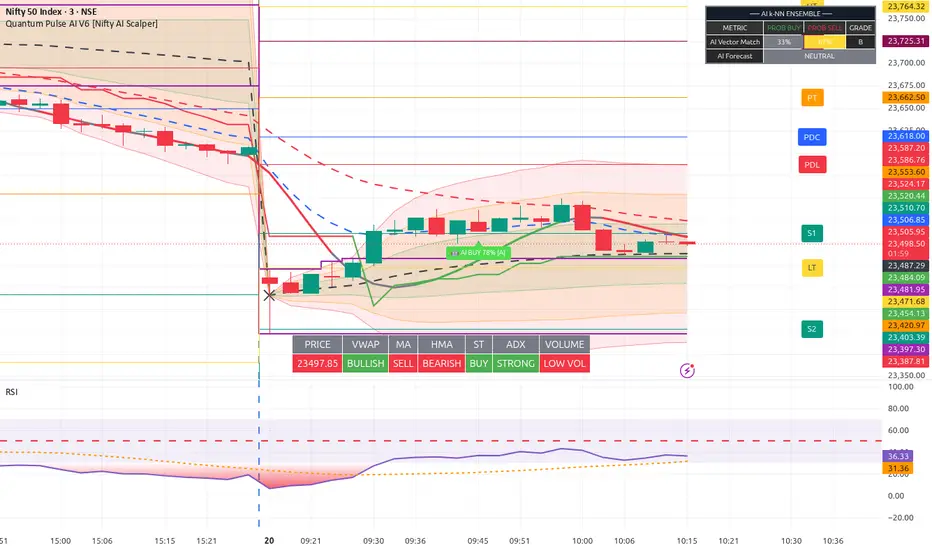
Quantum Pulse AI V6 [Nifty AI Scalper]High-Level Overview
This script is a hybrid trading system that combines traditional trend-following indicators with a k-Nearest Neighbors (k-NN) Machine Learning engine. Instead of relying solely on hardcoded crossovers, it looks at the current market conditions, searches its historical memory for similar moments, and predicts the next move based on what happened in the past.
1. The Technical Foundation (Base Features)
Before the AI even kicks in, the script tracks a robust baseline of institutional-grade metrics:
Moving Averages: Two customizable MAs (SMA/EMA/VWMA) determine short-term momentum.
VWAP & Bands: Anchored daily VWAP with up to 3 standard deviation bands to judge institutional value and overbought/oversold extremes.
Trend Smoothing: Hull Moving Average (HMA) and Supertrend dictate the broader directional bias.
Momentum Filters: ADX ensures the market is actually trending (ignoring chop), while relative volume tracks participation.
2. The AI k-NN Classification Engine
This is the "brain" of the script. It uses a mathematical algorithm to predict price direction based on Euclidean geometry.
Feature Vectors: It takes 4 real-time data points (MA spread, Price vs. VWAP, HMA slope, and Relative Volume) and normalizes them into a 4-dimensional spatial grid.
Historical Scanning: The script looks back in time (e.g., 2,000 bars) and calculates the exact geometric distance between the current market conditions and historical market conditions.
Voting System: It isolates the k closest historical matches (e.g., the 8 most similar moments in the past). It then looks at what price actually did next in those historical moments (went up or went down). Those neighbors "vote" on the current probability, generating a Bull/Bear Confidence Percentage.
3. Signal Filtering & State Tracking (Anti-Flicker)
The script includes strict logic to prevent chart clutter and false signals:
Convergence: A signal will only fire if the AI probability is above your defined threshold (e.g., 70%), the ADX shows a strong trend, and price is structurally on the correct side of the VWAP.
State Tracker: A built-in memory state (currentTradeState) forces strict alternation. Once an "AI BUY" fires, the system locks into a Long state. It will ignore any duplicate bullish spikes and will only fire again when an "AI SELL" conditions are met.
4. Dashboards & UI
Core Dashboard: A bottom-center panel that gives a rapid visual summary of all traditional metrics (Price, VWAP, MA, HMA, ST, ADX, Volume).
ML Ensemble Panel: A top-right heads-up display showing the AI's exact live confidence percentages, its grading scale (A+, A, B, C), and the current active forecast.
Day Trading Extras: Automatically plots Previous Day High/Low/Close, daily Pivot points, Support/Resistance levels, and the critical First 15-Minute High/Low breakout zones. Indikator

Indikator