DAO GAM Reversal StructureBX Reversal Structure - Adaptive Top and Bottom is a market-structure indicator designed to identify potential horizontal reversal structures formed by two significant swing areas, referred to as A and B.
The indicator analyzes both top structures and bottom structures.
For a top structure, the script looks for an upward price phase followed by a meaningful rejection. It uses the high and close of the final bullish anchor candle to define a price zone around the swing high.
For a bottom structure, the logic is reversed. The script looks for a downward price phase followed by a meaningful recovery and uses the low and close of the final bearish anchor candle to define the swing-low zone.
When two valid zones, A and B, share an overlapping price area, the script attempts to determine a horizontal reference level called X.
The X level is selected so that it remains within the common price area of A and B while avoiding the interior of candle bodies located between the two structures. Wick interaction with X is permitted.
This approach is intended to distinguish meaningful horizontal market structures from simple price equality between two isolated swing points.
Main concepts
The indicator evaluates several structural conditions, including:
Minimum price movement into and away from each swing.
A minimum number of candles forming the directional phase before and after the swing.
Overlap between the price zones of A and B.
Candle-body interaction between A and B.
Separation between the two swing areas.
Distance and spacing between A and B.
Additional interactions with the X level after the structure is formed.
The indicator can detect:
Top structures: potential resistance or reversal structures.
Bottom structures: potential support or reversal structures.
Adaptive mode
The indicator includes an adaptive mode based on ATR (Average True Range).
Instead of relying exclusively on fixed price distances, ATR-based thresholds can automatically scale according to the volatility of the current symbol and timeframe.
This allows the indicator to be tested on different markets and timeframes, including forex, metals, cryptocurrencies, indices and other instruments available on TradingView.
A manual mode is also available for users who prefer fixed parameter values.
A, B and X
A represents the first qualified swing structure.
B represents a later qualified swing structure that shares a valid price area with A.
X is the horizontal reference level calculated from the overlapping zones of A and B.
Additional qualified interactions with the same level may be displayed as C, D, E or subsequent touches.
For top structures, X acts as a horizontal resistance reference.
For bottom structures, X acts as a horizontal support reference.
Line behavior
After a valid A-B structure is detected, the X line is extended to the right.
The visual line stops when a future candle body reaches the X level. Candle wicks alone do not necessarily stop the line.
The script may also generate a CHECK condition when price moves a specified distance beyond X within the configured monitoring period.
These signals indicate that the predefined structural condition has occurred; they are not automatic trading orders.
How to use
Users can apply the indicator directly to a chart and choose between:
AUTO (ATR): parameters adapt to current market volatility.
MANUAL: price-distance parameters are entered manually.
Because volatility and market structure differ significantly between instruments and timeframes, users should evaluate the parameters on the specific market they intend to analyze.
The indicator is intended primarily as a market-structure visualization and research tool. It can be combined with independent analysis of trend, volatility, liquidity, risk management and broader market context.
Original concept
The central idea of this indicator is that a horizontal resistance or support structure should not necessarily be defined by two identical highs or lows.
Instead, each swing is represented as a price zone between the close and the extreme of its anchor candle.
The indicator searches for the common price area between two qualifying zones and then determines a horizontal level that respects candle-body structure between them.
This zone-overlap and candle-body approach is the main structural concept used by the script.
Limitations
This indicator does not predict future market direction and does not guarantee that a detected support or resistance structure will produce a reversal.
Pivot-based structures require subsequent candles for confirmation, so signals are identified only after sufficient market data becomes available.
ATR adaptation improves portability between instruments and timeframes, but no single parameter configuration can provide identical behavior across all markets.
Low-liquidity instruments, gaps, unusually volatile market conditions and different data feeds may produce different results.
Historical structures should not be interpreted as evidence of future profitability.
Users should independently evaluate the indicator and apply appropriate risk management before making trading decisions. Indikator

Parabolic SAR Constraint Kinematics & Run GeometryOverview
Parabolic SAR Constraint Kinematics & Run Geometry studies how a continuing Parabolic SAR step is formed and how the surrounding run develops. It keeps TradingView's ta.sar() as the plotted SAR series and adds measurements of the run's Extreme Point, remaining Arc, acceleration-factor progression, and prior-two-bar price constraint.
The central distinction is between the free parabolic candidate and the candidate after the two-bar constraint. The script measures how much movement the constraint removes, how much movement remains, and how frequently material constraints occur within a fully observed run. A synchronization check compares the reconstructed candidate with ta.sar() before exposing the related constraint percentages.
The PSAR formula itself is standard. The added functionality is the coordinated measurement of its step mechanics, run-relative geometry, observation completeness, and bounded run history. The indicator does not adapt the PSAR formula, filter its side changes, optimize parameters, or rank trading opportunities.
Chart layers
The default display contains the canonical SAR dots, an Extreme Point trace, a translucent SAR-to-Extreme-Point Arc, small side-change markers, yellow material-constraint halos, and a compact upper-right panel.
Cyan and pink distinguish the tracked SAR-below and SAR-above run states. Green and amber distinguish the corresponding Extreme Point traces. Colors and visibility are configurable. These colors describe tracked states; they do not prescribe an action.
The Extreme Point is the highest observed high in a SAR-below run or the lowest observed low in a SAR-above run. It is updated according to the selected confirmation setting.
Optional layers include the free candidate point, the constraint bridge, an Arc midline, the current run's origin line, descriptive event markers, and completed-run summaries. These additional layers are disabled by default to avoid crowding the chart. The bridge compares the free candidate with the plotted SAR on materially constrained bars after the synchronization check; the reconstructed guarded candidate can differ from the plotted SAR by the permitted tolerance.
Reading the compact panel
The default layout remains a three-row grid. Abbreviated captions and reduced spacing save horizontal space without changing the measurements or their numeric precision.
STATE: BELOW or ABOVE means the tracked SAR side relative to price. FULL means the run's beginning was observed; PARTIAL means tracking began during an existing run. TIGHT identifies the contracted-Arc state. SYNTHETIC identifies a non-standard chart.
RUN: An example such as "11b ✳3 ∥4" means 11 bars in the tracked run, three Extreme Point updates, and four bars since the last Extreme Point update. The star identifies updates; the parallel strokes identify elapsed bars without an update.
ARC: Current normalized SAR-to-Extreme-Point distance, followed by Arc Retention.
STEP: Absolute one-bar SAR movement, followed by that movement as a percentage of the remaining Arc. This percentage is a geometric ratio, not a return or probability; it is not capped at 100%.
MOTION: Mechanical state, TX percentage, observed AF, and synchronization symbol. TX means Step Transmission. For example, "FREE TX100.0% AF0.08" indicates an observed FREE state, transmission of 100.0% of the reconstructed free step, and an observed AF of 0.08.
CODE: The four-axis run signature and completed-run count. CODE is the compact label for the run signature, not a trading signal. The suffix n20 means 20 completed full runs are retained for the duration/brief-run history. When the signature display is disabled, HIST shows the sample count, average duration in bars, and brief-run share instead.
Hovering over the cells reveals definitions, the processing scope, reconstruction error, constraint percentages, recent recorded signature states, and rolling history summaries. The panel shows the latest execution state; moving the cursor over an older bar does not make the panel display that bar's historical state. Extended Data Window output can be enabled for historical numeric inspection inside the research window.
Arc and distance units
Arc = abs(Current SAR - Tracked Extreme Point)
Arc Retention = 100 x Current Arc / Widest Arc recorded in the same tracked run
A lower retention value means the current Arc is narrower relative to that run's widest recorded Arc. It does not establish that a price reversal is approaching.
Distance units are selectable: ATR at run start, percent from run origin, minimum ticks, or raw price. The ATR-style normalizer smooths true range using RMA, SMA, EMA, or WMA. The range used for normalization is captured when tracking of the run begins, and percent distances use the absolute close captured as the run origin. In a PARTIAL run, these references belong to the first tracked bar, not the unknown actual beginning of the run.
Normalization and optional marker spacing do not alter the canonical SAR calculation.
Tight Arc and re-expansion
After the configured minimum run age, TIGHT is entered when Arc Retention is at or below the selected contraction threshold. Defaults are five bars and 35% retention.
The contracted state is released only after a new Extreme Point appears and retention reaches the contraction threshold plus the selected hysteresis, capped at 100%. Default hysteresis is 20 percentage points, giving a default release level of 55%.
The two thresholds reduce repeated state changes near a single boundary. TIGHT is a latched run state, so a retention value above the entry threshold does not by itself end that state. Neither contraction nor re-expansion forecasts a future market event.
Observed acceleration factor
Observed AF = min(Starting AF + Recorded EP Updates x AF Increment, Effective Maximum AF)
AF Progress = 100 x (Observed AF - Starting AF) / (Effective Maximum AF - Starting AF)
Defaults are 0.02 for the starting factor, 0.02 for the increment, and 0.20 for the maximum. If the entered maximum is below the starting factor, the effective maximum is raised to the starting factor. When both are equal, AF progress is represented as 100%.
The observed AF is reconstructed from the tracked Extreme Point sequence. It is not an independently exposed internal AF series supplied by ta.sar(). Partial-run values do not recover unobserved pre-window updates.
Free candidate and two-bar constraint
The reconstruction is attempted on eligible continuing bars of FULL runs, with the required prior values available and the current raw SAR side agreeing with the tracked run.
Free Candidate = Previous SAR + Previous Observed AF x (Previous Tracked EP - Previous SAR)
For a SAR-below run:
Guarded Candidate = min(Free Candidate, Previous Low, Low Two Bars Ago)
For a SAR-above run:
Guarded Candidate = max(Free Candidate, Previous High, High Two Bars Ago)
The resulting guarded candidate is compared with the current ta.sar() value. The default permitted difference is two minimum ticks; the tolerance is adjustable and includes a small numerical floor.
If the reconstruction is outside tolerance, the state becomes CHECK and Constraint Load and TX are unavailable. If the bar is not eligible, the state is INIT. A successful check establishes agreement within the selected tolerance on that bar, not exact recovery of every internal PSAR state or independent validation of the model.
Constraint Load and Step Transmission
Free Step = abs(Free Candidate - Previous SAR)
Removed Distance = abs(Free Candidate - Guarded Candidate)
Constraint Load = 100 x Removed Distance / Free Step
TX measures the guarded directional step as a percentage of the free directional step. Direction here means the mechanical direction of the tracked PSAR run, not a proposed trade.
TX = 100 x Guarded Directional Step / Free Directional Step
The displayed constraint percentages require synchronization and a valid positive denominator. They are bounded between 0% and 100%. In ordinary eligible cases, they describe the removed and transmitted portions of the reconstructed step. A zero or invalid denominator produces unavailable data rather than an invented percentage.
A measurable constraint requires both a removed distance of at least one quarter of a minimum tick and Constraint Load of at least 1%. A material constraint additionally requires the user-selected materiality threshold, which defaults to 12.5%.
MOTION states and symbols
INIT: The current bar is not eligible for the continuing-run reconstruction, including during partial tracking or at the start of a run.
CHECK: The guarded candidate differs from ta.sar() by more than the permitted tolerance.
FREE: The measurable-constraint conditions are not satisfied. This includes effects below the residual or load thresholds, not necessarily a mathematically exact zero effect.
TRACE: A measurable constraint exists, but its load is below the materiality threshold.
BRAKE: A material constraint exists and the guarded directional step remains greater than one quarter of a minimum tick.
PINNED: A material constraint exists and the guarded directional step is at or below that quarter-tick threshold.
The check mark means agreement within tolerance; the exclamation mark means outside tolerance; the ellipsis means not yet eligible. None is a confidence rating or market recommendation.
Yellow halos and run occupancy
A yellow halo identifies a bar meeting the synchronized material-constraint conditions. It marks a mechanical effect on the PSAR step, not an entry, exit, reversal prediction, target, or stop.
Run Constraint Occupancy = 100 x Materially Constrained Counted Bars / Synchronized Counted Bars
The counts follow the selected confirmation setting and exclude the side-change bar. Under the default setting, they are committed at bar close. The percentage measures how frequently the guardrail materially affected the eligible observations in that run, not the probability of a future outcome.
Run signature: A, F, P, C
An example code is A3·F2·P2·C0.
A is Arc Retention.
F is observed AF Progress.
P is Extreme-Point Pause Share: 100 x Bars Since Latest EP / (Run Age - 1), with zero used at age one.
C is current Constraint Load.
A, F, and P use four fixed percentage bands:
1: below 25%
2: 25% to below 50%
3: 50% to below 75%
4: 75% or higher
C uses:
C0: valid load below 1%
C1: 1% to below 25%
C2: 25% to below 50%
C3: 50% to below 75%
C4: 75% or higher
C-: Constraint Load is unavailable
C- can occur because the bar is ineligible, synchronization fails, or the denominator is invalid. When no complete signature can be formed, placeholder bands are shown. C is based on the numeric load, whereas MOTION also applies the quarter-tick residual test and the selected materiality threshold; the two displays need not change together.
A3·F2·P2·C0 therefore describes retention from 50% to below 75%, AF progress from 25% to below 50%, pause share from 25% to below 50%, and valid constraint load below 1%.
These are fixed ranges, not sample quartiles, learned regimes, rankings, or probabilities. The code helps compare similarly structured observations without implying similar future outcomes. Up to three recent distinct synchronized signature observations are available in the tooltip; this is not an automatic historical pattern search.
FULL, PARTIAL, and completed-run history
A FULL run begins at an observed SAR side change inside the research window. A PARTIAL run was already underway when tracking began. Only completed FULL runs enter the rolling history.
The memory setting defaults to 20 and accepts 3 to 100 runs. Duration and brief-run history retain the latest completed full runs. The brief threshold defaults to four bars or fewer.
Constraint-occupancy history accepts only completed full runs with a valid occupancy value. Runs without that value are skipped for this particular average, so its sample can differ from the duration/brief-run sample.
Optional completed-run labels also show EP updates, time at the maximum observed AF stage, constraint occupancy, and tight-Arc episode count. These summaries describe completed observations, not simulated transactions.
Research window and runtime
Recent bars is the default scope. The custom research window defaults to 3,000 bars and can be set from 500 to 50,000. All available bars removes that custom limit, subject to the history available on the chart.
The boundary is fixed when the script loads or recalculates. Subsequent realtime bars are included; the window is not a continuously sliding hard cap. Reloading or changing an input rebuilds it.
Before the boundary, canonical ta.sar() and the selected normalizer still evaluate to provide continuous underlying series. The window limits custom run analysis, reconstruction, history, events, and plotted research output; it is not Pine's native calc_bars_count restriction and does not prevent every underlying calculation from running on earlier bars.
Larger windows and All available bars can increase runtime. Use a smaller window if a runtime warning occurs. This is a research and resource setting, not an access restriction.
Controls and alerts
Users can change the research scope, PSAR factors, confirmation behavior, normalization, history length, constraint threshold, synchronization tolerance, visual layers, marker limits, panel layout and position, right-edge clearance, text size, bold formatting, and colors.
Alerts are disabled by default. Available conditions report a SAR side change, Arc contraction, Arc re-expansion, the onset of a material constraint, an age milestone, the observed AF maximum, an EP pause, or completion of a brief full run. They do not specify trading actions.
Extended Data Window output is also disabled by default. Enabling it exposes additional numeric series without changing the underlying measurement rules.
Suggested research workflow
Start on a standard candlestick or bar chart with default settings. Identify the SAR dots, Extreme Point trace, and Arc before reading the panel. Check FULL or PARTIAL, inspect ARC and STEP, and then use MOTION and its tooltip to examine the reconstructed constraint.
For a worked mechanical example, a free directional step of ten ticks reduced to six ticks has a four-tick removed distance: Constraint Load is 40% and TX is 60%, provided the guarded candidate synchronizes and the other eligibility conditions hold. This example explains the arithmetic; it does not describe a trading result.
Use CODE to compare descriptive states, or enable the candidate point and bridge for closer mechanical inspection. Keep the symbol, timeframe, PSAR factors, distance unit, and observation policy consistent when comparing records.
Realtime behavior and limitations
Confirm state changes at bar close is enabled by default. Run changes, EP updates, descriptive event records, and history counters are committed under that setting. The active ta.sar() point, current geometry, constraint calculations, halos, and current displayed signature can nevertheless change before the bar closes. The panel can retain a committed run state while live geometric values update. Disabling confirmation allows more provisional intrabar behavior.
The script is not described as completely non-repainting. Use closed bars for reproducible comparisons.
Non-standard chart types supply synthetic or transformed OHLC. The panel marks them as SYNTHETIC; their measurements describe that generated chart series, not standard market bars.
PSAR can change sides frequently in irregular or sideways markets. A synchronized reconstruction is only a numerical consistency check within tolerance. Changing the available history, research boundary, settings, or timeframe can change the tracked run statistics. Extreme parameter values may produce more unavailable or CHECK observations. Defaults are general research settings, not optimized values.
This open-source indicator is a descriptive visualization and numerical research tool. It makes no claims about forecast accuracy, trading performance, or a predictive edge, and it does not provide individualized recommendations or trading instructions. Indikator

Stryk TrendsStryk: ATR Trends
Everything in this tool is measured in units of one master ATR. Change that one length and the whole indicator retunes together — the candle coloring, the compression reads, the reversal checks, and the trailing stop all use the same yardstick.
What it is
At the center is a composite value line: a weighted blend of seven EMAs (8 through 144) and a rolling volume-weighted average. The VWMA leans the line toward where volume actually transacted, and its window can auto-size to your chart timeframe so it covers a similar span whether you're on the 1-minute or the daily. Price tends to return to this line, and the whole tool reads price against it.
Candles color by distance from that line. Near it, they're neutral. The further price stretches away, the deeper the up or down color gets, reaching full saturation at a set ATR distance. A signal can also flip the candles to a solid color temporarily, so you can run the tool with every line hidden and still get the read from the candles alone.
The engines
Compression coil. A dedicated ATR is ranked into a percentile. When it compresses into the bottom of its range, the market is coiled. When the coil releases and price is at the same time over-extended from the composite, a fade marker prints back toward the line. One fire per release, inside a short window. A second marker can print if volume steps up afterward.
Compression release. A separate lens using Donchian width (highest high minus lowest low) ranked in the same percentile framework. When the envelope tightens and then releases, a marker prints in the direction of an ATR-normalized momentum read. This is not a Bollinger-inside-Keltner squeeze — it's built entirely in percentile space.
Reversal engine. Once price has stretched a set number of ATRs from the composite, the engine watches for the turn. It counts four independent checks: an RSI rollover, a close back inside the band around the line, a confirmed pivot, and a volume climax. When enough agree, a reversal marker prints — once per leg, and it won't re-arm until price comes back near the line. Pivots confirm after their right-side bars complete, so that check is delayed by design rather than repainting.
Whale and spike. A per-bar order-flow estimate built from close location and volume. Two whale reads fire from it: a fade of a volume spike where the delta ran against the move, and absorption — heavy delta into a bar that barely moved. Both can be gated by trend so you don't fade into a strong stretch. Bars at the extreme relative-volume threshold print a spike marker instead; the whale band sits below that threshold, so the two never fire on the same bar. The spike is an attention marker, not a directional call.
ATR trailing stop. A ratcheting volatility stop, either always on or armed by a coil fire. The default runs a tight 3/3 configuration as the real line, with a wider manual configuration drawn faintly beside it as a reference. The stop's ATR can be pulled from a higher timeframe, lookahead-off.
Volume participation. A volume EMA normalized 0 to 100 against its own recent range. Fifty is average. The extremes tint the background and the value sits in the status box.
Status box. One table on the chart reports every active engine on the last bar — stop side and level, compression stage, last reversal with its confluence count, last release, whale scenario, last spike, and participation. Rows light up when fresh and dim after a few bars. Every row can be toggled and the layout can run stacked or horizontal.
How I use it
Candle color is the base read. The coil and release tell me volatility compressed and which way it resolved. The reversal and whale engines flag exhaustion at the stretched edges. The trailing stop manages the rest. Each engine is independent — turn off what you don't use.
Originality
The rolling VWMA is the plain public-domain construction, sum(price x volume) / sum(volume), implemented directly with no external library. The compression framework — ATR-percentile coil plus Donchian-width release, scored in one percentile system — is original construction. Native built-ins only. Non-repainting on closed bars: higher-timeframe requests are lookahead-off on confirmed values, and alerts are meant for once-per-bar-close.
Notes
Built for standard candles only. The volume engines need a symbol with real volume, and the whale delta is an estimate from bar structure, not exchange order-flow data. This is an analysis tool, not advice, and it doesn't predict anything.
Indikator

Indikator

Indikator

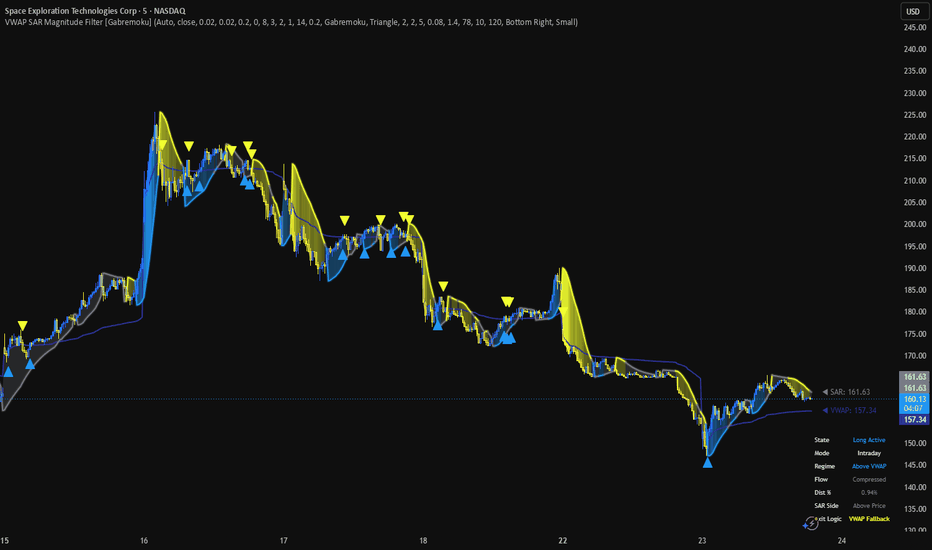
VWAP SAR Magnitude Filter [Gabremoku]VWAP SAR Magnitude Filter
Short description
A state-based long-only trend filter that combines VWAP context with Parabolic SAR structure. It uses VWAP as the main trend and invalidation line, while SAR confirms directional pressure and helps visualize momentum expansion or compression.
Descrizione completa
VWAP SAR Magnitude Filter is a long-only overlay designed to turn two familiar tools, VWAP and Parabolic SAR, into a cleaner operational framework rather than a simple indicator mashup.
The script uses VWAP as the primary market context and invalidation line. When price is above VWAP, the market is treated as having bullish intraday or swing context. When price falls back below VWAP, that context weakens and the script can trigger an exit.
Parabolic SAR is not used here as the primary exit engine. Instead, it acts as a structural confirmation tool. A valid long setup requires price to be above VWAP while SAR remains below the candle, which helps align directional bias and price structure. This reduces the number of signals that would appear if VWAP or SAR were used independently.
The script also includes an Auto mode engine. In Auto mode, lower intraday timeframes are handled with faster behavior, while higher timeframes are treated as swing conditions with additional filters. This makes the indicator adapt its sensitivity without requiring constant manual switching.
In Swing mode, the script becomes more selective by requiring:
persistence of the long condition for a minimum number of bars,
a minimum distance between price and SAR,
confirmed exit behavior below VWAP,
a longer cooldown after exits.
This approach is intended to reduce noise and avoid frequent re-entries during unstable or sideways phases. The indicator is therefore more focused on readable continuation structure than on generating many raw signals.
How it works
Long context: Price above VWAP.
Long confirmation: Parabolic SAR below the candle.
Long entry: The bullish context and structural confirmation align.
Exit logic: Main exit occurs on VWAP fallback; in Swing mode the fallback can require confirmation across multiple bars.
Mode engine: Auto selects Intraday or Swing behavior depending on the chart timeframe.
Visual features
VWAP line as the main reference level.
SAR line and glow for directional structure.
Magnitude fill between price and SAR to visualize pressure expansion and compression.
Optional bar coloring.
Dashboard with State, Mode, Regime, Flow, Distance %, SAR Side, and Exit Logic.
How to use it
This indicator works best when price is developing directional structure away from VWAP. In strong trends, it can help frame cleaner long continuation behavior. In choppy or sideways markets around VWAP, noise is naturally higher because the market lacks clear directional context.
A practical way to use it is:
monitor whether price is holding above VWAP,
wait until SAR is also positioned below price,
use the dashboard to confirm the current regime and state,
treat VWAP fallback as the main warning that the active long structure may be weakening.
Limitations
This indicator is not meant to eliminate all noise, especially in lateral environments where price oscillates around VWAP. In those conditions, repeated context shifts are part of market behavior, so no VWAP-based trend tool can remove all false transitions. The script is designed to reduce that noise, not to make it disappear completely.
It is also a context and structure tool, not a complete trading system. Users should still evaluate market conditions, liquidity, session behavior, and personal risk management before making decisions. Indikator
Indikator

Katana Signal AUDCAD Entry IndicatorThis indicator visualises the entry logic behind Katana EA v1.4
— an MT4 Expert Advisor I developed privately in 2022 and have
been running on a live account ever since.
━━━━━━━━━━━━━━━━━━━━━━━━━━━━━━━━
HOW THE SIGNAL WORKS
━━━━━━━━━━━━━━━━━━━━━━━━━━━━━━━━
Entry is triggered only when TWO conditions align on the prior
closed bar (shift=1, no repainting):
BUY signal:
• RSI reaches oversold extreme
• Parabolic SAR is below the prior bar's low
SELL signal:
• RSI reaches overbought extreme
• Parabolic SAR is above the prior bar's high
Both conditions must be true simultaneously.
Single-indicator entries are filtered out.
━━━━━━━━━━━━━━━━━━━━━━━━━━━━━━━━
WHY AUDCAD
━━━━━━━━━━━━━━━━━━━━━━━━━━━━━━━━
AUD and CAD are both commodity-linked currencies that move
together the majority of the time. When they temporarily
diverge — due to oil price moves, RBA/BOC policy divergence,
or risk sentiment shifts — mean-reversion setups have strong
structural reasons to work.
This makes AUDCAD one of the cleanest pairs for this type
of strategy. The correlation rarely breaks permanently,
which limits the risk of runaway adverse moves.
━━━━━━━━━━━━━━━━━━━━━━━━━━━━━━━━
DISPLAY SETTINGS
━━━━━━━━━━━━━━━━━━━━━━━━━━━━━━━━
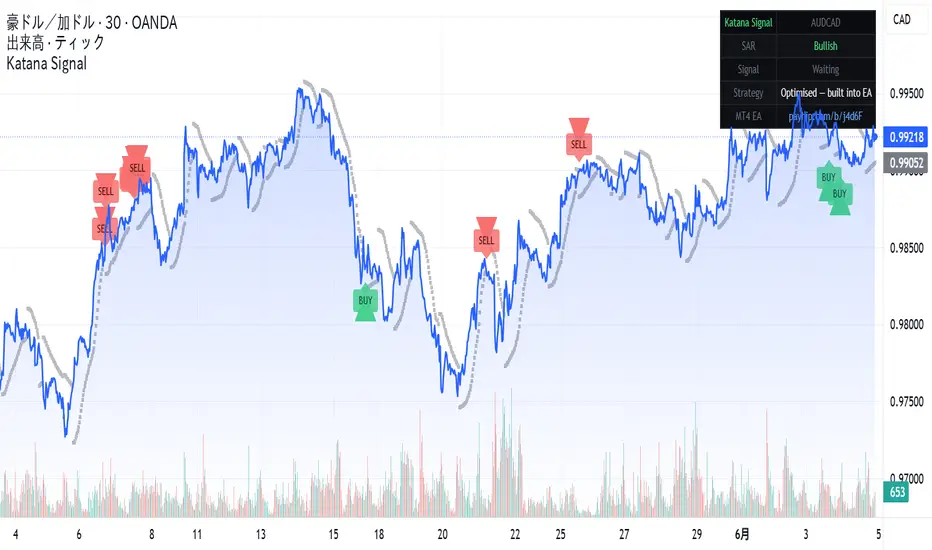
• BUY signal → green triangle below bar
• SELL signal → red triangle above bar
• Parabolic SAR → grey dots (standard display)
• Background highlight on signal bars (can be disabled)
• Info table top-right: SAR direction, current signal status
Strategy parameters are optimised internally and not exposed
— this prevents unintended parameter changes that could
degrade performance.
━━━━━━━━━━━━━━━━━━━━━━━━━━━━━━━━
MT4 AUTOMATION
━━━━━━━━━━━━━━━━━━━━━━━━━━━━━━━━
This indicator shows the entry signals visually.
The automated version (Katana EA v1.4) executes these
entries on MT4 with:
• Dynamic lot sizing — auto-scales with account balance
• Martingale position scaling (max 8 positions)
• Hard stop-loss + 8-hour cooldown after each SL event
• Active hours filter (London + New York session only)
51-month backtest results (Mar 2022 – May 2026):
✓ Net profit: +6,717% on ¥150,000 starting capital
✓ Win rate: 96.5% per trade cycle
✓ Profit factor: 1.54
✓ Stop-losses: 33 in 51 months
✓ Modelling quality: 90% (Every Tick, 60M+ real tick data)
Includes: 2022 Ukraine war oil spike, Trump tariffs,
Middle East conflict periods.
Free 14-day trial + full licence: payhip.com/b/j4d6F
Licence delivery & support: Telegram @KaTa4649
⚠ Requires broker with 500:1 leverage (XM Global recommended)
⚠ Not compatible with US / Canada / UK retail accounts
━━━━━━━━━━━━━━━━━━━━━━━━━━━━━━━━
RECOMMENDED SETUP
━━━━━━━━━━━━━━━━━━━━━━━━━━━━━━━━
For visual analysis: use on AUDCAD 1H or 4H
For the automated EA: runs on AUDCAD M5
Broker: XM Global Standard Account (JPY or USD)
Min capital: ¥150,000 or $1,000 USD Indikator

Katana Signal AUDCAD Mean-Reversion Entry IndicatorThis indicator visualises the entry logic behind Katana EA v1.4
— an MT4 Expert Advisor I developed privately in 2022 and have
been running on a live account ever since.
━━━━━━━━━━━━
HOW THE SIGNAL WORKS
━━━━━━━━━━━━
Entry is triggered only when TWO conditions align on the prior
closed bar (shift=1, no repainting):
BUY signal:
• RSI reaches oversold extreme
• Parabolic SAR is below the prior bar's low
SELL signal:
• RSI reaches overbought extreme
• Parabolic SAR is above the prior bar's high
Both conditions must be true simultaneously.
Single-indicator entries are filtered out.
━━━━━━━━
WHY AUDCAD
━━━━━━━━━
AUD and CAD are both commodity-linked currencies that move
together the majority of the time. When they temporarily
diverge — due to oil price moves, RBA/BOC policy divergence,
or risk sentiment shifts — mean-reversion setups have strong
structural reasons to work.
This makes AUDCAD one of the cleanest pairs for this type
of strategy. The correlation rarely breaks permanently,
which limits the risk of runaway adverse moves.
━━━━━━━━
DISPLAY SETTINGS
━━━━━━━━━
• BUY signal → green triangle below bar
• SELL signal → red triangle above bar
• Parabolic SAR → grey dots (standard display)
• Background highlight on signal bars (can be disabled)
• Info table top-right: SAR direction, current signal status
Strategy parameters are optimised internally and not exposed
— this prevents unintended parameter changes that could
degrade performance.
━━━━━━━━━
MT4 AUTOMATION
━━━━━━━━━━
This indicator shows the entry signals visually.
The automated version (Katana EA v1.4) executes these
entries on MT4 with:
• Dynamic lot sizing — auto-scales with account balance
• Martingale position scaling (max 8 positions)
• Hard stop-loss + 8-hour cooldown after each SL event
• Active hours filter (London + New York session only)
51-month backtest results (Mar 2022 – May 2026):
✓ Net profit: +6,717% on ¥150,000 starting capital
✓ Win rate: 96.5% per trade cycle
✓ Profit factor: 1.54
✓ Stop-losses: 33 in 51 months
✓ Modelling quality: 90% (Every Tick, 60M+ real tick data)
Includes: 2022 Ukraine war oil spike, Trump tariffs,
Middle East conflict periods.
Free 14-day trial + full licence: payhip.com/b/j4d6F
Licence delivery & support: Telegram @KaTa4649
⚠ Requires broker with 500:1 leverage (XM Global recommended)
⚠ Not compatible with US / Canada / UK retail accounts
━━━━━━━━━
RECOMMENDED SETUP
━━━━━━━━━━━━
For visual analysis: use on AUDCAD 1H or 4H
For the automated EA: runs on AUDCAD M5
Broker: XM Global Standard Account (JPY or USD)
Min capital: ¥150,000 or $1,000 USD Indikator

Luminous Mean Reversion Channels [Pineify]Luminous Mean Reversion Channels
Luminous Mean Reversion Channels is a volatility-adaptive mean reversion overlay built around an ATR-stepped central level. Rather than following every candle like a moving average, the center line only recalibrates after price moves far enough to clear a volatility threshold. The upper and lower bands then mark stretched areas where price may begin rotating back toward the mean.
Key Features
ATR-based range logic that adapts to changing volatility
Stepped mean reversion level that filters small price noise
Upper overbought band and lower oversold band with soft visual fills
BUY and SELL labels when price crosses back through an outer band
Alert conditions for bullish and bearish mean reversion events
How It Works
The script measures Average True Range over the selected Volatility Length, then multiplies it by the Channel Width Factor. This creates the displacement threshold.
If the source price rises more than that threshold above the current center line, the center line steps upward by one threshold. If price falls more than that threshold below the current center line, it steps downward. If price stays inside the threshold, the center line does not move.
When the center line changes, the script stores half of the active threshold as the channel width. The overbought band is plotted above the center line, and the oversold band is plotted below it. A BUY label appears when price crosses upward through the lower band. A SELL label appears when price crosses downward through the upper band.
How the Components Work Together
ATR defines how large a move must be before the range is considered meaningful. The stepped center line defines the current mean reversion reference. The band-crossing logic then looks for price moving back inside a stretched area. This combination helps separate ordinary candle noise from larger volatility-adjusted displacement.
Trading Ideas and Insights
A BUY label near the lower band may indicate that downside extension is starting to mean revert
A SELL label near the upper band may indicate that upside extension is starting to cool
Repeated center-line steps in one direction suggest trend pressure; countertrend signals may need stronger confirmation
Sideways rotation between the two bands can be useful context for range-trading analysis
Signals are context markers, not guaranteed entries. Trend, structure, liquidity, and higher-timeframe conditions should still guide risk decisions.
Unique Aspects
This is not a standard Bollinger Band, Keltner Channel, or fixed moving average envelope. The central value moves in discrete ATR-based steps instead of updating on every bar
The active band width is captured when the mean level recalibrates, tying the channel to the volatility regime that caused the shift
The visual output focuses on two practical reversal zones rather than a dense stack of intermediate levels
How to Use
Apply the indicator to a clean chart and choose the source price
Use the gray center line as the current mean reversion reference
Watch the red upper band for stretched upside conditions and the green lower band for stretched downside conditions
Use BUY and SELL labels as prompts for further confirmation, not as standalone trade instructions
Create alerts from the bullish or bearish mean reversion conditions if you want notifications
Customization
Volatility Length (default: 200) - ATR lookback. Higher values smooth the channel; lower values react faster
Channel Width Factor (default: 6.0) - ATR multiplier. Higher values create wider bands and fewer signals
Source - Price series used for the channel and signal crosses
Open-Source Reference and Limitations
This script uses the public volatility-stepped range concept associated with Predictive Ranges as a foundation, then presents it as a simplified two-band mean reversion channel with Pineify styling, focused labels, and alerts. Mean reversion labels can appear early during strong trends, and past chart examples do not guarantee future results. Avoid using BUY/SELL signals on non-standard chart types when evaluating realistic trading behavior.
Conclusion
Luminous Mean Reversion Channels is designed for traders who want a clean, volatility-aware view of price extension. Its main value is showing when price is stretched relative to an ATR-stepped mean and when it begins crossing back toward the active range. Indikator

PSAR Structural Gauge [KNN Engine]PSAR Structural Gauge - On-Chart Visualizer & HUD
This indicator is an advanced, machine-learning-assisted structural mapping tool. It moves beyond traditional momentum oscillators by evaluating the "elasticity" of price relative to a Parabolic SAR, utilizing dynamically anchored volatility arrays and a 6-Dimensional K-Nearest Neighbors (KNN) classification algorithm.
Operating as an on-chart interface and risk management suite, it overlays structural geometries, Maximum Favorable Excursion (MFE) tracking boxes, and simulated Kelly Criterion position sizing directly onto your price chart.
The Core Engine: Dynamic Structural Tether (Elasticity)
Unlike standard oscillators that measure raw price change over fixed periods, this engine measures the "Tension" or "Tether" between price and the underlying trend structure (represented by a global Parabolic SAR).
Anomaly Detection (The Anchor): The script continuously tracks volume using a rolling Z-score. When a significant institutional liquidity event occurs (volume spikes above your defined Z-score threshold), the script drops an "Anchor."
Dynamic 24x Array: Upon an anchor trigger, the script initializes a new tracking period. It measures the raw distance between the current price and the Parabolic SAR, and divides that distance by the accumulated True Range (volatility) that has occurred since the anchor was dropped. It tracks up to 24 of these anchored "elasticity" metrics simultaneously.
Z-Score Standardization (Meta-Mean): To distill 24 different elasticity profiles into a single readable metric, the script calculates their cross-sectional average (the "Meta-Mean"). It then calculates the Z-Score of this structural tether, providing a standardized measure of whether the current trend is hyper-extended (high tension) or at equilibrium.
The Machine Learning Module (KNN)
The engine evaluates market conditions by feeding a 6-Dimensional sensory matrix into a K-Nearest Neighbors (KNN) classification algorithm. The six features evaluated are:
Structural Tether (Z-Score): The current standardized elasticity of the market.
Tether Velocity: The bar-to-bar momentum of the elasticity.
Price Velocity: Z-Scored rate of change of price from a baseline 50-SMA.
Cluster Consensus: Percentage of the 24 active anchors aligned in the same directional state.
Historical Rate of Change: An 8-bar lookback of tether velocity.
Tension Compression: Standard deviation of the 24 anchors to identify tightly coiled structural energy.
The algorithm maps this 6D state and calculates the Euclidean distance to a memory bank of the last 500 historical setups. It isolates the K most mathematically identical past environments and evaluates their success rates, returning a real-time Probability Score.
On-Chart Visuals & MFE/LFE Box Engine
Rather than cluttering your chart with disjointed arrows, this visualizer groups continuous, same-direction KNN signals into clean structural "Streaks."
Independent Line Mitigation: The AI projects forward-looking target lines (Scalp target and Stop Loss floor). These lines actively track price tick-by-tick. The exact moment price intersects a target, that specific line halts, solidifies, and stops extending, leaving a permanent structural footprint.
Profit Box (Blue): Stretches vertically from your initial entry up to the projected target. It dynamically expands to the right, snapping exactly to the bar that achieved the Maximum Favorable Excursion (MFE).
Risk Box (Red): Drops from the entry to the absolute minimum anchored stop loss, highlighting the exact Lowest Favorable Excursion (LFE) (Maximum Adverse Excursion) of the active structural streak.
Streak Termination: A structural streak only ends when the absolute minimum Stop Loss is breached or an opposing KNN signal flips the mathematical momentum.
The Agent Diagnostic Dashboard (HUD)
The built-in dashboard provides real-time diagnostic transparency into the engine's internal state:
Market Context: Live metrics for Structural Tether (Z), Tether Vector, Tension Compression, and Tether Consensus.
AI Probability: The live win-rate probability generated by the companion 6D KNN engine.
Live Portfolio Tracking: Simulates a compounding equity curve. It tallies the Hit Rate of the KNN algorithm and computes a simulated dollar PnL based on your starting capital.
Dynamic Bet Sizing (Kelly Criterion): Utilizing the KNN probability and your defined Risk/Reward parameters, the dashboard simulates optimal position sizing via a dampened Kelly Criterion formula. It actively scales simulated risk up during high-probability setups and scales down when the edge decreases, capping at a strict maximum to prevent ruin.
Disclaimer: The portfolio tracker and Kelly sizing metrics are simulated diagnostic tools meant for the educational evaluation of the KNN algorithm's historical efficacy. This tool provides statistical classification of historical data, which does not constitute financial advice, predictive guarantees, or real-world trading results. Indikator

Aegis Parabolic Oscillator - Triple Confluence HistogramWhat This Indicator Does
-The Aegis Parabolic Oscillator transforms the relationship between two Parabolic SAR layers operating on different timeframes into a single histogram that oscillates between five discrete levels: +100, +50, 0, -50, and -100. Each level represents a specific degree of alignment between a higher-timeframe trend filter (Macro SAR), a lower-timeframe momentum signal (Micro SAR), and an exponential moving average confirmation layer.
-When all three layers agree on direction, the oscillator reaches full confluence. When only the SAR layers agree but the EMA does not confirm, the oscillator shows partial confluence. When the layers conflict, the oscillator returns to zero.
-This converts the abstract concept of multi-timeframe trend agreement into a concrete, quantifiable reading that can be tracked, alerted on, and used as a filter for other trading strategies.
How It Works
The indicator operates through three distinct analytical layers that are evaluated simultaneously on every bar.
-Layer 1 - Macro SAR (Trend Structure)
A Parabolic SAR is calculated on a user-defined higher timeframe to determine the dominant market structure. By default, this runs on the Daily chart. The Macro SAR uses conservative acceleration factor settings (start: 0.01, increment: 0.01, max: 0.15) which produce a slower, less reactive indicator that filters out minor pullbacks and focuses only on genuine trend reversals at the structural level.
When price closes above the Macro SAR on the higher timeframe, the macro trend is considered bullish. When price closes below the Macro SAR, the macro trend is considered bearish. This establishes the directional bias for the entire analysis.
-Layer 2 - Micro SAR (Entry Momentum)
A second Parabolic SAR is calculated on a lower timeframe to provide the momentum signal. By default, this runs on the 1-hour chart. The Micro SAR uses faster acceleration settings (start: 0.02, increment: 0.02, max: 0.20) to respond more quickly to directional changes within the broader trend structure.
The Micro SAR determines whether short-term momentum aligns with or diverges from the macro trend established by Layer 1. Agreement between both SAR layers indicates that trend and momentum are synchronized.
-Layer 3 - EMA Confirmation Filter
An exponential moving average is calculated on the Macro timeframe and serves as a third confirmation dimension. The EMA length is configurable (default: 21 periods on the Macro timeframe).
For the oscillator to reach full bullish confluence (+100), price must be above this EMA. For full bearish confluence (-100), price must be below the EMA. When the SAR layers agree but the EMA does not confirm, the oscillator shows partial confluence (+50 or -50) rather than full confluence.
The EMA is used as an internal calculation filter only. It is not plotted as a visible line on the chart. Its role is purely to provide an additional confirmation gate that distinguishes strong alignment from moderate alignment.
Confluence Logic and Oscillator Values
The indicator combines the three layers into a single discrete value according to this logic:
+100 (Full Bullish Confluence): Macro SAR is bullish AND Micro SAR is bullish AND price is above the Macro EMA. All three conditions confirm bullish direction.
+50 (Partial Bullish Confluence): Macro SAR is bullish AND Micro SAR is bullish BUT price is below the Macro EMA. The SAR layers agree on bullish direction but the EMA filter does not confirm.
0 (Neutral / Conflict): The Macro SAR and Micro SAR disagree on direction. When the macro trend is bullish but micro momentum is bearish, or when the macro trend is bearish but micro momentum is bullish, the oscillator returns zero indicating conflicting signals.
-50 (Partial Bearish Confluence): Macro SAR is bearish AND Micro SAR is bearish BUT price is above the Macro EMA. The SAR layers agree on bearish direction but the EMA filter does not confirm.
-100 (Full Bearish Confluence): Macro SAR is bearish AND Micro SAR is bearish AND price is below the Macro EMA. All three conditions confirm bearish direction.
Visual Components
Histogram
-The primary visual element is a column histogram centered on zero. The histogram displays the current confluence value with color-coded bars. Full bullish bars (+100) appear in bright green. Partial bullish bars (+50) appear in semi-transparent green. Full bearish bars (-100) appear in deep red. Partial bearish bars (-50) appear in semi-transparent red. Neutral bars (0) are not visible.
Macro Ribbon
-Two narrow column plots at the +15 and -15 levels create a visual frame around the histogram. These ribbon columns indicate the current Macro SAR state regardless of the histogram value. When the Macro SAR is bullish, the ribbon columns appear in white (by default). When bearish, they appear in black. This provides constant context for the macro trend direction even when the histogram shows neutral or partial confluence.
Background Tint
-An optional background color can be enabled that tints the entire chart background based on the Macro SAR state. When Macro SAR is bullish, the background receives a subtle white tint. When bearish, a dark tint. The transparency is adjustable to avoid visual interference with price action.
Non-Repainting Implementation
-All security calls in this indicator use lookahead disabled (barmerge.lookahead_off) and reference the previous closed bar using the index. This means the indicator calculates confluence based on confirmed bar closes only, not on intra-bar price movements.
-The indicator will not repaint. Once a bar closes, its confluence value is fixed and will not change on subsequent bars. This makes the indicator suitable for backtesting analysis and strategy development where historical accuracy is required.
-If the higher timeframe data is unavailable (which can occur on the first bars of a chart), the indicator falls back to local calculations using the chart timeframe with the same indexing to maintain non-repainting behavior.
Settings Reference
Macro SAR Settings:
- Macro Timeframe: The timeframe for the trend-filter SAR. Should be significantly higher than your chart timeframe. Default: D (Daily).
- Macro Start AF: The initial acceleration factor value. Lower values produce a slower, more conservative SAR that changes direction less frequently. Default: 0.01.
- Macro Increment AF: How much the AF increases each time a new extreme point is reached. Smaller increments reduce whipsawing. Default: 0.01.
- Macro Max AF: The maximum cap on the acceleration factor. Prevents the SAR from accelerating too aggressively during extended trends. Default: 0.15.
Micro SAR Settings:
- Micro Timeframe: The timeframe for the momentum SAR. Should be lower than the Macro timeframe but typically equal to or higher than your chart timeframe. Default: 60 (1 hour).
- Micro Start AF: Default: 0.02. Higher than Macro Start to provide faster response.
- Micro Increment AF: Default: 0.02.
- Micro Max AF: Default: 0.20.
Macro EMA Filter:
- EMA Length: The period of the exponential moving average calculated on the Macro timeframe. This EMA is used internally as a confirmation filter and is not plotted. Default: 21.
Display Settings:
- Full Confluence Bull (+100): Color for the histogram when all three layers align bullish. Default: bright green.
- Partial Confluence Bull (+50): Color for partial bullish confluence. Default: semi-transparent green.
- Full Confluence Bear (-100): Color for full bearish alignment. Default: deep red.
- Partial Confluence Bear (-50): Color for partial bearish confluence. Default: semi-transparent red.
- Macro Ribbon Bull Color: Color of the ribbon columns when Macro SAR is bullish. Default: white.
- Macro Ribbon Bear Color: Color of the ribbon columns when Macro SAR is bearish. Default: black.
- Show Trade Style Table: Displays a reference table with suggested settings for different trading approaches.
- Show Background Tint: Enables the background color based on Macro SAR state.
- Background Tint Transparency: Controls how visible the background tint appears. Higher values are more transparent.
Trade Style Configuration Guide
The indicator includes a reference table (toggle in settings) that provides starting configurations for different trading styles:
-Scalping: Micro AF 0.04/0.2, Macro AF 0.02/0.2, EMA Length 13, Suggested Timeframes 1m chart with 15m Micro and 1H+ Macro.
-Day Trading: Micro AF 0.02/0.2, Macro AF 0.01/0.1, EMA Length 21, Suggested Timeframes 15m chart with 1H Micro and 4H Macro.
-Swing Trading: Micro AF 0.01/0.1, Macro AF 0.005/0.1, EMA Length 50, Suggested Timeframes 1H chart with 4H Micro and Daily Macro.
-Long Term: Micro AF 0.005/0.1, Macro AF 0.002/0.05, EMA Length 100-200, Suggested Timeframes 4H chart with Daily Micro and Weekly Macro.
-These presets use progressively slower acceleration factors and longer EMA periods as the trading horizon extends. Scalping configurations prioritize faster response at the cost of more frequent direction changes. Long-term configurations minimize noise response and confirm only established multi-week trends.
How to Use It
-For trend-following entries: Look for the oscillator to reach +100 for long entries or -100 for short entries. Full confluence indicates that trend, momentum, and the EMA filter all agree on direction. These readings represent the highest-probability alignment.
-For confirmation of existing analysis: Use the oscillator to validate setups identified through other methods. If your chart analysis suggests a long entry, check whether the oscillator confirms with positive values. Avoid fighting full negative confluence.
-For position management: Monitor transitions from full to partial confluence. When the oscillator drops from +100 to +50, the EMA confirmation has failed even though the SAR layers still agree. This may indicate weakening momentum or the beginning of a correction. Consider tightening stops or taking partial profits.
-As a directional filter: The Macro Ribbon provides constant visual context for the dominant trend. Some traders only take long setups when the ribbon shows bullish (white) and only take shorts when bearish (black), using the oscillator value to time specific entries.
-For multi-timeframe awareness without chart switching: The oscillator synthesizes information from two different timeframes into a single panel, eliminating the need to constantly switch between charts to assess alignment.
What Makes This Indicator Original
-While the Parabolic SAR and EMA are well-known public domain indicators, this implementation combines them in a specific architecture that produces analytical output distinct from standard single-timeframe SAR usage:
-The dual-timeframe SAR comparison is the core mechanism. Standard SAR shows whether price is above or below the SAR on a single timeframe. This indicator compares SAR states across two timeframes simultaneously, creating a trend-momentum relationship that neither SAR in isolation provides.
-The EMA confirmation layer adds a third dimension that converts binary SAR agreement (both bullish or both bearish) into a graded confluence system with four non-neutral states rather than two. This additional filter distinguishes between strong agreement (price position confirms SAR direction) and weak agreement (SARs agree but price position contradicts).
-The quantized five-level output transforms a continuous indicator relationship into discrete categorical states. Each state has specific interpretive meaning and can trigger distinct trading responses. This is different from percentage-based or continuous oscillators where threshold selection is arbitrary.
-The non-repainting multi-timeframe implementation uses proper security call structure with closed-bar referencing to ensure historical accuracy. Many multi-timeframe indicators repaint because they use current-bar values from higher timeframes. This indicator explicitly avoids that behavior.
Markets and Trading Styles
This indicator applies to any liquid market with sufficient historical data: cryptocurrencies, forex pairs, equities, indices, commodities, and futures.
-For scalping (1-5 minute holds): Use faster AF settings and shorter timeframe combinations. Full confluence signals on the 1-minute chart with 15m/1H layers indicate alignment for quick momentum trades. Exit at the first sign of confluence weakening.
-For day trading (intraday holds): Standard settings work well. Monitor the 15m or 1H chart with 4H Macro. Hold positions through partial confluence as long as the Macro ribbon maintains direction. Close positions before the session end or when full negative confluence appears.
-For swing trading (multi-day holds): Extend to Daily Macro timeframe. Entries on full confluence can be held for several days. Partial confluence from +100 to +50 does not necessarily require exit but warrants increased attention to price action.
-For position trading (weeks to months): Weekly Macro timeframe with minimal AF values. The oscillator will change state infrequently. Full confluence signals represent major structural alignment suitable for longer-term position building.
Disclaimer
This indicator is a technical analysis tool that processes historical and current price data through mathematical formulas. It does not predict future price movements, guarantee trading profits, or constitute financial advice. All trading involves substantial risk including the potential loss of principal. Past indicator readings and confluence states do not ensure future accuracy or profitability. Users should combine this tool with proper risk management, appropriate position sizing, and their own independent analysis. The author assumes no responsibility for trading decisions or outcomes resulting from the use of this indicator.
Indikator

Aegis Parabolic Pro - Dual Timeframe Trend Alignment SystemWhat the indicator does
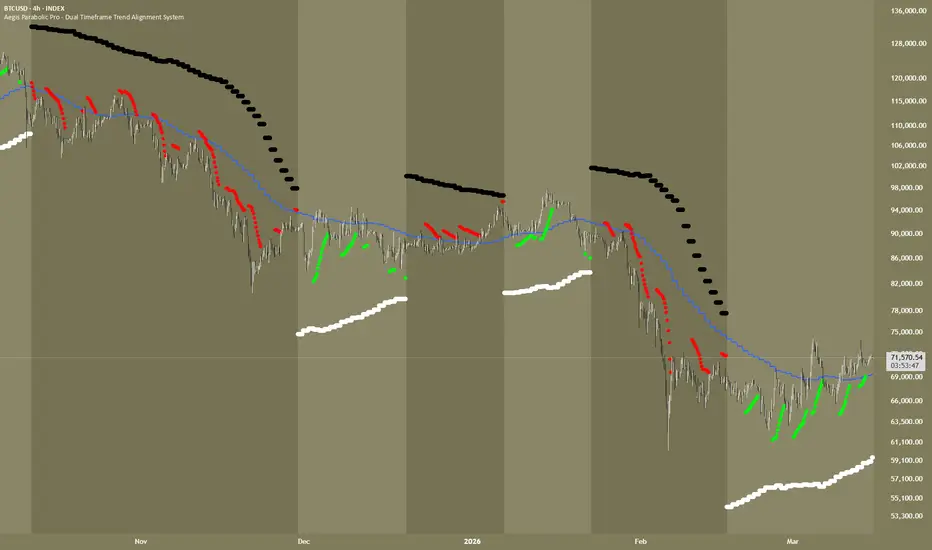
-This indicator overlays two independent Parabolic SAR calculations on your chart, each sourced from a separate user-configurable higher timeframe. The first, called the Macro layer, acts as a structural trend filter. The second, called the Micro layer, generates the actual entry-signal circles visible on your chart. A Macro EMA is also plotted from the same higher timeframe, providing a dynamic structural reference within the trend context.
-The core logic is an alignment system: the Micro entry circles are only colored and visible when both the Macro and Micro SAR layers simultaneously agree on direction. When both are bullish, the circles turn green. When both are bearish, they turn red. When the two layers disagree, the Micro circles disappear entirely. This forces discipline -- entries are only highlighted at moments of multi-timeframe structural agreement.
-Each SAR is not the raw classic Parabolic SAR value. An ATR-based offset is applied to each result, shifting the SAR band further from price by a user-defined multiplier of the 14-period Average True Range. This widened band reduces false reversals in volatile conditions while preserving the directional accuracy of the classic algorithm.
How it works
-The Parabolic SAR algorithm tracks an acceleration factor (AF) that starts at a low value and increases each time a new extreme price is set in the current trend direction, up to a configurable maximum. The stop-and-reverse point moves progressively closer to price as momentum builds. When price closes on the wrong side of the SAR level, the trend flips and the AF resets. This produces the characteristic curved trailing stop-and-reverse mechanism that Welles Wilder originally designed in 1978.
-In this indicator the standard formula is extended in two ways. First, all calculations run inside request.security() on higher timeframe datasets -- the SAR is computed entirely on the Macro or Micro timeframe bars before the result is mapped back to your chart. This means the SAR is not computing against the noise of your execution-timeframe candles; it reflects the momentum structure of a higher timeframe. Second, the ATR offset shifts the SAR level further from price: a bullish SAR value is reduced by (ATR14 * multiplier) and a bearish SAR value is increased by the same amount. This creates a buffer zone that absorbs intrabar volatility spikes without triggering false trend flips.
-The directional state of each layer is simply whether the current close sits above or below the Aegis-adjusted SAR level. If close > adjusted SAR, the layer is bullish. If close < adjusted SAR, the layer is bearish. The alignment condition is met when both layers share the same directional state.
-On repainting: all three request.security() calls use exclusively barmerge.lookahead_off. The "Wait for Bar Confirmation" toggle controls whether the SAR and EMA calculations reference the last fully closed bar of their respective timeframe (bar index offset 1) or the current in-progress bar close (offset 0). The offset value is derived from a simple input.bool -- a compile-time constant, not a runtime series -- making it safe to use as a bar offset inside the security context. When the toggle is on, signals never change retroactively. Zero repainting.
What makes it original
-Standard Parabolic SAR is calculated on your current chart timeframe. It reacts to every candle. Applied to a 5-minute or 15-minute chart, the SAR flips constantly and has poor signal quality. This indicator eliminates that problem entirely by computing the SAR on a higher timeframe and projecting it onto your execution chart -- you see the clean momentum structure of a 4-hour or daily SAR while trading on a lower timeframe.
-The ATR multiplier is a second layer of noise filtering on top of the timeframe filter. The raw SAR level is already smoother due to the HTF sourcing; the ATR band makes it further resistant to the kind of intrabar spike that causes classic SAR to generate premature reversals on volatile instruments like crypto or small-cap equities.
-The dual-layer alignment architecture is the primary original contribution. Rather than using a single SAR and filtering it with a separate trend indicator, both the trend filter and the entry signal use the same core algorithm (Parabolic SAR) at different timeframe scales. This produces structural consistency: both layers speak the same language. When they agree, you know both the macro structural momentum and the intermediate-term momentum point in the same direction. The color logic makes this alignment visually immediate -- green circles mean both layers agree up, red circles mean both layers agree down, no circles mean they disagree.
-The color system is fully customizable. The Macro SAR has separate bullish and bearish color inputs (default white/black). The background tint has its own independent bull and bear color inputs, also defaulting to white and black but adjustable without affecting the SAR circles. This means you can set the Macro SAR bullish circles to white while using a custom teal or blue for the bullish background wash -- two independent color systems that can match or contrast as you prefer.
-The built-in trade style reference table provides pre-configured AF and EMA settings for four common trading profiles. This is a practical utility that saves significant manual experimentation and makes the indicator immediately useful to traders unfamiliar with SAR parameter tuning. The table is hidden by default and can be enabled from the Display settings group.
How to use it
-Set your chart to your execution timeframe. Set the Micro timeframe to approximately four to six times your chart timeframe. Set the Macro timeframe to a major structural reference -- Daily is the standard default. The Micro timeframe generates your directional bias confirmation; the Macro timeframe is the filter that qualifies whether that bias is worth acting on.
-Wait for the Micro circles to color. When both layers align and green circles appear below price, that is the bullish entry zone for the current Micro timeframe cycle. When red circles appear above price, that is the bearish entry zone. Use your standard entry trigger (price action, volume, or momentum) to time the actual entry within that zone.
-The Macro EMA provides an additional structural reference. In a bullish alignment, entries taken while price is above the Macro EMA carry higher structural quality than those taken below it.
-For the Macro SAR circles: the bullish color (default white, fully adjustable) appears below price in an uptrend. The bearish color (default black, fully adjustable) appears above price in a downtrend. The background tint independently reinforces these states using its own configurable bull and bear colors -- both are independent from the SAR circle colors. A standard approach is to take only green Micro circles when the background shows the bullish tint, and only red Micro circles when the background shows the bearish tint.
-Alerts: the Bullish Full Alignment and Bearish Full Alignment alerts are the primary signals -- set them to fire on bar close with the confirmation toggle enabled. The four individual layer alerts (Macro and Micro turning bull or bear separately) are secondary warnings, disabled by default to avoid alert fatigue.
Settings
-Wait for Bar Confirmation: When on, all calculations reference the last fully closed bar of each respective timeframe. Prevents signals from changing while a bar is still forming. Strongly recommended for all live alert use.
-Macro Timeframe: The higher timeframe for the structural trend filter. Default Daily. For equity day traders this is appropriate. For crypto swing traders, Weekly is a stronger macro anchor.
-Macro Start AF / Increment AF / Max AF: The three acceleration factor parameters for the Macro Parabolic SAR. Lower values across all three produce a more stable, slower-turning macro filter. The reference table provides preset values for each trading style.
-Macro ATR Multiplier: How far the ATR-based offset shifts the Macro SAR from its raw value. Default 1.5. Raise to 2.0-2.5 for highly volatile markets. Lower to 1.0-1.2 for steadier instruments.
-Micro Timeframe: The intermediate timeframe for entry signals. Default 4H. For 15-minute chart traders, 1H or 4H works well. For 1-hour chart traders, Daily is more appropriate as the Micro layer.
-Micro Start AF / Increment AF / Max AF: Higher start and increment values produce faster, more responsive entry signals. Lower values produce fewer, higher-quality signals.
-Micro ATR Multiplier: Default 1.0. Raise to reduce noise in choppy conditions.
-EMA Length: Period of the Macro EMA. Default 21 on the Daily timeframe tracks the short-term institutional moving average. Common alternatives: 50 for intermediate macro structure, 200 for long-term primary trend.
-Macro SAR Bullish Color: Color of the large Macro SAR circles when the macro trend is bullish. Default white. Independently adjustable from the background bull tint.
-Macro SAR Bearish Color: Color of the large Macro SAR circles when the macro trend is bearish. Default black. Independently adjustable from the background bear tint. Useful when using a light chart theme or a non-standard color scheme.
-Micro SAR Aligned Bullish Color / Bearish Color: Colors of the Micro entry circles during full alignment. These only appear when both layers agree.
-Show Trade Style Table: Hidden by default. Enable to display the parameter reference table in the top-right corner of the chart. The table has a white background with gray headers, purple AF and timeframe values, and dark red EMA values.
-Show Background Tint: The background wash is driven by the Macro SAR state. The bull and bear tint colors are fully independent from the Macro SAR circle colors -- changing one does not affect the other.
-Background Bull Color: Color of the background tint during a bullish Macro SAR state. Default white. Fully independent from the Macro SAR Bullish Color input.
-Background Bear Color: Color of the background tint during a bearish Macro SAR state. Default black. Fully independent from the Macro SAR Bearish Color input.
-Background Tint Transparency: Default 92. Range 85-98 covers subtle-to-visible tinting. Applies equally to both bull and bear background colors.
Markets and timeframes
-Works on all markets: equities, indices, crypto, forex, and commodities. The ATR offset makes it particularly useful on high-volatility instruments where classic Parabolic SAR is prone to excessive whipsaw.
-For intraday scalpers using 1-minute to 5-minute charts: use the Scalping preset from the reference table. Micro timeframe 15-minute, Macro timeframe 1-hour. Best suited to liquid, high-volume instruments during active market sessions where momentum is directional.
-For day traders on 15-minute to 30-minute charts: use the Day Trade preset. Micro 4H, Macro Daily. This is the default configuration and covers the widest range of instruments and market conditions.
-For swing traders holding positions for days to weeks: use the Swing preset. Micro Daily, Macro Weekly. The alignment requirement produces significantly fewer but structurally higher-quality signals.
-For long-term position traders monitoring macro turning points: use the Long Term preset. The indicator becomes a broad structural regime-change detector rather than an entry-timing tool at this scale.
Disclaimer
-Past indicator performance does not guarantee future results. This tool is for informational and educational purposes only and does not constitute financial advice or a trading recommendation. All trading involves risk. Suitable for all markets and all timeframes. Always apply appropriate position sizing, stop-loss management, and risk-reward assessment independent of any indicator signal.
Indikator

Indikator
Parabolic SAR Extended (SAREXT)- Extended Parabolic SAR with asymmetric acceleration factors for long/short positions.
- Parameterized by 8 parameters: start value, offset on reverse, and separate AF init/increment/max for long and short.
- Output range: sign-encoded — positive values indicate long (SAR below price), negative indicate short (SAR above price). Absolute value is the SAR level.
- Requires `2` bars of warmup before first valid output (IsHot = true).
- Validated against TA-Lib `SarExt` reference implementation with ≥95% match rate.
## Introduction
SAREXT is the extended version of Wilder's Parabolic Stop And Reverse (1978). While standard PSAR uses symmetric acceleration factors (same AF parameters for both long and short positions), SAREXT allows independent AF configuration for each direction. This enables traders to apply tighter stops in one direction (e.g., faster acceleration when short to protect against bear market rallies) while using looser stops in the other. SAREXT also adds explicit start value control (force initial direction) and an offset applied on reversals.
The `startValue` parameter controls initial direction: positive forces long, negative forces short, zero auto-detects from directional movement (DM) comparison on bar 1 vs bar 0. The `offsetOnReverse` parameter shifts the SAR value on each reversal — adding a buffer to prevent immediate whipsaw.
## Historical Context
Wilder introduced the basic Parabolic SAR in *New Concepts in Technical Trading Systems* (1978). The extended version with asymmetric acceleration factors was popularized by the TA-Lib open-source library (2003+) as `TA_SAREXT`. The asymmetric AF concept addresses a known weakness of standard PSAR: bull and bear trends have different characteristics. Bull markets tend to climb gradually while bear markets fall sharply. Using the same AF parameters for both directions is suboptimal. SAREXT's asymmetric design allows practitioners to codify this market asymmetry.
## Parameter Mapping
| Parameter | Default | Effect |
|-----------|---------|--------|
| startValue | 0.0 | 0=auto-detect, >0=force long, <0=force short |
| offsetOnReverse | 0.0 | Buffer added to SAR on reversal. Reduces whipsaw. |
| afInitLong | 0.02 | Initial AF when entering long position |
| afLong | 0.02 | AF increment per new high in long mode |
| afMaxLong | 0.20 | Maximum AF in long mode |
| afInitShort | 0.02 | Initial AF when entering short position |
| afShort | 0.02 | AF increment per new low in short mode |
| afMaxShort | 0.20 | Maximum AF in short mode |
### Quality Metrics (1–10 Scale)
| Metric | Score | Rationale |
|--------|-------|-----------|
| Trend detection | 7 | Good in strong trends; whipsaws in ranges |
| Responsiveness | 9 | Asymmetric AF allows direction-tuned speed |
| False signals | 6 | offsetOnReverse can reduce whipsaw vs PSAR |
| Flexibility | 10 | 8 parameters cover symmetric and asymmetric use cases |
| Universality | 8 | Works on any timeframe and asset class |
## Common Pitfalls
1. **Asymmetric AF confusion**: The 8-parameter surface is large. Setting `afInitShort` very high (e.g., 0.10) makes short stops very tight, triggering rapid reversals back to long. Start with symmetric defaults and tune one side at a time.
2. **startValue vs auto-detect**: When `startValue != 0`, the initial SAR level is the absolute value of `startValue`, not derived from price data. If the chosen value is far from current price, the first few bars' SAR may be unrealistic.
3. **offsetOnReverse sign convention**: On long→short reversal, offset is *added* (moves SAR higher, further from price). On short→long reversal, offset is *subtracted* (moves SAR lower, further from price). Both increase the buffer between SAR and price at reversal points.
4. **Sign-encoded output**: Unlike PSAR which always outputs a positive SAR level, SAREXT encodes direction into the sign. Always use `Math.Abs(value)` for the actual SAR level, or use the `Sar` property directly.
6. **2-bar warmup**: SAREXT requires 2 bars (vs PSAR's 1 bar) because it needs two bars to compute directional movement for auto-detection.
## References
- Wilder, J. W. Jr. (1978). *New Concepts in Technical Trading Systems*. Trend Research. ISBN 978-0894590276.
- TA-Lib. "TA_SAREXT — SAR — Parabolic SAR — Extended."
- Kaufman, P. J. (2013). *Trading Systems and Methods*, 5th ed. Wiley.
Indikator

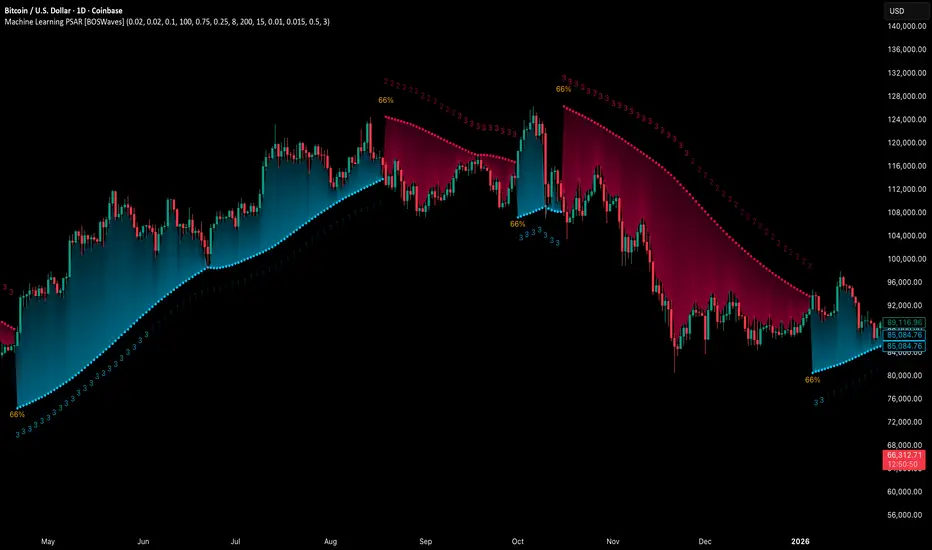
Machine Learning PSAR [BOSWaves]Machine Learning PSAR - Adaptive Parabolic Stop and Reverse with K-Means Regime Detection and KNN Signal Validation
Overview
Machine Learning PSAR is a regime-aware trend reversal system that tracks directional price movement through an adaptive Parabolic SAR, where acceleration parameters dynamically adjust based on market regime classification and each reversal signal is validated against historically similar setups using a K-Nearest Neighbors scoring model.
Instead of relying on fixed acceleration factors or unfiltered SAR flips, trend state, parameter scaling, and signal confidence are determined through K-Means flip-frequency clustering, KNN outcome weighting, and Kalman-filtered output smoothing that maintains visual clarity without sacrificing reversal responsiveness.
This creates a SAR system that reflects actual market conditions rather than applying the same parameters regardless of context - tightening in trending environments where acceleration should build quickly, relaxing in choppy conditions where early flips are noise, and scoring every reversal against the historical record so confidence is quantified rather than assumed.
Price is therefore evaluated relative to a SAR that adapts to regime dynamics and historically validated reversal patterns rather than conventional fixed-parameter parabolic logic.
Conceptual Framework
Machine Learning PSAR is founded on the principle that meaningful reversal signals emerge when the SAR acceleration factor is calibrated to current market conditions, and when each flip is cross-referenced against similar historical flips to assess its probability of success.
Traditional PSAR implementations use fixed start, increment, and maximum AF values that ignore whether the market is trending or ranging. This framework replaces static acceleration logic with regime-driven parameter adaptation informed by flip frequency clustering, then layers a KNN validation pass on top to score each signal before it is presented.
Three core principles guide the design:
Acceleration factor behavior should adapt to the detected market regime, becoming more aggressive during trending conditions and more conservative during choppy ones.
Every SAR flip should be scored against historically similar setups so confidence is expressed as a quantified probability rather than a binary signal.
The displayed SAR line should be smooth enough for clean visual interpretation while remaining responsive enough that reversals are never delayed.
This shifts SAR analysis from a fixed-parameter trailing stop into an adaptive, regime-anchored reversal system with integrated signal confidence measurement.
Theoretical Foundation
The indicator combines classical Parabolic SAR logic, K-Means-inspired regime classification, K-Nearest Neighbors outcome scoring, exponential AF smoothing, and Kalman filter output processing.
Flip frequency over a configurable training period provides the feature for regime classification, with centroid distances determining whether the market is trending, neutral, or choppy. KNN validation uses a five-dimensional feature vector at each flip — prior trend duration, bars since last flip, AF at flip, flip frequency, and EP progress — to find the most similar historical flips and weight their outcomes by proximity. The Kalman filter then smooths the final SAR output while snapping to new values instantly on every reversal.
Four internal systems operate in tandem:
Adaptive PSAR Engine : Computes classical parabolic SAR with optional AF smoothing and minimum bars filter to suppress whipsaw flips.
K-Means Regime Classifier : Measures flip frequency relative to its historical range, assigns the current bar to the nearest of three regime centroids, and adjusts AF start, increment, and maximum accordingly.
KNN Signal Validator : On each flip, searches historical flips for the k most similar setups by Euclidean distance, computes an inverse-distance-weighted confidence score, and filters low-confidence signals from high-confidence alerts.
Kalman Smoothing Layer : Applies a recursive Kalman filter to the SAR output for display, balancing smoothness with responsiveness and resetting on every reversal so flips are never visually delayed.
This design allows reversal signals to reflect actual market behavior and historical precedent rather than reacting mechanically to fixed acceleration rules.
How It Works
Machine Learning PSAR evaluates price through a sequence of regime-aware and historically-validated processes:
PSAR Initialization : Classical parabolic SAR begins with base AF start value, tracking EP and advancing the stop in the trend direction.
AF Smoothing : Instead of stepping AF in discrete increments, exponential smoothing ramps it gradually toward the target, producing a more fluid SAR trajectory.
Minimum Bars Filter : Trend must persist for a configurable minimum number of bars before a flip is allowed, preventing immediate whipsaw reversals.
Flip Detection : Price crossing the SAR triggers a raw flip, resetting AF, capturing the new EP, and recording trend duration and context features.
Flip Frequency Measurement : Rolling count of flips over the training period, normalized to its historical range, provides the regime classification feature.
Regime Assignment : Flip frequency is compared against three percentile-anchored centroids; the nearest centroid determines whether the market is choppy, neutral, or trending.
Parameter Adaptation : Regime assignment scales AF start, increment, and maximum — reducing them in choppy conditions to slow the SAR, increasing them in trending conditions to accelerate it.
KNN Feature Construction : At each flip, a five-dimensional vector is built from current context and compared against all historical flips of the same direction within the lookback window.
Neighbor Scoring : The k closest historical flips by Euclidean distance are retrieved; each is weighted by inverse distance and its five-bar forward outcome determines a weighted success rate.
Confidence Assignment : Weighted success rate expressed as a 0–100% confidence score, with flips below the minimum threshold classified as low-confidence.
Kalman Filtering : SAR value is passed through a Kalman filter for display smoothing, with process and measurement noise configurable; filter snaps to new SAR position on every flip.
Confidence Fill : Fill opacity between SAR and price anchor reflects current confidence score — denser fill indicates higher conviction in the active trend.
Together, these elements form a continuously updating reversal framework anchored in regime awareness and historically validated signal quality.
Interpretation
Machine Learning PSAR should be interpreted as a confidence-weighted trend reversal system with regime-adaptive sensitivity:
Bullish State (Blue) : Established when price closes above the SAR after a validated bullish flip, with SAR acting as a dynamic trailing support level below price.
Bearish State (Red) : Established when price closes below the SAR after a validated bearish flip, with SAR acting as a dynamic trailing resistance level above price.
Confidence Fill : Gradient zone between SAR and price reflects KNN confidence — vivid, dense fill indicates high historical precedent for the current flip; faint fill indicates low confidence.
Confidence Score Labels : Percentage label at each flip displays the KNN confidence score. Green (70%+) indicates strong historical backing; orange (50–69%) indicates moderate backing; red (below 50%) indicates low historical support.
Regime Labels : Numbers displayed alongside the SAR indicate current market regime — 3 for trending, 2 for neutral, 1 for choppy — reflecting the K-Means classifier output in real time.
High-Confidence Flips : Flips meeting or exceeding the minimum confidence threshold trigger alerts and represent the primary actionable signals.
Low-Confidence Flips : Flips below the confidence threshold are still displayed but excluded from high-confidence alerts, flagging setups with weak historical precedent.
Regime classification, KNN confidence, and Kalman-smoothed SAR position together outweigh any isolated price movement against the stop.
Signal Logic & Visual Cues
Machine Learning PSAR presents two primary signal categories:
High-Confidence Flip : SAR reversal with KNN score at or above the minimum confidence threshold. These represent setups where historically similar conditions produced successful reversals at a statistically meaningful rate and form the basis for alert-driven systematic monitoring.
Low-Confidence Flip : SAR reversal with KNN score below the minimum confidence threshold. The signal is displayed for awareness but is not included in high-confidence alert conditions, reflecting limited historical precedent.
Regime labels provide continuous market context between flips, allowing real-time awareness of whether the K-Means system is operating in a trending, neutral, or choppy environment. Confidence fill intensity provides a passive, non-disruptive view of trend conviction without requiring active label reading.
Alert generation covers high-confidence bullish and bearish flips, separately triggerable 70%+ confidence signals, and regime transition events for systematic monitoring of market state changes.
Strategy Integration
Machine Learning PSAR fits within adaptive trend-following and signal-quality-filtered reversal approaches:
Confidence-Gated Entries : Enter reversals only on high-confidence flips, using the minimum confidence threshold as a quality gate that filters historically weak setups.
Regime-Aware Sizing : Increase position sizing during trending regime (label 3) where the K-Means system detects low flip frequency and sustained directional conviction.
Choppy Market Avoidance : Reduce or pause activity during choppy regime (label 1) where frequent flips indicate low directional conviction and elevated whipsaw risk.
SAR as Stop Placement : Use the Kalman-smoothed SAR as a trailing stop reference — exit longs when price closes below the bullish SAR, exit shorts when price closes above the bearish SAR.
Confidence Fill Monitoring : Use fill intensity as a passive conviction gauge — fading fill during an active trend may indicate the next flip is likely to be lower confidence.
Multi-Timeframe Regime Alignment : Apply higher-timeframe regime label as a directional filter, entering signals only when the regime aligns across timeframes.
Alert-Based Systematic Monitoring : Configure high-confidence and regime-change alerts for systematic notification without requiring active chart monitoring.
Technical Implementation Details
Core Engine : Classical Parabolic SAR with configurable base AF start, increment, and maximum, optional exponential AF smoothing, and minimum bars flip filter
Regime Model : Flip frequency normalized to training-period range with three percentile-anchored centroids (choppy, neutral, trending) and nearest-centroid assignment
KNN Validator : Five-dimensional feature vector with configurable k and lookback, inverse-distance weighting, and five-bar forward outcome labeling
Smoothing Layer : Kalman filter with configurable process and measurement noise, hard snap to SAR on every flip to preserve reversal timing
Visualization : Dual-plot SAR circles with confidence-opacity fill, percentage confidence labels, every-other-bar regime labels
Signal Logic : High/low confidence classification with configurable minimum threshold, raw flip detection decoupled from display
Performance Profile : Optimized for real-time execution across all timeframes with efficient array-based KNN search and FIFO distance sorting
Optimal Application Parameters
Timeframe Guidance:
1 - 5 min : Scalping with tighter AF values, shorter KNN lookback, and lower minimum confidence threshold
15 - 60 min : Intraday trend following with balanced regime sensitivity and moderate confidence filtering
4H - Daily : Swing and position trading with wider AF maximum, longer training period, and higher confidence threshold
Suggested Baseline Configuration:
Base AF Start : 0.02
Base AF Increment : 0.02
Base AF Maximum : 0.10
Training Data Period : 100
Choppy Regime Percentile : 0.75
Trending Regime Percentile : 0.25
K - Number of Neighbors : 8
Historical Lookback Period : 200
Minimum Confidence Filter : 15%
AF Smoothing Factor : 0.01
Kalman Process Noise : 0.015
Kalman Measurement Noise : 0.5
Minimum Bars Before Flip : 3
These suggested parameters should be used as a baseline; their effectiveness depends on the asset's volatility profile, trending characteristics, and preferred signal frequency, so fine-tuning is expected for optimal performance.
Parameter Calibration Notes
Use the following adjustments to refine behavior without altering the core logic:
Too many flips in ranging markets : Increase Minimum Bars Before Flip to require longer trend duration before a reversal is allowed, or increase Base AF Maximum to widen the SAR distance.
SAR too slow to reverse : Decrease Base AF Start and increase Base AF Increment so the acceleration factor builds more quickly during new trends.
Excessive low-confidence signals : Increase Minimum Confidence Filter to raise the threshold for high-confidence classification, focusing only on the strongest historical precedents.
KNN scores feel unstable : Increase K - Number of Neighbors to average over more historical examples, smoothing out per-flip score variance.
Regime changing too rapidly : Increase Training Data Period to smooth regime classification over a longer flip-frequency history.
Regime too slow to update : Decrease Training Data Period for more responsive regime detection that reacts faster to market character shifts.
SAR line too jumpy visually : Increase Kalman Measurement Noise for more aggressive smoothing, or decrease Kalman Process Noise to make the filter trust its own estimate more.
Kalman lagging reversals : Decrease Kalman Measurement Noise or increase Kalman Process Noise to make the filter more responsive to SAR changes between flips.
AF ramping too abruptly : Decrease AF Smoothing Factor toward 0.01 for a more gradual exponential ramp from start to target AF on each new trend.
Adjustments should be incremental and evaluated across multiple market sessions rather than isolated conditions.
Performance Characteristics
High Effectiveness:
Trending markets with sustained directional conviction where flip frequency remains low and regime classification stabilizes at label 3
Instruments with consistent volatility where ATR-normalized KNN features generalize well across historical flips
Momentum continuation strategies using SAR as a trailing stop with confidence-filtered entries at reversals
Systematic approaches benefiting from quantified signal confidence and regime-based parameter adaptation
Multi-timeframe frameworks where regime labels provide higher-timeframe directional context for lower-timeframe entries
Reduced Effectiveness:
Choppy, range-bound markets with high flip frequency causing frequent low-confidence signals and regime label 1 classification
Extremely thin historical data environments where the KNN lookback contains insufficient comparable flips for reliable scoring
News-driven or gapped markets where discrete price discontinuities bypass SAR logic and invalidate ATR-normalized tension features
Very low volatility instruments where ATR scaling compresses feature vectors and reduces KNN discriminative power
Consolidation phases where mean-reversion dominance causes repeated SAR whipsaws regardless of minimum bars filtering
Integration Guidelines
Confluence : Combine with BOSWaves volume analysis, structure detection, or supply and demand zone identification for multi-factor confirmation
SAR Respect : Honor the trailing SAR as the primary risk boundary — avoid holding positions against the active stop regardless of confidence score
Confidence Awareness : Treat confidence scores as probabilistic context, not certainty — high scores improve odds but do not guarantee outcome
Regime Discipline : Reduce activity during persistent choppy regime classification rather than fighting repeated low-confidence flips
Alert Utilization : Configure high-confidence and regime-change alerts to enable systematic monitoring without requiring active chart observation
Lookback Sufficiency : Ensure sufficient historical bars are loaded for the KNN lookback period before relying on confidence scores, particularly on shorter timeframes
Multi-Timeframe Alignment : Use higher timeframe regime label and trend direction as a filter for lower timeframe flip entries to ensure directional confluence
Disclaimer
Machine Learning PSAR is a professional-grade adaptive reversal and trend-following tool. It uses K-Means regime classification and KNN signal validation to adapt classical Parabolic SAR behavior to current market conditions but does not predict future price movements. Results depend on market conditions, volatility characteristics, parameter selection, and disciplined execution. BOSWaves recommends deploying this indicator within a broader analytical framework that incorporates price structure, volume context, and comprehensive risk management. Indikator
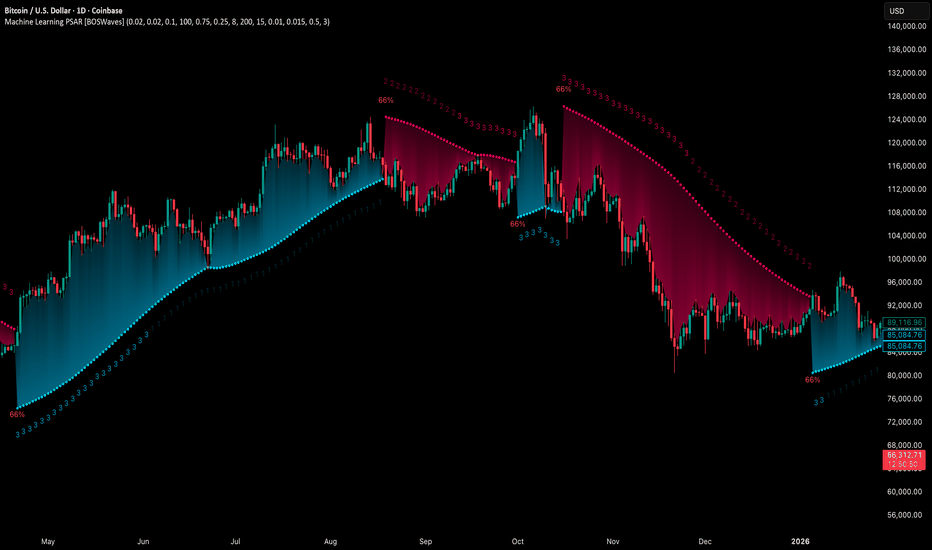
PSAR Laboratory [DAFE]PSAR Laboratory : The Ultimate Adaptive Trailing Stop & Reversal Engine
23 Advanced Algorithms. Adaptive Acceleration. Smart Flip Logic. Parabolic SAR Reimagined.
█ PHILOSOPHY: WELCOME TO THE LABORATORY
The standard Parabolic SAR, created by the legendary J. Welles Wilder Jr., is a tool of beautiful simplicity. But in today's complex, algorithm-driven markets, its simplicity is its fatal flaw. Its fixed acceleration and rigid flip logic cause it to fail precisely when you need it most: it whipsaws in choppy conditions and gives back too much profit in strong trends.
The PSAR Laboratory was not created to be just another PSAR. It was engineered to be the definitive evolution of Wilder's original concept. This is not an indicator; it is a powerful, interactive research environment. It is a sandbox where you, the trader, can move beyond the static "one-size-fits-all" approach and forge a PSAR that is perfectly adapted to your specific market, timeframe, and trading style.
We have deconstructed the very DNA of the Parabolic SAR and rebuilt it from the ground up, infusing it with modern quantitative techniques. The result is an institutional-grade suite of 23 distinct, mathematically diverse algorithms that dynamically control every aspect of the PSAR's behavior.
█ WHAT MAKES THIS A "LABORATORY"? THE CORE INNOVATIONS
This tool stands in a class of its own. It is a collection of what could be 23 separate indicators, all seamlessly integrated into one powerful engine.
The 23 Algorithm Engine: This is the heart of the Laboratory. Instead of one rigid formula, you have a library of 23 unique mathematical engines at your command. These algorithms are not simple tweaks; they are complete re-imaginings of how the PSAR should behave, based on concepts from information theory, digital signal processing, fractal geometry, and institutional analysis.
Truly Adaptive Acceleration (AF): The standard PSAR's "gas pedal" (the AF) is dumb; it accelerates at a fixed rate. Our algorithms make it intelligent. The AF can now speed up in clean, trending environments to lock in profits, and automatically slow down in choppy, chaotic conditions to avoid whipsaws.
Advanced Flip Confirmation Logic: Say goodbye to noise-driven flips. You are no longer at the mercy of a single wick touching the SAR. The Laboratory provides multiple layers of flip confirmation, including requiring a bar close beyond the SAR, a volume spike to validate the reversal, or even a multi-bar confirmation .
Comprehensive Noise Filtering Core: In a revolutionary step, you can apply one of over 30 advanced signal processing filters directly to the SAR output itself. From ultra-low-lag filters like the Hull MA and DAFE Spectral Laguerre to adaptive filters like KAMA and FRAMA , you can surgically remove noise while preserving the responsiveness of the core signal.
Integrated Performance Engine: How do you know which of the 23 algorithms is best for your market? You test it. The built-in Performance Dashboard is a comprehensive backtesting and analytics engine that tracks every trade, providing real-time data on Win Rate, Profit Factor, Max Drawdown, and more. It allows you to scientifically validate your chosen configuration.
█ A GUIDED TOUR OF THE ALGORITHMS: 23 PATHS TO AN EDGE
b]These 23 algorithms are not simple settings; they are distinct mathematical philosophies for how a Parabolic SAR should adapt to the market. They are grouped into three primary categories: those that adapt the Acceleration Factor (AF) , those that enhance the Extreme Point (EP) detection, and those that redefine the Flip Logic .
CATEGORY A: ACCELERATION FACTOR (AF) ADAPTATION
These algorithms dynamically change the "gas pedal" of the PSAR.
1. Volatility-Scaled AF
Core Concept: Treats volatility as market friction. The PSAR should be more forgiving in high-volatility environments.
How It Works: It calculates a Volatility Ratio by comparing the short-term ATR to the long-term ATR. If current volatility is high (ratio > 1), it reduces the AF Step. If volatility is low (ratio < 1), it increases the AF Step to trail tighter.
Ideal Use Case: The best all-rounder. Excellent for any market, especially those with clear shifts between high and low volatility regimes (like indices and crypto).
2. Efficiency Ratio (ER) AF
Core Concept: The PSAR should accelerate aggressively in clean, efficient trends and slow down dramatically in choppy, inefficient markets.
How It Works: It uses Kaufman's Efficiency Ratio (ER), which measures the net directional movement versus the total price movement. A high ER (near 1.0) signifies a pure trend, triggering a high AF multiplier. A low ER (near 0.0) signifies chop, triggering a low AF multiplier.
Ideal Use Case: Markets that alternate between strong trends and sideways chop. It is exceptionally good at surviving ranging periods.
3. Shannon Entropy AF
Core Concept: Uses Information Theory to measure market disorder. The PSAR should be conservative in chaos and aggressive in order.
How It Works: It calculates the Shannon Entropy of recent price changes. High entropy means the market is unpredictable ("chaotic"), causing the AF to slow down. Low entropy means the market is organized and trending, causing the AF to speed up.
Ideal Use Case: Advanced traders looking for a mathematically pure way to distinguish between a tradable trend and random noise.
4. Fractal Dimension (FD) AF
Core Concept: Measures the "jaggedness" or complexity of the price path. A smooth path is a trend; a jagged, space-filling path is chop.
How It Works: It calculates the Fractal Dimension of the price series. An FD near 1.0 is a smooth line (high AF). An FD near 1.5 is a random walk (low AF).
Ideal Use Case: Visually identifying the moment a smooth trend begins to break down into chaotic, unpredictable movement.
5. ADX-Gated AF
Core Concept: Uses the classic ADX indicator to confirm the presence of a trend before allowing the PSAR to accelerate.
How It Works: If the ADX value is above a "Strong" threshold (e.g., 25), the AF accelerates normally. If the ADX is below a "Weak" threshold (e.g., 15), the AF is "frozen" and will not increase, preventing the SAR from tightening up in a non-trending market.
Ideal Use Case: For classic trend-following purists who trust the ADX as their primary regime filter.
6. Kalman AF Estimator
Core Concept: A sophisticated signal processing algorithm that predicts the "true" optimal AF by filtering out price "noise."
How It Works: It treats the PSAR's AF as a state to be estimated. It makes a prediction, then corrects it based on how far the actual price deviates. It's like a GPS constantly refining its position. The "Process Noise" input controls how fast it thinks the AF can change, while "Measurement Noise" controls how much it trusts the price data.
Ideal Use Case: Smooth, high-inertia markets like commodities or major forex pairs. It creates an incredibly smooth and responsive AF.
7. Volume-Momentum AF
Core Concept: A trend's acceleration is only valid if confirmed by both volume and price momentum.
How It Works: The AF will only increase if a new Extreme Point is made on above-average volume AND the Rate of Change (ROC) of the price is aligned with the trend's direction.
Ideal Use Case: Any market with reliable volume data (stocks, futures, crypto). It's excellent for filtering out low-conviction moves.
8. Garman-Klass (GK) AF
Core Concept: Uses a more advanced, statistically efficient measure of volatility (Garman-Klass, which uses OHLC data) to adapt the AF.
How It Works: It modulates the AF based on whether the current GK volatility is higher or lower than its historical average. Unlike the standard Volatility-Scaled algo, it tends to slow down more in high volatility and speed up less in low volatility, making it more conservative.
Ideal Use Case: Traders who want a volatility-adaptive model that is more focused on risk reduction during volatile periods.
9. RSI-Modulated AF
Core Concept: The RSI can identify points of potential trend exhaustion or strong momentum.
How It Works: If a trend is bullish but the RSI enters the "Overbought" zone, the AF slows down, anticipating a pullback. Conversely, if the RSI is in the strong momentum mid-range (40-60), the AF is boosted to trail more aggressively.
Ideal Use Case: Mean-reversion traders or those who want to automatically loosen their trail stop near potential exhaustion points.
10. Bollinger Squeeze AF
Core Concept: A Bollinger Band Squeeze signals a period of volatility compression, often preceding an explosive breakout.
How It Works: When the algorithm detects that the Bollinger Band Width is in a "Squeeze" (below a certain historical percentile), it boosts the AF in anticipation of a fast move, allowing the PSAR to catch the breakout quickly.
Ideal Use Case: Breakout traders. This algorithm primes the PSAR to be maximally responsive right at the moment a breakout is most likely.
11. Keltner Adaptive AF
Core Concept: Keltner Channels provide a robust measure of a trend's "normal" volatility channel.
How It Works: When price is trading strongly outside the Keltner Channel, it's considered a powerful trend, and the AF is boosted. When price falls back inside the channel, it's considered a consolidation or pullback, and the AF is slowed down.
Ideal Use Case: Trend followers who use channel breakouts as their primary confirmation.
12. Choppiness-Gated AF
Core Concept: Uses the Choppiness Index to quantify whether the market is trending or consolidating.
How It Works: If the Choppiness Index is below the "Trend" threshold (e.g., 38.2), the AF is boosted. If it's above the "Range" threshold (e.g., 61.8), the AF is significantly reduced.
Ideal Use Case: A more responsive alternative to the ADX-Gated algorithm for distinguishing between trending and ranging markets.
13. VIDYA-Style AF
Core Concept: Uses a Chande Momentum Oscillator (CMO) to create a variable-speed acceleration factor.
How It Works: The absolute value of the CMO is used to create a dynamic smoothing constant. Strong momentum (high absolute CMO) results in a faster, more responsive AF. Weak momentum results in a slower, smoother AF.
Ideal Use Case: Momentum traders who want their trailing stop's speed directly tied to the momentum of the price itself.
14. Hilbert Cycle AF
Core Concept: Uses Ehlers' Hilbert Transform to extract the dominant cycle period of the market and synchronizes the PSAR with it.
How It Works: It dynamically adjusts the AF based on the detected cycle period (shorter cycles = faster AF) and can also modulate it based on the current phase within that cycle (e.g., accelerate faster near cycle tops/bottoms).
Ideal Use Case: Markets with clear cyclical behavior, like commodities and some forex pairs.
CATEGORY B: EXTREME POINT (EP) ENHANCEMENT
These algorithms make the detection of new highs/lows more intelligent.
15. Volume-Weighted EP
Core Concept: A new high or low is more significant if it occurs on high volume.
How It Works: It can be configured to only accept a new EP if the volume on that bar is above average. It can also "weight" the EP by volume, pushing it further out on high-volume bars.
Ideal Use Case: Filtering out weak, low-conviction price probes in markets with reliable volume.
16. Wavelet Filtered EP
Core Concept: Uses wavelet decomposition (a signal processing technique) to separate the underlying trend from high-frequency noise.
How It Works: It calculates a smoothed, wavelet-filtered version of the price. A new EP is only registered if the actual high/low significantly exceeds this smoothed baseline, effectively ignoring minor noise spikes.
Ideal Use Case: Noisy markets where small, insignificant wicks can cause the AF to accelerate prematurely.
17. ATR-Validated EP
Core Concept: A new EP should represent a meaningful move, not just a one-tick poke.
How It Works: It requires a new high/low to exceed the previous EP by a minimum amount, defined as a multiple of the current ATR. This ensures only volatility-significant advances are counted.
Ideal Use Case: A simple, robust way to filter out "noise" EPs and slow down the AF's acceleration in choppy conditions.
18. Statistical EP Filter
Core Concept: A new EP is only valid if the price change that created it is statistically significant.
How It Works: It calculates the Z-Score of the bar's price change relative to recent history. A new EP is only accepted if its Z-Score exceeds a certain threshold (e.g., 1.5 sigma), meaning it was an unusually strong move.
Ideal Use Case: For quantitative traders who want to ensure their trailing stop only tightens in response to statistically meaningful price action.
CATEGORY C: FLIP LOGIC & CONFIRMATION
These algorithms change the very rules of when and why the PSAR reverses.
19. Dual-PSAR Gate
Core Concept: Uses two PSARs—one fast and one slow—to confirm a reversal.
How It Works: A flip signal for the main PSAR is only considered valid if both the fast (sensitive) PSAR and the slow (structural) PSAR have flipped. This acts as a powerful trend filter.
Ideal Use Case: An excellent method for reducing whipsaws. It forces the PSAR to wait for both short-term and longer-term momentum to align before signaling a reversal.
20. MTF Coherence PSAR
Core Concept: Do not flip against the higher timeframe macro trend.
How It Works: It pulls PSAR data from two higher timeframes. A flip is only allowed if the new direction does not contradict the trend on at least one (or both) of those higher timeframes. It also boosts the AF when all timeframes are aligned.
Ideal Use Case: The ultimate tool for multi-timeframe traders who want to ensure their entries and exits are in sync with the bigger picture.
21. Momentum-Gated Flip
Core Concept: A reversal is only valid if it is supported by a significant surge of momentum.
How It Works: A price cross of the SAR is not enough. The script also requires the Rate of Change (ROC) to exceed a certain threshold for a set number of bars, confirming that there is real force behind the reversal.
Ideal Use Case: Filtering out weak, drifting reversals and only taking signals that are initiated with explosive power.
22. Close-Only PSAR
Core Concept: Wicks are noise; the bar's close is the final decision.
How It Works: This algorithm modifies the flip logic to ignore wicks. A flip only occurs if one or more bars close beyond the SAR line.
Ideal Use Case: One of the most effective and simple ways to reduce false signals from volatile wicks. A fantastic default choice for any trader.
23. Ultimate PSAR Consensus
Core Concept: The highest conviction signal comes from the agreement of multiple, diverse mathematical models.
How It Works: This is the capstone algorithm. It runs a "vote" between a selection of the top-performing algorithms (e.g., Volatility-Scaled, Efficiency Ratio, Dual-PSAR). A flip is only signaled if a majority consensus is reached. It can even weight the votes based on each algorithm's recent performance.
Ideal Use Case: For traders who want the absolute highest level of confirmation and are willing to accept fewer, but more robust, signals.
█ PART II: THE NOISE FILTERING CORE - The Shield
This is a revolutionary feature that allows you to apply a second layer of signal processing directly to the SAR line itself, surgically removing noise before the flip logic is even considered.
FILTER CATEGORIES
Basic Filters (SMA, EMA, WMA, RMA): The classic moving averages. They provide basic smoothing but introduce significant lag. Best used for educational purposes.
Low-Lag Filters (DEMA, TEMA, Hull MA, ZLEMA): A family of filters designed to reduce the lag inherent in basic moving averages. The Hull MA is a standout, offering a superb balance of smoothness and responsiveness.
Adaptive Filters (KAMA, VIDYA, FRAMA): These are "smart" filters. They automatically adjust their smoothing level based on market conditions. They will be very smooth in choppy markets and become highly responsive in trending markets.
Advanced DSP & DAFE Filters: This is the pinnacle of signal processing.
Ehlers Filters (SuperSmoother, 2-Pole, 3-Pole): Based on the work of John Ehlers, these use digital signal processing techniques to remove high-frequency noise with minimal lag.
Gaussian & ALMA: These use a bell-curve weighting, giving the most importance to recent data in a smooth, non-linear fashion.
DAFE Spectral Laguerre: A proprietary, non-linear filter that uses a feedback loop and adapts its "gamma" based on volatility, providing exceptional tracking in all market conditions.
How to Choose a Filter
Start with "None": First, find an algorithm you like with no filtering to understand its raw behavior.
Introduce Low Lag: If you are getting too many whipsaws from noise, apply a short-length Hull MA (e.g., 5-8). This is often the best solution.
Go Adaptive: If your market has very distinct trend/chop regimes, try an Adaptive KAMA .
Maximum Purity: For the smoothest possible output with excellent responsiveness, use the DAFE Spectral Laguerre or Ehlers SuperSmoother .
█ THE VISUAL EXPERIENCE: DATA AS ART
The PSAR Laboratory is not just functional; it is beautiful. The visualization engine is designed to provide you with an intuitive, at-a-glance understanding of the market's state.
Algorithm-Specific Theming: Each of the 23 algorithms comes with its own unique, professionally designed color palette. This not only provides visual variety but allows you to instantly recognize which engine is active.
Dynamic Glow Effects: For many algorithms, the PSAR dots will emit a soft "glow." The brightness and color of this glow are not random; they are tied to a key metric of the active algorithm (e.g., trend strength, volatility, consensus), providing a subtle, visual cue about the health of the trend.
Adaptive Volatility Bands: Certain algorithms will display dynamic bands around the PSAR. These are not standard deviation bands; their width is controlled by the specific logic of the active algorithm, showing you a visual representation of the market's expected range or energy level.
Secondary Reference Lines: For algorithms like the Dual-PSAR or MTF Coherence, a secondary line will be plotted on the chart, giving you a clear visual of the underlying data (e.g., the slow PSAR, the HTF trend) that is driving the decision-making process.
█ THE MASTER DASHBOARD: YOUR MISSION CONTROL
The comprehensive dashboard is your unified command center for analysis and performance tracking.
Engine Status: See the currently selected Algorithm, the active Noise Filter, the Trend direction, and a real-time progress bar of the current Acceleration Factor (AF).
Algorithm-Specific Metrics: This is the most powerful section. It displays the key real-time data from the currently active algorithm. If you're using "Shannon Entropy," you'll see the Entropy score. If you're using "ADX-Gated," you'll see the ADX value. This gives you a direct, quantitative look under the hood.
Performance Readout: When enabled, this section provides a full breakdown of your backtesting results, including Win Rate, Profit Factor, Net P&L, Max Drawdown, and your current trade status.
█ DEVELOPMENT PHILOSOPHY
The PSAR Laboratory was born from a deep respect for Wilder's original work and a relentless desire to push it into the 21st century. We believe that in modern markets, static tools are obsolete. The future of trading lies in adaptation. This indicator is for the serious trader, the tinkerer, the scientist—the individual who is not content with a black box, but who seeks to understand, test, and refine their edge with surgical precision. It is a tool for forging, not just following.
The PSAR Laboratory is designed to be the ultimate tool for that evolution, allowing you to discover and codify the rules that truly fit you.
█ DISCLAIMER AND BEST PRACTICES
THIS IS A TOOL, NOT A STRATEGY: This indicator provides a sophisticated trailing stop and reversal signal. It must be integrated into a complete trading plan that includes risk management, position sizing, and your own contextual analysis.
TEST, DON'T GUESS: The power of this tool is its adaptability. Use the Performance Dashboard to rigorously test different algorithms and settings on your chosen asset and timeframe. Find what works, and build your strategy around that data.
START SIMPLE: Begin with the "Volatility-Scaled AF" algorithm, as it is a powerful and intuitive all-rounder. Once you are comfortable, begin experimenting with other engines.
RISK MANAGEMENT IS PARAMOUNT: All trading involves substantial risk. The backtesting results are hypothetical and do not account for slippage or psychological factors. Never risk more capital than you are prepared to lose.
"I don't think traders can follow rules for very long unless they reflect their own trading style. Eventually, a breaking point is reached and the trader has to quit or change, or find a new set of rules he can follow. This seems to be part of the process of evolution and growth of a trader."
— Ed Seykota, Market Wizard
Taking you to school. - Dskyz, Trade with Volume. Trade with Density. Trade with DAFE Indikator
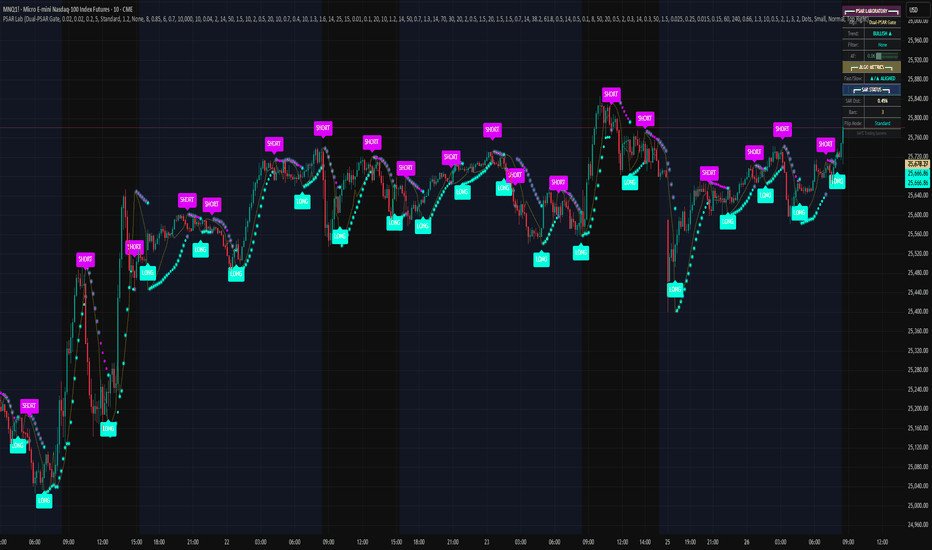
Indikator
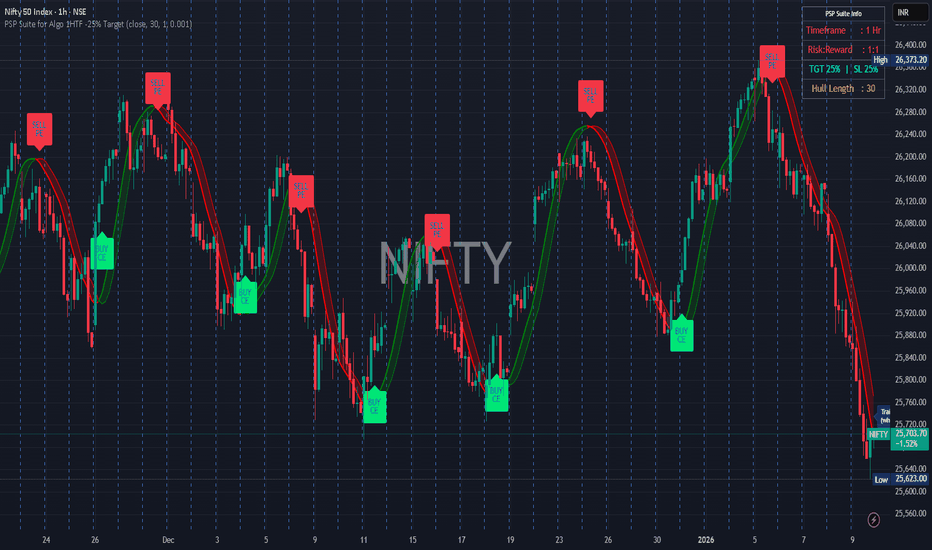
Indikator

PSAR with ATR Trailing Stop + SMA Filter📈 Strategy Overview: PSAR + 6×ATR Trailing Stop with SMA Filter
This strategy is built around the principle of “Cut the losers, let the winners run” — a disciplined, trend-following approach that combines the Parabolic SAR indicator with dynamic risk management and a Simple Moving Average (SMA) trend filter.
🔍 Strategy Logic
Trend Filter Trades are only taken in the direction of the prevailing trend, defined by a user-selected SMA (default: 100).
✅ Long trades only when price is above the SMA
✅ Short trades only when price is below the SMA
Entry Signal: A trade is triggered when the Parabolic SAR flips to the opposite side of the price bars, signaling a potential trend reversal.
Stop Loss: The stop loss is dynamically set at 6×ATR from the entry price. This adapts to market volatility and is recalculated every bar — effectively acting as a trailing stop.
Exit Logic: There is no fixed take profit. The trade remains open until the trailing stop is hit — allowing winners to run and losers to be cut quickly.
Risk Management: Each trade risks 0.5% of total equity, ensuring consistent position sizing and capital preservation.
📊 Visual Elements
PSAR dots mark trend direction changes
SMA line shows the broader trend filter
Trailing stop crosses (with 50% opacity) indicate the current stop level without cluttering the chart
⚙️ Customizable Inputs
PSAR parameters: Start, Increment, Maximum
ATR length and multiplier
SMA length
Risk percentage per trade
This strategy is ideal for traders who want to stay aligned with the trend, automate disciplined exits, and avoid emotional decision-making. Clean, simple, and powerful.
Wishing you calm and successful trades! Strategi

Hyper SAR Reactor Trend StrategyHyperSAR Reactor Adaptive PSAR Strategy
Summary
Adaptive Parabolic SAR strategy for liquid stocks, ETFs, futures, and crypto across intraday to daily timeframes. It acts only when an adaptive trail flips and confirmation gates agree. Originality comes from a logistic boost of the SAR acceleration using drift versus ATR, plus ATR hysteresis, inertia on the trail, and a bear-only gate for shorts. Add to a clean chart and run on bar close for conservative alerts.
Scope and intent
• Markets: large cap equities and ETFs, index futures, major FX, liquid crypto
• Timeframes: one minute to daily
• Default demo: BTC on 60 minute
• Purpose: faster yet calmer PSAR that resists chop and improves short discipline
• Limits: this is a strategy that places simulated orders on standard candles
Originality and usefulness
• Novel fusion: PSAR AF is boosted by a logistic function of normalized drift, trail is monotone with inertia, entries use ATR buffers and optional cooldown, shorts are allowed only in a bear bias
• Addresses false flips in low volatility and weak downtrends
• All controls are exposed in Inputs for testability
• Yardstick: ATR normalizes drift so settings port across symbols
• Open source. No links. No solicitation
Method overview
Components
• Adaptive AF: base step plus boost factor times logistic strength
• Trail inertia: one sided blend that keeps the SAR monotone
• Flip hysteresis: price must clear SAR by a buffer times ATR
• Volatility gate: ATR over its mean must exceed a ratio
• Bear bias for shorts: price below EMA of length 91 with negative slope window 54
• Cooldown bars optional after any entry
• Visual SAR smoothing is cosmetic and does not drive orders
Fusion rule
Entry requires the internal flip plus all enabled gates. No weighted scores.
Signal rule
• Long when trend flips up and close is above SAR plus buffer times ATR and gates pass
• Short when trend flips down and close is below SAR minus buffer times ATR and gates pass
• Exit uses SAR as stop and optional ATR take profit per side
Inputs with guidance
Reactor Engine
• Start AF 0.02. Lower slows new trends. Higher reacts quicker
• Max AF 1. Typical 0.2 to 1. Caps acceleration
• Base step 0.04. Typical 0.01 to 0.08. Raises speed in trends
• Strength window 18. Typical 10 to 40. Drift estimation window
• ATR length 16. Typical 10 to 30. Volatility unit
• Strength gain 4.5. Typical 2 to 6. Steepness of logistic
• Strength center 0.45. Typical 0.3 to 0.8. Midpoint of logistic
• Boost factor 0.03. Typical 0.01 to 0.08. Adds to step when strength rises
• AF smoothing 0.50. Typical 0.2 to 0.7. Adds inertia to AF growth
• Trail smoothing 0.35. Typical 0.15 to 0.45. Adds inertia to the trail
• Allow Long, Allow Short toggles
Trade Filters
• Flip confirm buffer ATR 0.50. Typical 0.2 to 0.8. Raise to cut flips
• Cooldown bars after entry 0. Typical 0 to 8. Blocks re entry for N bars
• Vol gate length 30 and Vol gate ratio 1. Raise ratio to trade only in active regimes
• Gate shorts by bear regime ON. Bear bias window 54 and Bias MA length 91 tune strictness
Risk
• TP long ATR 1.0. Set to zero to disable
• TP short ATR 0.0. Set to 0.8 to 1.2 for quicker shorts
Usage recipes
Intraday trend focus
Confirm buffer 0.35 to 0.5. Cooldown 2 to 4. Vol gate ratio 1.1. Shorts gated by bear regime.
Intraday mean reversion focus
Confirm buffer 0.6 to 0.8. Cooldown 4 to 6. Lower boost factor. Leave shorts gated.
Swing continuation
Strength window 24 to 34. ATR length 20 to 30. Confirm buffer 0.4 to 0.6. Use daily or four hour charts.
Properties visible in this publication
Initial capital 10000. Base currency USD. Order size Percent of equity 3. Pyramiding 0. Commission 0.05 percent. Slippage 5 ticks. Process orders on close OFF. Bar magnifier OFF. Recalculate after order filled OFF. Calc on every tick OFF. No security calls.
Realism and responsible publication
No performance claims. Past results never guarantee future outcomes. Shapes can move while a bar forms and settle on close. Strategies execute only on standard candles.
Honest limitations and failure modes
High impact events and thin books can void assumptions. Gap heavy symbols may prefer longer ATR. Very quiet regimes can reduce contrast and invite false flips.
Open source reuse and credits
Public domain building blocks used: PSAR concept and ATR. Implementation and fusion are original. No borrowed code from other authors.
Strategy notice
Orders are simulated on standard candles. No lookahead.
Entries and exits
Long: flip up plus ATR buffer and all gates true
Short: flip down plus ATR buffer and gates true with bear bias when enabled
Exit: SAR stop per side, optional ATR take profit, optional cooldown after entry
Tie handling: stop first if both stop and target could fill in one bar
Strategi

Indikator

Indikator