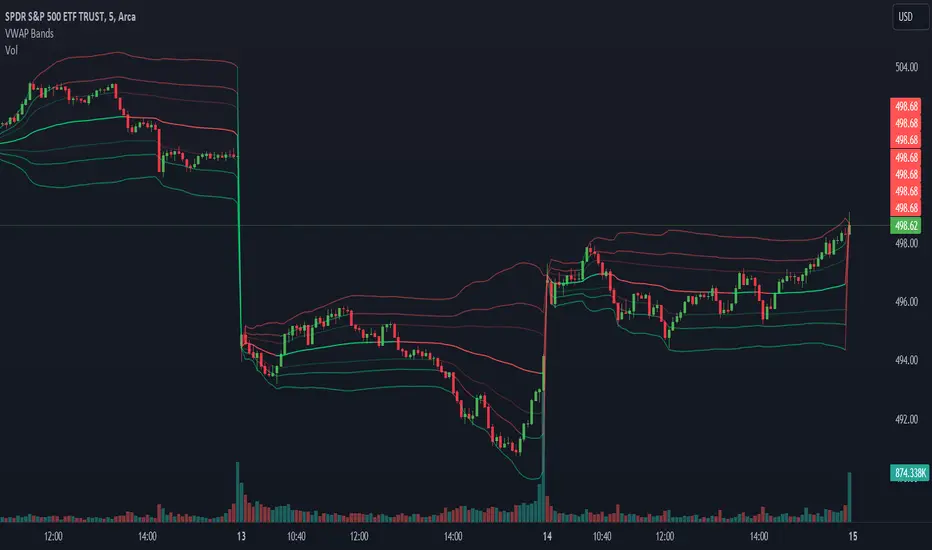
VWAPxLevels - OnlyFlowVWAPxLevels is a comprehensive VWAP-based indicator that combines real-time intraday volume-weighted average price calculations with previous-day reference levels. It's designed for traders who use VWAP and standard deviation bands as key support/resistance zones, with special offset functionality optimized for futures contracts like ES (E-mini S&P 500) and NQ (E-mini Nasdaq).
Key Features
Intraday VWAP with Triple Deviation Band Groups
The indicator plots the current session's VWAP along with three independently configurable groups of standard deviation bands:
Group 1 bands (default 1.0 stdev) for the inner mean-reversion zone
Group 2 bands (default 2.03 stdev) for moderate price extension zones
Group 3 bands (default 2.53 stdev) for extreme price extension zones
Each group can be toggled on or off and adjusted independently, giving you full control over which volatility layers are visible.
Previous Day Reference Levels
Automatically captures and plots the final values from the prior session:
Previous day's closing VWAP
Previous day's Group 1 upper and lower bands
Previous day's Group 2 upper and lower bands
Previous day's Group 3 upper and lower bands
These persistent levels often act as significant magnets and reaction zones in the current session.
Smart Offset Mode for Futures
A unique feature that applies preset offsets to previous-day levels, useful when trading correlated instruments or accounting for overnight gaps:
ES Mode: Applies a 0.5 point offset
NQ Mode: Applies a 2.5 point offset
None: Uses raw VWAP close values
When an offset mode is active, the indicator plots both upper and lower offset variations of the previous day's VWAP and all three deviation band groups, creating bracketed zones around each key level.
How to Use
The intraday VWAP serves as the session's mean price. Group 1 bands highlight the inner volatility envelope where price typically oscillates around fair value, while Group 2 and Group 3 bands identify progressively more extreme reversal or breakout zones. The previous day levels provide context from the prior session, helping identify areas where price has historically reacted. Use the offset mode when you want to create wider reaction zones or when trading futures contracts where slight adjustments to reference levels improve accuracy.
Customization
All three band groups and previous-day plots can be toggled independently through the input panel, letting you display only the levels relevant to your strategy. Deviation multipliers are fully adjustable to match your preferred volatility settings.
Best For
Day traders, scalpers, and futures traders who rely on VWAP-based mean reversion or breakout strategies and want layered volatility zones plus previous session reference levels integrated into a single clean indicator. Indikator

VWAP DeltaVWAP Delta is an oscillator that plots each bar's open, high, low and close as their distance from the volume-weighted average price, instead of showing price and VWAP side by side. It's built for anyone who wants to see how far, and how consistently, price is trading away from its volume-weighted average — for example to judge how stretched an intraday move already is, or how a recent push compares to the pace of previous ones — rather than only whether price sits above or below VWAP.
The delta of each bar is measured against an EMA baseline built from the delta close, and both can optionally be smoothed with a Hull moving average before that comparison. Because VWAP accumulates from the start of each session and depends on volume, it is an intraday tool and returns na on symbols or timeframes where volume data isn't available. The indicator can display this relationship as a filled area or as its own set of candles, with colors that adapt automatically to the current bias and, in candle style, to whether momentum is currently building or fading.
Calculation
VWAP Smoothing: applies a Hull moving average to the delta series before plotting, with an adjustable length.
Baseline Length: EMA length of the baseline that the delta is compared against.
Appearance
Graphic Style: visual style for the delta series: Area or Candle.
Bull / Bear Area Color: (Area style) fill color for when the delta line is above its baseline, and for when it's below.
Bull Candle Color: (Candle style) two colors for a bullish candle body — the left one while the body is expanding versus the previous bar, the right one while it's contracting.
Bear Candle Color: (Candle style) the same pair of colors for a bearish candle body.
In Area style, the delta close is plotted as a single line against its EMA baseline, and the space between them is filled — in Bull Area Color while the delta line is above the baseline, in Bear Area Color while it's below. Only the fill is visible; the delta and baseline lines themselves stay hidden. In Candle style, the fill disappears and the delta is drawn instead as its own set of candles, built from the delta's open, high, low and close relative to VWAP; when smoothing is enabled, the high and low are clamped to the smoothed open and close, so the smoothing itself can never invert a candle's body. Each candle is colored by comparing its own delta open and close: a candle whose delta close sits above its delta open takes a bull color, any other candle — including one where open and close are exactly equal — takes a bear color; within each of those two colors, the shade further distinguishes whether the current body is larger than the previous one (expanding) or smaller (contracting). A zero line marks where price and VWAP coincide.
This indicator is intended solely for market analysis and does not constitute investment advice or a guarantee of success. Use it at your own discretion and risk; past results are not indicative of future performance. Indikator

Indikator

Indikator

Indikator

VWAP Z-Score Oscillator**VWAP Z-Score Oscillator — Complete Description**
**Overview**
The indicator is a single-pane oscillator that measures how far price has moved from a rolling, volume-weighted average price. It answers one question on every bar: how far is price from its recent volume-weighted fair value, and how significant is that gap. The output can be shown either as a normalized standard-deviation reading or as the raw price distance, selectable by the user.
**Core Calculation**
- **Moving VWAP.** A rolling volume-weighted mean of price is computed over a user-set lookback. Unlike a session VWAP, it slides forward continuously and never resets at the session boundary.
- **Volume-weighted standard deviation.** The dispersion of price around that Moving VWAP is calculated as a volume-weighted variance, then square-rooted. It expands when volatility rises and contracts when the market is quiet.
- **Oscillator value.** In Z-Score mode the plotted value is the price-to-VWAP gap divided by that standard deviation, so the reading is expressed in standard deviations. In Distance mode the plotted value is the raw gap in the instrument's own price units. Zero means price is resting on the Moving VWAP; positive means above, negative means below.
**Two Display Modes**
- **Z-Score (σ).** Normalized. The band levels are read directly as standard deviations, and reference lines sit at constant levels. Because the scale is unit-free, the same levels carry the same meaning on any symbol or timeframe.
- **Distance.** Raw. The oscillator shows the actual price gap, and each band is drawn at its level multiplied by the standard deviation, so the bands widen and tighten with volatility while the raw distance stays interpretable.
**Multi-Timeframe Calculation**
A calculation-timeframe selector runs the entire computation on a chosen timeframe rather than only the chart's. The default uses the chart timeframe. Choosing a higher timeframe recomputes the Moving VWAP, the standard deviation, and the oscillator on that timeframe's bars and pulls the result back through a single combined data request. The request runs without look-ahead, so no future higher-timeframe data leaks into historical bars; the current higher-timeframe value continues updating until that bar closes.
**Visual Output**
- The oscillator plots as a histogram, colored by which side of the Moving VWAP price is on.
- The histogram fades across a user-defined transparency range: faint near the VWAP, intensifying to full color as price stretches to a set distance, then holding solid beyond it.
- A solid zero line marks the Moving VWAP.
- Three standard-deviation bands are drawn above and below zero, each with its own toggle, level, and color.
**User Inputs**
*Calculation Timeframe*
- **Calculation Timeframe** — the timeframe the oscillator is computed on. Options are labeled in plain language across seconds, minutes, hours, days, weeks, and a month, plus Chart. Chart uses the current chart timeframe. Higher timeframes give a broader context; lower-than-chart selections are not recommended, and seconds-based options only work on charts that support second-level data.
*Settings*
- **Oscillator Mode** — switches between Z-Score (σ), the normalized standard-deviation reading, and Distance, the raw price gap with volatility-scaled bands.
- **Source** — the price series feeding both the Moving VWAP and the distance measurement. Defaults to the average of high, low, and close; a close-only source reacts faster.
- **Moving VWAP Length** — the number of bars in the rolling window for both the VWAP and its standard deviation. Larger values are smoother and slower; smaller values are more reactive.
- **Fallback to MA on no-volume symbols** — when enabled, symbols that report no volume use a simple moving average and plain standard deviation so the oscillator still functions; when disabled, such symbols show nothing.
*Standard Deviation Bands (three identical rows: Band 1, Band 2, Band 3)*
- **Toggle** — shows or hides that band's upper and lower lines independently.
- **Level (Σ)** — that band's distance from zero, in standard deviations, adjustable in fine steps. Defaults are 1, 2, and 3.
- **Color** — the color applied to both the upper and lower line of that band.
- Band 2's level additionally sets the threshold used by the two stretch alerts.
*Colors*
- **Above VWAP** — histogram color when the oscillator is positive.
- **Below VWAP** — histogram color when the oscillator is negative.
- **Transparency at VWAP** — histogram transparency when price sits on the Moving VWAP; the faint end of the color range.
- **Transparency at Full Color** — histogram transparency once price reaches the full-color distance; the solid end of the range.
- **Full-Color Distance (σ)** — the standard-deviation distance over which the histogram fades from faint to solid; beyond it, the color holds solid.
**Data Window Outputs**
Two values are exposed for inspection or use by other scripts: the Moving VWAP and the standard deviation. The oscillator value itself is also readable from the histogram plot. These do not draw on the chart pane.
**Alerts**
Four alert conditions are available: price crossing above the Moving VWAP, crossing below it, stretching beyond Band 2's upper level, and stretching beyond Band 2's lower level. The stretch alerts follow Band 2's configured level in both modes.
**Behavioral Notes**
- In Z-Score mode the oscillator is unbounded. During a violent move it can spike past four or five standard deviations, which reflects genuine dislocation rather than a display error.
- The Style tab is intentionally empty; all appearance and behavior controls live in the Inputs tab, so nothing there can override the code-driven output.
- The indicator's sole basis is price distance from the Moving VWAP; there is no market-structure logic in the calculation. Indikator

VWAP From Multiple Sources With Cloud & Percentage GapVWAP CLOUD FROM CLOSE, OPEN, HIGH & LOW SOURCES WITH CLOUD & PERCENTAGE GAP
VWAP stands for volume weighted average price and shows the average price of buys/sells based on volume traded across the current session. This VWAP is based off of the Daily session.
***HOW TO USE***
Use the purple cloud between the VWAPs as your entry points as price will typically bounce from that cloud area.
The Yellow Line is the VWAP using the close price as a source.
The Green Line is the VWAP using the open price as a source.
The Blue Line is the VWAP using the high price as a source.
The Purple Line is the VWAP using the low price as a source.
When price is above the VWAP cloud, the background will paint green because the trend is bullish.
When price is below the VWAP cloud, the background will paint red because the trend is bearish.
In the bottom right hand corner, three is a table that will show you the current percentage gap between current price and the VWAP using close as the source.
All sources and colors can be easily switched in the settings menu.
***MARKETS***
This indicator can be used as a signal on all markets, including stocks, crypto, futures and forex.
***TIMEFRAMES***
This vwap indicator can be used on all timeframes but is calculated using the daily session.
***TIPS***
Try using numerous indicators of ours on your chart so you can instantly see the bullish or bearish trend of multiple indicators in real time without having to analyze the data. Some of our favorites are our Auto Fibonacci, Volume Profile, Directional Movement Index, Momentum, Auto Support And Resistance and Money Flow Index in combination with this VWAP Cloud. The other indicators all have real time Bullish and Bearish labels as well so you can immediately understand each indicator's trend.
Indikator

VWAP ReclaimVWAP Reclaim–Retest Created by Claude — User Guide
A mechanical TradingView indicator (Pine Script v6) for trading VWAP reclaims and rejections. It is built for a 5-minute chart but will run on any timeframe. It does not place trades — it identifies setups, marks entry/stop/target levels, and can fire alerts.
---
What it does
The indicator watches price relative to a daily-anchored VWAP and only signals when a specific three-step sequence completes. The point of the sequence is to stop you entering on the raw cross (which gets chopped to pieces) and instead wait for price to prove it can hold the level.
Long sequence
Reclaim — price closes above VWAP (a crossover).
Retest — within a set number of bars, price pulls back to VWAP but closes back above it. This is the "does it hold?" test. The candle that does this becomes the retest candle, and its high is recorded.
Trigger — a later candle breaks above the retest candle's high. That break is the entry.
Short sequence is the mirror image: price closes below VWAP, pops back up to VWAP but closes back below, then a later candle breaks below the retest candle's low.
A setup is abandoned (reset to idle) if price closes back through VWAP before the trigger, or if too many bars pass without a retest or trigger. This is what keeps stale setups from firing late.
---
The regime filter (why this matters most)
Reclaims only pay on directional days. On a chop/range day, price ping-pongs across VWAP and every reclaim fails. The regime filter ties each direction to VWAP's slope:
Longs only fire when VWAP is flat-to-rising.
Shorts only fire when VWAP is flat-to-falling.
Slope is measured by comparing the current VWAP to its value N bars ago (the slope lookback). This single filter removes most of the counter-trend losers. You can turn it off to see every raw setup, but leaving it on is the recommended default.
---
Reading the chart
Element Meaning
VWAP line Daily-anchored VWAP. Green = rising, red = falling, gray = flat. The color is the regime.
Shaded bands Optional ±standard-deviation bands around VWAP. Useful as context: price stretched to the outer band is extended.
LONG / SHORT triangle A confirmed trigger. Appears on the close of the trigger bar.
Entry / Stop / Target lines Drawn at each signal. Entry = the break level. Stop = beyond the retest swing plus an ATR buffer. Target = entry ± (R multiple × risk).
Background tint Faint green or red while a setup is building (reclaimed or armed) but not yet triggered — your early warning.
Status panel (top-right) Live state of each side and the current VWAP direction. States: Idle → Reclaimed → await retest → Retest → ARMED. "ARMED" means a valid retest is in place and the next break will trigger.
---
Settings, group by group
Direction
Trade long reclaims / Trade short reclaims — turn each side on or off independently. Disable one to focus, e.g. longs only on a strong up day.
VWAP
VWAP source — the price the VWAP is built from. Default `hlc3` (the standard). Change to `close` if you prefer a close-based VWAP.
Show ±SD bands — toggle the standard-deviation bands.
Band multiplier — how many standard deviations the bands sit at (1.0 default). Raise for wider context bands.
Regime filter (VWAP slope)
Only trade with VWAP slope — the regime filter described above. On by default. The single biggest filter against chop.
Slope lookback (bars) — how far back to measure slope. Lower = more sensitive (reacts fast, more flips); higher = smoother (only strong trends qualify). 10 is a reasonable 5-minute default.
Reclaim / Retest mechanics
Retest proximity (ticks to VWAP) — how close the pullback must get to VWAP to count as a retest. `0` = price must actually touch VWAP. Increase to allow near-misses where price pulls back toward VWAP but doesn't quite tag it. This is tick-based, so the right value differs by instrument (ES ticks are 0.25; a stock might be 0.01) — calibrate per symbol.
Max bars: reclaim → retest — how long after a reclaim the indicator will wait for a retest before giving up. Too low misses slow pullbacks; too high lets stale setups linger.
Max bars: retest → trigger — same idea for the window between a valid retest and the breakout trigger.
Stop / Target
ATR length — lookback for the ATR used to pad the stop.
ATR buffer beyond level — how far past the retest swing the stop sits, in ATR multiples. 0.5 = half an ATR of breathing room. Raise it if you're getting wicked out, lower it for tighter risk.
Target (R multiple) — where the target line is drawn, as a multiple of risk. 1.5 means the target is 1.5× the distance from entry to stop. This sets the displayed reward, not a hard rule — you can still manage the trade manually.
Session filter
Restrict signals to a session — off by default. Turn on to ignore signals outside a chosen window.
Session — the time window, e.g. `0945-1130` to skip the open spike and lunch chop, or `0930-1600` for the full regular session.
Timezone — the timezone the session string is read in. Default `America/New_York`.
Visuals
VWAP rising / falling / flat colors — the three slope colors.
Entry / Stop / Target colors — the three level-line colors.
Level line length (bars) — how far to the right the entry/stop/target lines extend.
Level line width — thickness of those lines.
Label size — tiny / small / normal / large for the price labels.
Show status panel — toggle the top-right state table.
Tint background while a setup is forming — toggle the faint background shading during the reclaim/armed phase.
Alerts
Three `alertcondition`s are exposed when you create an alert in TradingView: Long, Short, and Any. Pick one, set it to "Once per bar close" so it matches how signals confirm.
---
A suggested workflow
Put it on a 5-minute chart of a symbol that has volume (VWAP needs volume to compute).
Leave the regime filter on. Watch the VWAP color — that tells you which direction the indicator will even consider.
When the background tints and the status panel shows ARMED, a break is imminent; that's your prep signal.
On the triangle, the entry/stop/target lines show you the trade's geometry. Check that the target isn't sitting right on top of an obvious level (prior day high/low, round number) that would cap the move.
Forward-test on paper for 30–50 signals before sizing up. Tune one setting at a time — retest proximity and slope lookback have the biggest effect on how many signals you get and how clean they are.
---
Honest caveats
Signals confirm on the close of the trigger bar. This is the non-repainting behavior, but it means the marker appears slightly after the intrabar break where a live stop order would actually fill. The entry line shows the real break level.
The retest proximity is tick-based and must be calibrated per instrument.
It's an analysis tool, not advice. A clean ruleset still has losing streaks; the value of mechanizing is consistent, small losses so a real edge can show over a sample — not the elimination of losers. Backtest and forward-test before risking size. Indikator

VWAP Balance Zones - SessionsVWAP Balance Zones Sessions Version is an alternate take on the Original VWAP Balance Zones indicator. The Sessions version allows users to select a specific session to view the VWAP Balance Zones at while still utilizing the full ETH Data.
The Session version provides a better focused display while still maintaining the core functions of the original script with mindful optimizations.
Author's Note: "VBZ Sessions was made with logistics in mind, for the users who only trade within certain times of the day. While it displays the same core concepts, it is not as "Raw" of a display as the Original. For this reason, some users may prefer the Original VWAP Balance Zones, which is why I have opted to release this alternate version instead of updating the original."
> What are VWAP Balance Zones?
"VWAP Balance Zones" is an original concept aimed at identifying the equilibrium area between market participants within the current trend by averaging the Daily Extremes and the Daily VWAP.
Refer to the illustration below for a better understanding of exactly how VWAP Balance Zones are formed:
These zones are displayed for the Daily, Weekly, and Monthly VWAPs, with the most interactive timeframe being the Daily.
> Features
1. The Session Version uses ETH data at all times, and does not solely rely on the chart's data to create the VWAPs or Zones.
This allows the user to focus on a specific trading session, while not losing out on the full VBZ Calculation, with the notable benefit of a cleaner display.
The Original VBZ starts drawing at the beginning of the chart's "Day", and would produce different results when using an RTH chart vs an ETH chart. Along with creating a bird's nest of unusable data at the beginning of the day.
2. Session Start and End lines are displayed for easier identification of the designated trading session.
3. The extreme "Close" Lines are no longer displayed to reduce noise and redundancy.
4. Additionally, the interior VWAP lines are no longer displayed. Ultimately, this was to reduce noise and focus the script on the 50% zones.
5. Weekly and Monthly Zones are now displayed due to the reduced noise!
6. As with the original, the weekly display will yield to the daily, and the monthly display will yield to the weekly.
In the screenshot below, you can observe this behavior.
Enjoy! Indikator

VWAP Anker: Time, ATH/ATL, Swings, Pivots & Dynamic AlertsVWAP Ultimate: Time, ATH/ATL & Bear-Market Swings
VWAP Ultimate combines multiple important VWAP anchors into a single indicator, helping traders identify institutional price levels, long-term market structure, and key support and resistance zones.
Instead of relying on a single traditional VWAP, this indicator provides several anchoring methods that offer different perspectives on market behavior.
Included VWAP Types
📅 Time-Based VWAPs
Daily VWAP
Weekly VWAP
Monthly VWAP
These VWAPs automatically reset at the beginning of each new period and are especially useful for:
Intraday trading
Swing trading
Trend identification
Dynamic support and resistance levels
🚀 All-Time High VWAP (ATH VWAP)
This VWAP is anchored from the asset's historical all-time high.
Use cases:
Evaluating market strength after major bullish moves
Identifying long-term resistance and support zones
Estimating institutional cost basis above historical highs
📉 All-Time Low VWAP (ATL VWAP)
This VWAP is anchored from the asset's historical all-time low.
Use cases:
Analyzing long-term accumulation phases
Identifying major support areas
Evaluating long-term market cycles
🐻 Bear Market Swing VWAPs
The indicator detects significant swing highs and swing lows using a 20/20 pivot structure.
Calculated levels:
VWAP anchored to the most recent significant swing high
VWAP anchored to the most recent significant swing low
These levels are particularly useful during:
Bear markets
Market corrections
Trend reversals
Identification of institutional entry and exit zones
Customization
Each VWAP category can be enabled or disabled independently:
✅ Time-Based VWAPs (D/W/M)
✅ ATH / ATL VWAPs
✅ Bear Market Swing VWAPs
This allows traders to tailor the chart to their specific trading style and analysis needs.
Markets & Use Cases
This indicator can be applied to:
Stocks
Cryptocurrencies
Indices
Futures
Forex
It is especially valuable for traders and investors who analyze multiple time horizons and want to combine key market anchors into a single tool.
Core Concept
VWAP levels are widely used by institutional market participants as a benchmark for fair value. By combining time-based, historical, and structural anchor points, this indicator provides a broader view of market structure than a standard VWAP alone.
A comprehensive tool for analyzing trend direction, market structure, and long-term support and resistance levels within a single indicator. Indikator

VWAP Deviation Score [DYNA]VWAP Deviation Score expresses how stretched price is from the session's VWAP as a single z-score number — the count of intraday standard deviations between the current close and the volume-weighted mean. Zero means price is sitting on VWAP. ±1 is one standard deviation away (~68% statistical envelope). ±2 is the alertable extreme (~95% envelope). Beyond ±2 is a statistically uncommon reading under a normal distribution.
The indicator lives in its own pane below price. The smoothed z-score line is colored by zone — green inside ±1σ, amber between ±1σ and ±2σ, red beyond ±2σ — so the current state is readable at a glance. Three confirmed-bar alerts cover the actionable transitions: extreme bullish stretch, extreme bearish stretch, and the return back to VWAP after an extreme reading.
Unlike rolling-window z-score indicators, this one anchors VWAP and the standard deviation to the session open. The dispersion measurement therefore reflects only today's price action, not yesterday's noise — every session starts fresh.
Key Features
Session-Anchored Z-Score -- True intraday measurement of stretch from VWAP. Resets every session, no carryover from yesterday.
Three-Zone Coloring -- Normal (green), caution (amber), extreme (red). The line color tells you the regime before you read the number.
Configurable Thresholds -- Independent caution and extreme threshold inputs (defaults ±1σ and ±2σ). Adjust per instrument volatility.
EMA Smoothing -- Optional smoothing of the raw z-score (default length 3) to suppress threshold-flicker on noisy timeframes.
Three Alerts -- Extreme bullish deviation, extreme bearish deviation, return to VWAP after an extreme. All confirmed on bar close.
Early-Session Guard -- Configurable minimum-bars filter (default 5) prevents noise alerts when intraday standard deviation has not yet stabilised.
Compact Dashboard -- Top-right table shows current z-score, zone label, and bar count since session open.
Volume-Agnostic -- Works on instruments with or without published volume. Cash indices with no published volume fall back to a flat weight automatically.
No Repainting -- Signal conditions gated on confirmed bars; once an alert has fired, the historical signal does not move.
How It Works
At the start of each session the indicator begins accumulating volume-weighted sums of the source price and the source price squared. From these it derives the session VWAP (Σ src·vol / Σ vol) and the volume-weighted variance (Σ src²·vol / Σ vol − VWAP²). The standard deviation is the square root of the variance.
The raw z-score is then (close − VWAP) / σ — the number of standard deviations between the current close and the session mean. A short EMA is applied to the raw value to produce the smoothed signal line shown on the chart.
The score is classified into three zones: normal (|z| < caution), caution (caution ≤ |z| < extreme), and extreme (|z| ≥ extreme). The line colour, the pane background, and the dashboard all reflect the current zone.
Signals fire only on confirmed (closed) bars. "Extreme bullish deviation" fires the bar the smoothed z-score crosses above the extreme threshold; "extreme bearish deviation" mirrors it on the negative side. "Return to VWAP" fires when the score crosses zero after having been beyond the extreme threshold earlier in the same session — paired with the extreme alerts, it marks the completion of a mean-reversion round trip.
Smoothed z-score (zone-coloured line) plotted in a separate pane with the VWAP at zero, ±1σ caution dotted lines, and ±2σ extreme dashed lines. Triangle markers fire on extreme deviations; the diamond marks the return back to VWAP.
Settings
Session Time (default: 0915-1530) and Timezone (default: Asia/Kolkata) define the session window that anchors the VWAP. VWAP Source (default: hlc3) sets the price used in the weighted average; hlc3 matches TradingView's built-in VWAP.
Extreme Threshold (default: 2.0σ) is the alertable line. Caution Threshold (default: 1.0σ) opens the amber zone but does not fire alerts -- it is purely a visual aid for the colour band. Signal Smoothing (default: 3) is the EMA length applied to the raw z-score. Min Bars Before Signals (default: 5) suppresses signals while the early-session standard deviation is still stabilising.
The Visual toggles control the optional raw z-score line, the zone fills, the extreme background tint, and the dashboard table. The three Alert toggles enable or disable each alert independently.
Alerts
Extreme Bullish Deviation -- Fires on the bar the smoothed z-score crosses above the extreme threshold. Price is in the top tail of the intraday distribution. "VWAP Deviation Score : Z-score crossed above the extreme upper threshold -- price stretched well above session VWAP."
Extreme Bearish Deviation -- Fires on the bar the smoothed z-score crosses below the negative extreme threshold. Mirror of the bullish case. "VWAP Deviation Score : Z-score crossed below the extreme lower threshold -- price stretched well below session VWAP."
Return to VWAP -- Fires when the smoothed z-score crosses zero after having been beyond the extreme threshold earlier in the same session. Marks the completion of a mean-reversion round trip. "VWAP Deviation Score : Z-score returned to zero after an extreme deviation -- mean-reversion to session VWAP confirmed."
To set up alerts: click TradingView's Alerts button, choose "VWAP Deviation Score " from the condition dropdown, pick one of the three alert variants, and select your notification channel.
Best Practices
Read the line colour first, the number second. The zone tells you the regime; the exact value is for fine-tuning entries.
Extreme readings mark the tails of the intraday distribution -- a zone many traders watch for potential mean-reversion. The "Return to VWAP" alert can mark when price has traded back to the session mean.
Tune the extreme threshold per instrument. 2σ is a good default; raise to 2.5-3σ on highly volatile small-caps or crypto, lower to 1.5σ on slow-moving instruments.
Combine with a higher-timeframe trend filter to choose which side of an extreme reading to take. With-trend extreme readings often mark continuation pullbacks; counter-trend extremes mark exhaustion.
Give the indicator at least 5-7 bars after session open before reading it. The minimum-bars guard suppresses alerts but the visible value can still be unstable while standard deviation is stabilising.
On cash-index charts with no published volume, treat this as a session-anchored standardised price oscillator rather than a true volume-weighted z-score. The signal logic is unchanged; only the per-bar weighting falls back to flat.
Part of the DYNA Ecosystem
VWAP Deviation Score is a free indicator built with the same design standards as the DYNA premium suite. For complete trade management with automatic stop loss, break-even, trailing stops, and multi-target systems, explore the full DYNA indicator collection.
Disclaimer
This indicator is a technical analysis and educational tool only -- it is not financial advice and makes no guarantee of any outcome. Past performance does not predict future results. Always do your own research and use proper position sizing and risk management.
Created by Varun Nidhi · varunnidhi.com
A free DYNA indicator — self-contained, no repainting.
Indikator

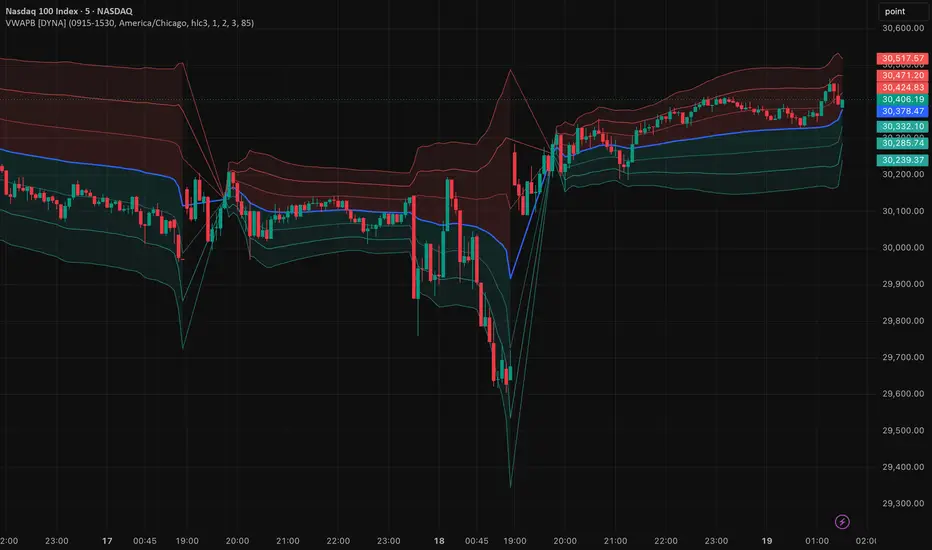
VWAP Bands [DYNA]VWAP Bands plots a session-anchored Volume Weighted Average Price together with three pairs of standard-deviation bands at ±1σ, ±2σ, and ±3σ. VWAP is the session's dynamic fair value, and the bands are its statistical envelope: inside ±1σ is normal, beyond ±2σ is stretched, beyond ±3σ is extreme. The result is a single overlay that tells you where price sits relative to the day's mean and how volatile that session actually is.
Most VWAP indicators give you only the line. Most band indicators (Bollinger, Keltner) use a rolling window that carries yesterday's noise into today. VWAP Bands combines the two: volume-weighted anchoring plus intraday-only σ bands that widen and contract with the current session's realised volatility. At session open the bands reset to zero and fan out as the session develops.
Key Features
Session-Anchored VWAP -- Uses the TradingView session picker plus a timezone dropdown so the same indicator works on any regional market without code edits.
Three Band Pairs -- ±1σ, ±2σ, ±3σ with independently configurable multipliers. Each pair has its own visibility toggle.
Adaptive Volatility Envelope -- Bands widen automatically when intraday volatility rises and compress on quiet sessions. No manual lookback window required.
Gradient Band Shading -- Optional zone fills between adjacent bands, lighter toward the outer bands, so you can read where price is inside the envelope at a glance.
Volume-Agnostic -- On instruments with no traded volume (some cash indices) the indicator falls back to a flat weight, so VWAP and bands still render meaningfully.
Four Alerts -- Bullish VWAP cross, bearish VWAP cross, +2σ touch, -2σ touch. All confirmed on bar close.
No Repainting -- Signal conditions are gated on confirmed bars; once an alert has fired, the historical signal does not move.
How It Works
At the start of each session -- determined by your session window and timezone -- the indicator begins accumulating the typical price weighted by volume: Σ(src × vol) divided by Σ(vol) gives the VWAP. In parallel it tracks Σ(src² × vol) to compute the volume-weighted variance, then the square root is the standard deviation. Bands are plotted at VWAP ± (multiplier × σ) for each of the three multipliers.
Because the sums are cumulative from session open, every bar updates VWAP and the bands. At the start of the session the bands collapse onto the VWAP line; as the session progresses they fan out and reflect the volatility the market is actually producing that day.
When the session ends and a new one begins, all accumulators reset. The lines are drawn only inside the configured session window -- no stale levels during off-hours.
VWAP (blue) with ±1σ, ±2σ, ±3σ bands (green below, red above) anchored to the session open. Bands fan out from VWAP as the session's realised volatility accumulates.
Settings
Session Time (default: 0915-1530) and Timezone (default: Asia/Kolkata) define the session window. VWAP Source (default: hlc3) sets the price used in the weighted average; hlc3 matches TradingView's built-in VWAP.
Band 1 / 2 / 3 Multiplier (defaults 1.0, 2.0, 3.0) set each band pair's offset in standard deviations. The defaults match the statistical convention -- ±1σ covers roughly 68% of in-session variation, ±2σ ~95%, ±3σ ~99.7% under a normal distribution. Adjust upward if the default envelopes feel too tight for your instrument.
Show VWAP Line and the three Show ±Nσ Bands toggles let you hide any line you do not want on the chart. Shade Between Bands enables gradient fills between adjacent bands; Fill Transparency (default: 85) controls how subtle those fills are.
The two alert toggles enable or disable the VWAP-cross and ±2σ-touch alerts independently.
Alerts
Price Crosses Above VWAP -- Fires when close crosses above the VWAP line, signalling a session bias flip to bullish. "VWAP Bands : Price crossed above VWAP -- session bias flipping bullish."
Price Crosses Below VWAP -- Fires when close crosses below the VWAP line. "VWAP Bands : Price crossed below VWAP -- session bias flipping bearish."
Price Touches +2σ Band -- Fires when the bar high reaches the +2σ upper band, marking a stretched upside condition. "VWAP Bands : Price touched the +2σ upper band -- stretched above VWAP."
Price Touches -2σ Band -- Fires when the bar low reaches the -2σ lower band, marking a stretched downside condition. "VWAP Bands : Price touched the -2σ lower band -- stretched below VWAP."
To set up alerts: click TradingView's Alerts button, choose "VWAP Bands " from the condition dropdown, pick one of the four alert variants, and select your notification channel.
Best Practices
Give the bands 3-5 bars to stabilise at session open. Early-session standard deviation is tiny so the bands collapse onto VWAP; wait for the fan-out before reading them.
Use ±2σ and ±3σ as mean-reversion zones. Touches of the outer bands under normal volatility often see a snap back toward VWAP, especially on higher timeframes.
Use VWAP itself and ±1σ as pullback entry zones when price is trending cleanly on one side of VWAP.
On volatile news sessions, bands expand rapidly -- a ±2σ touch there is much less extreme than a ±2σ touch on a quiet session. Let the band width itself inform how much weight to give each touch.
On cash-index charts with no volume, treat the indicator as a session-anchored σ-band system rather than a true VWAP. The bands still reflect intraday dispersion meaningfully; the weighting just falls back to flat.
Match Session Time to regular trading hours only -- including extended hours drags the VWAP and widens the bands unnecessarily.
Part of the DYNA Ecosystem
VWAP Bands is a free indicator built with the same design standards as the DYNA premium suite. For complete trade management with automatic stop loss, break-even, trailing stops, and multi-target systems, explore the full DYNA indicator collection.
Disclaimer
This indicator is a technical analysis and educational tool only -- it is not financial advice and makes no guarantee of any outcome. Past performance does not predict future results. Always do your own research and use proper position sizing and risk management.
Created by Varun Nidhi · varunnidhi.com
A free DYNA indicator — self-contained, no repainting.
Indikator

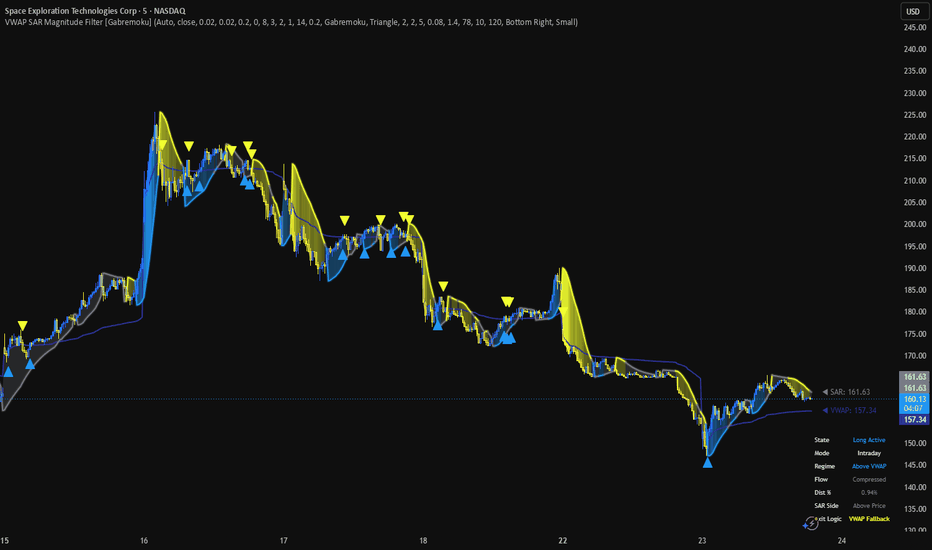
VWAP SAR Magnitude Filter [Gabremoku]VWAP SAR Magnitude Filter
Short description
A state-based long-only trend filter that combines VWAP context with Parabolic SAR structure. It uses VWAP as the main trend and invalidation line, while SAR confirms directional pressure and helps visualize momentum expansion or compression.
Descrizione completa
VWAP SAR Magnitude Filter is a long-only overlay designed to turn two familiar tools, VWAP and Parabolic SAR, into a cleaner operational framework rather than a simple indicator mashup.
The script uses VWAP as the primary market context and invalidation line. When price is above VWAP, the market is treated as having bullish intraday or swing context. When price falls back below VWAP, that context weakens and the script can trigger an exit.
Parabolic SAR is not used here as the primary exit engine. Instead, it acts as a structural confirmation tool. A valid long setup requires price to be above VWAP while SAR remains below the candle, which helps align directional bias and price structure. This reduces the number of signals that would appear if VWAP or SAR were used independently.
The script also includes an Auto mode engine. In Auto mode, lower intraday timeframes are handled with faster behavior, while higher timeframes are treated as swing conditions with additional filters. This makes the indicator adapt its sensitivity without requiring constant manual switching.
In Swing mode, the script becomes more selective by requiring:
persistence of the long condition for a minimum number of bars,
a minimum distance between price and SAR,
confirmed exit behavior below VWAP,
a longer cooldown after exits.
This approach is intended to reduce noise and avoid frequent re-entries during unstable or sideways phases. The indicator is therefore more focused on readable continuation structure than on generating many raw signals.
How it works
Long context: Price above VWAP.
Long confirmation: Parabolic SAR below the candle.
Long entry: The bullish context and structural confirmation align.
Exit logic: Main exit occurs on VWAP fallback; in Swing mode the fallback can require confirmation across multiple bars.
Mode engine: Auto selects Intraday or Swing behavior depending on the chart timeframe.
Visual features
VWAP line as the main reference level.
SAR line and glow for directional structure.
Magnitude fill between price and SAR to visualize pressure expansion and compression.
Optional bar coloring.
Dashboard with State, Mode, Regime, Flow, Distance %, SAR Side, and Exit Logic.
How to use it
This indicator works best when price is developing directional structure away from VWAP. In strong trends, it can help frame cleaner long continuation behavior. In choppy or sideways markets around VWAP, noise is naturally higher because the market lacks clear directional context.
A practical way to use it is:
monitor whether price is holding above VWAP,
wait until SAR is also positioned below price,
use the dashboard to confirm the current regime and state,
treat VWAP fallback as the main warning that the active long structure may be weakening.
Limitations
This indicator is not meant to eliminate all noise, especially in lateral environments where price oscillates around VWAP. In those conditions, repeated context shifts are part of market behavior, so no VWAP-based trend tool can remove all false transitions. The script is designed to reduce that noise, not to make it disappear completely.
It is also a context and structure tool, not a complete trading system. Users should still evaluate market conditions, liquidity, session behavior, and personal risk management before making decisions. Indikator
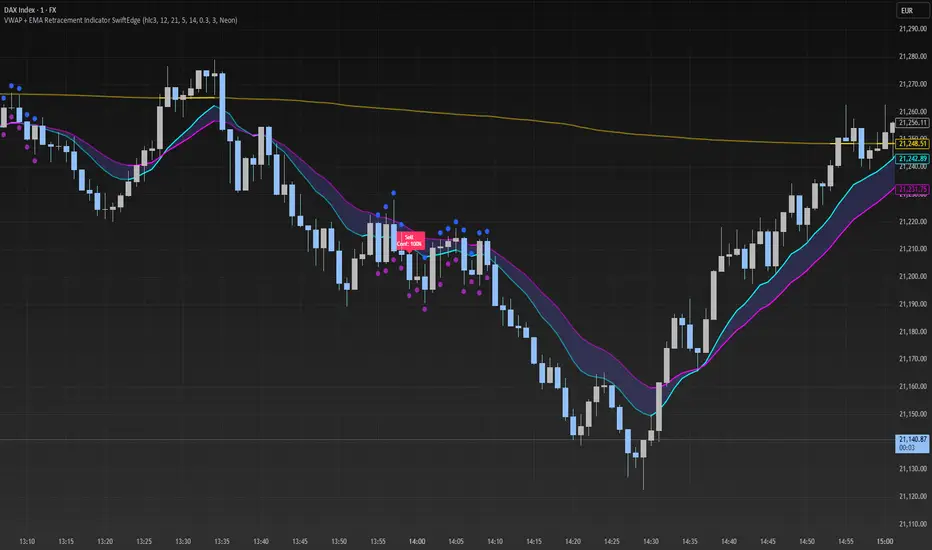
VWAP + EMA Retracement Indicator SwiftEdgeVWAP + EMA Retracement Indicator
Overview
The VWAP + EMA Retracement Indicator is a powerful and visually engaging tool designed to help traders identify high-probability buy and sell opportunities in trending markets. By combining the Volume Weighted Average Price (VWAP) with two Exponential Moving Averages (EMAs) and a unique retracement-based signal logic, this indicator pinpoints moments when the price pulls back to a key zone before resuming its trend. Its modern, AI-inspired visuals and customizable features make it both intuitive and adaptable for traders of all levels.
What It Does
This indicator generates buy and sell signals based on a sophisticated yet straightforward strategy:
Buy Signals: Triggered when the price is above VWAP, has recently retraced to the zone between two EMAs (default 12 and 21 periods), and a strong bullish candle closes above both EMAs.
Sell Signals: Triggered when the price is below VWAP, has retraced to the EMA zone, and a strong bearish candle closes below both EMAs.
Signal Filtering: A customizable cooldown period ensures that only the first signal in a sequence is shown, reducing noise while preserving opportunities for new trends.
Confidence Scores: Each signal includes an AI-inspired confidence score (0-100%), calculated from candle strength and price distance to VWAP, helping traders gauge signal reliability.
The indicator’s visuals enhance decision-making with dynamic gradient lines, a highlighted retracement zone, and clear signal labels, all customizable to suit your preferences.
How It Works
The indicator integrates several components that work together to create a cohesive trading tool:
VWAP: Acts as a dynamic support/resistance level, reflecting the average price weighted by volume. It filters signals to ensure buys occur in uptrends (price above VWAP) and sells in downtrends (price below VWAP).
Dual EMAs: Two EMAs (default 12 and 21 periods) define a retracement zone where the price is likely to consolidate before continuing its trend. Signals are generated only after the price exits this zone with conviction.
Retracement Logic: The indicator looks for price pullbacks to the EMA zone within a user-defined lookback window (default 5 candles), ensuring signals align with trend continuation patterns.
Candle Strength: Signals require strong candles (bullish for buys, bearish for sells) with a minimum body size based on the Average True Range (ATR), filtering out weak or indecisive moves.
Cooldown Mechanism: A unique feature that prevents signal clutter by allowing only the first signal within a user-defined period (default 3 candles), balancing responsiveness with clarity.
Confidence Score: Combines candle body size and price distance to VWAP to assign a score, giving traders an at-a-glance measure of signal strength without needing external analysis.
These components are carefully combined to capture high-probability setups while minimizing false signals, making the indicator suitable for both short-term and swing trading.
How to Use It
Add to Chart: Apply the indicator to a 15-minute chart (recommended) or your preferred timeframe.
Customize Settings:
VWAP Source: Choose the price source (default: hlc3).
EMA Periods: Adjust the fast and slow EMA periods (default: 12 and 21).
Retracement Window: Set how many candles to look back for retracement (default: 5).
ATR Period & Body Size: Define candle strength requirements (default: 14 ATR period, 0.3 multiplier).
Cooldown Period: Control the minimum candles between signals (default: 3; set to 0 to disable).
Candle Requirements: Toggle whether signals require bullish/bearish candles or entire candle above/below EMAs.
Visuals: Enable/disable gradient colors, retracement zone, confidence scores, and choose a color scheme (Neon, Light, or Dark).
Interpret Signals:
Buy: A green "Buy" label with a confidence score appears below the candle when conditions are met.
Sell: A red "Sell" label with a confidence score appears above the candle.
Use the confidence score to prioritize higher-probability signals (e.g., above 80%).
Trade Management: Combine signals with your risk management strategy, such as setting stop-loss below the retracement zone and targeting a 1:2 risk-reward ratio.
Why It’s Unique
The VWAP + EMA Retracement Indicator stands out due to its thoughtful integration of classic indicators with modern enhancements:
Balanced Signal Filtering: The cooldown mechanism ensures clarity without missing key opportunities, unlike many indicators that overwhelm with frequent signals.
AI-Inspired Confidence: The confidence score simplifies decision-making by quantifying signal strength, mimicking advanced analytical tools in an accessible way.
Elegant Visuals: Dynamic gradients, a highlighted retracement zone, and customizable color schemes (Neon, Light, Dark) create a sleek, futuristic interface that’s both functional and visually appealing.
Flexibility: Extensive customization options let traders tailor the indicator to their style, from conservative swing trading to aggressive scalping. Indikator

Indikator

Indikator

Indikator

VWAP Rejection + CISD AlertVWAP Rejection + CISD Alert — Full Backtest Table + Entry Time Window
This powerful intraday ICT-style indicator automatically detects high-probability VWAP Rejection + CISD setups and gives you everything you need to trade them with precise risk management.
Strategy Rules (all must align):
VWAP Rejection: Candle body fully above VWAP (bullish) or below VWAP (bearish) with a wick touching VWAP.
CISD Confirmation: Strong reversal candle after minimum consecutive opposite candles (default 2), breaking the prior high/low, and occurring within max bars after rejection (default 2).
Extra Filters:
CISD candle must open above VWAP (longs) or below VWAP (shorts).
CISD candle must close above/below your chosen Moving Average (SMA/EMA/WMA/VWMA – fully adjustable).
Entry: At the open of the very next candle after CISD confirmation.
Stop Loss: Choose between:
Open of the CISD candle (original)
Extreme wick of the VWAP rejection candle (low for longs / high for shorts)
Take Profit: User-defined multiplier (default 2R) from entry.
Visuals & Tools:
Small REJ↑ / REJ↓ labels on rejection candles
Large lime/fuchsia CISD↑ / CISD↓ triangles on confirmation
Detailed ENTRY LONG/SHORT labels showing exact Open, SL, and TP prices
Horizontal lines (Entry dashed blue, SL red, TP green) starting at the CISD candle and automatically stopping when price hits SL or TP
Yellow TP and Blue SL hit triangles marking exact exit candles
Live Performance Table (top-right) showing:
Total Trades
Wins / Losses
Win Rate %
Current TP Multiplier
Key Inputs:
CISD Settings: Min consecutive candles, Max bars after rejection
Risk Management: TP Multiplier, SL Placement (2 options)
Moving Average Filter: Length + Type (SMA/EMA/WMA/VWMA)
Time Filter: Entry Time Window (default 8:00–11:00 AM EST)
Visual toggles for labels, lines, and CISD shapes
Alerts:
Set alerts on “CISD Confirmed → LONG Setup” or “SHORT Setup”.
Alerts fire the moment the CISD candle closes — perfect timing to enter at the next open.
Ideal for 1m–15m charts on indices, forex, and futures. Combines classic VWAP rejection with ICT CISD concepts plus strict filters for cleaner, higher-probability trades. Indikator

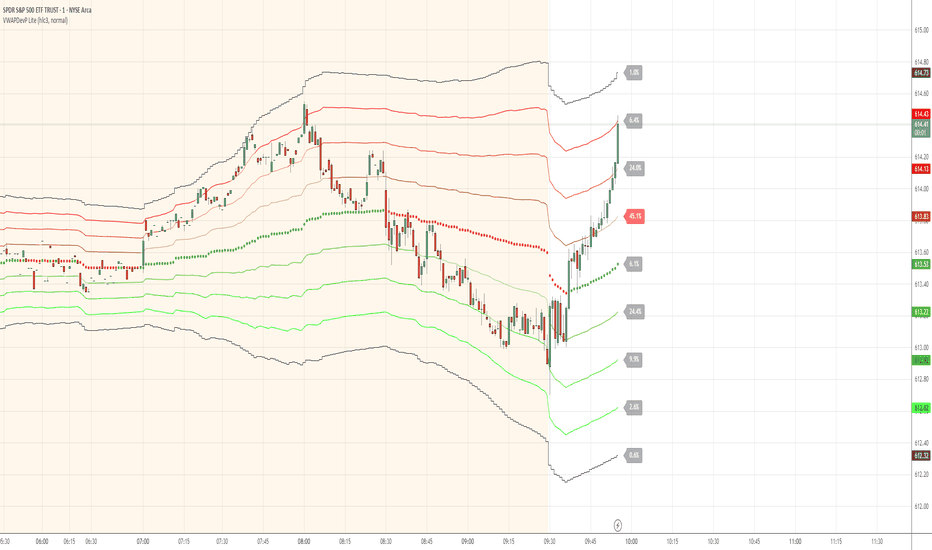
VWAP Deviation Channels with Probability (Lite)VWAP Deviation Channels with Probability (Lite)
Version 1.2
Overview
This indicator is a powerful tool for intraday traders, designed to identify high-probability areas of support and resistance. It plots the Volume-Weighted Average Price (VWAP) as a central "value" line and then draws statistically-based deviation channels around it.
Its unique feature is a dynamic probability engine that analyzes thousands of historical price bars to calculate and display the real-time likelihood of the price touching each of these deviation levels. This provides a quantifiable edge for making trading decisions.
Core Concepts Explained
This indicator is built on three key concepts:
The VWAP (Volume-Weighted Average Price): The dotted midline of the channels is the session VWAP. Unlike a Simple Moving Average (SMA) which only considers price, the VWAP incorporates volume into its calculation. This makes it a much more significant benchmark, as it represents the true average price where the most business has been transacted during the day. It's heavily used by institutional traders, which is why price often reacts strongly to it.
Standard Deviation Channels: The channels above and below the VWAP are based on standard deviations. Standard deviation is a statistical measure of volatility.
- Wide Bands: When the channels are wide, it signifies high volatility.
- Narrow Bands: When the channels are tight and narrow, it signifies low volatility and
consolidation (a "squeeze").
The Conditional Probability Engine: This is the heart of the indicator. For every deviation level, the script displays a percentage. This percentage answers a very specific question:
"Based on thousands of previous bars, when the last candle had a certain momentum (bullish or bearish), what was the historical probability that the price would touch this specific level?"
The probabilities are calculated separately depending on whether the previous candle was green (bullish) or red (bearish). This provides a nuanced, momentum-based edge. The level with the highest probability is highlighted, acting as a "price magnet."
How to Use This Indicator
Recommended Timeframes:
This indicator is designed specifically for intraday trading. It works best on timeframes like the 1-minute, 5-minute, and 15-minute charts. It will not display correctly on daily or higher timeframes.
Recommended Trading Strategy: Mean Reversion
The primary strategy for this indicator is "Mean Reversion." The core idea is that as the price stretches to extreme levels far away from the VWAP (the "mean"), it is statistically more likely to "snap back" toward it.
Here is a step-by-step guide to trading this setup:
1. Identify the Extreme: Wait for the price to push into one of the outer deviation bands (e.g., the -2, -3, or -4 bands for a buy setup, or the +2, +3, or +4 bands for a sell setup).
2. Look for the High-Probability Zone: Pay close attention to the highlighted probability label. This is the level that has historically acted as the strongest magnet for price. A touch of this level represents a high-probability area for a potential reversal.
3. Wait for Confirmation: Do not enter a trade just because the price has touched a band. Wait for a confirmation candle that shows momentum is shifting.
- For a Buy: Look for a strong bullish candle (e.g., a green engulfing candle or a hammer/pin
bar) to form at the lower bands.
- For a Sell: Look for a strong bearish candle (e.g., a red engulfing candle or a shooting star)
to form at the upper bands.
Define Your Exit:
- Take Profit: A logical primary target for a mean reversion trade is the VWAP (midLine).
- Stop Loss: A logical place for a stop-loss is just outside the next deviation band. For
example, if you enter a long trade at the -3 band, your stop loss could be placed just
below the -4 band.
Disclaimer: This indicator is a tool for analysis and should not be considered a standalone trading system. Trading involves significant risk, and past performance is not indicative of future results. Always use this indicator in conjunction with other forms of analysis and sound risk management practices.
Indikator
VWAP Pro [Capitalize Labs]VWAP Pro is a volume weighted average price indicator designed to provide structured price context across Session, Weekly, and Monthly anchors. It allows users to define custom session templates and apply multiple band calculation methods to help frame price behavior relative to volume weighted levels.
The indicator supports Session, Week, and Month anchor periods. Session anchoring can be aligned to user defined templates including RTH, ETH, London, New York, Asia, or a fully custom session, all based on the instrument’s exchange time zone. This allows VWAP to reset at meaningful market boundaries rather than fixed calendar times.
VWAP Pro includes three band calculation methods: volume weighted standard deviation, fixed tick distance based on the instrument’s minimum tick size, and ATR based distance. Up to three band levels can be enabled independently, with configurable multipliers and visual settings.
A warm up system is included to manage band behavior immediately after a VWAP reset. Bands can either be hidden during the warm up period and appear at full width once complete, or gradually expand from zero to full width over the defined number of bars. The VWAP line itself always plots immediately.
Optional prior period reference levels are available for the previous Session, Week, and Month VWAP. These levels represent only fully completed periods and do not update during the current active period. Display of these levels depends on sufficient historical data being loaded to cover the full prior period.
The indicator requires valid volume data. Symbols that do not provide volume are not supported. All session definitions and settings should be reviewed and adjusted to match the specific instrument being analyzed.
Risk Warning
This indicator is provided for educational and analytical purposes only and does not constitute financial advice, an investment recommendation, or a solicitation to buy or sell any financial instrument. Trading involves significant risk and market conditions can change rapidly. Losses can exceed expectations and the use of this indicator does not guarantee any specific outcome or performance. You are solely responsible for your trading decisions, risk management, and compliance with applicable regulations. Past market behavior or indicator signals are not reliable indicators of future results. Indikator

VWAP %BVWAP %B - Volume Weighted Average Price Percent B
The VWAP %B indicator combines the reliability of VWAP (Volume Weighted Average Price) with the analytical power of %B oscillators, similar to Bollinger Bands %B but using volume-weighted statistics.
## How It Works
This indicator calculates where the current price sits relative to VWAP-based standard deviation bands, expressed as a percentage from 0 to 1:
• **VWAP Calculation**: Uses volume-weighted average price as the center line
• **Standard Deviation Bands**: Creates upper and lower bands using standard deviation around VWAP
• **%B Formula**: %B = (Price - Lower Band) / (Upper Band - Lower Band)
## Key Levels & Interpretation
• **Above 1.0**: Price is trading above the upper VWAP band (strong bullish momentum)
• **0.8 - 1.0**: Overbought territory, potential resistance
• **0.5**: Price exactly at VWAP (equilibrium)
• **0.2 - 0.0**: Oversold territory, potential support
• **Below 0.0**: Price is trading below the lower VWAP band (strong bearish momentum)
## Trading Applications
**Trend Following**: During strong trends, breaks above 1.0 or below 0.0 often signal continuation rather than reversal.
**Mean Reversion**: In ranging markets, extreme readings (>0.8 or <0.2) may indicate potential reversal points.
**Volume Context**: Unlike traditional %B, this incorporates volume weighting, making it more reliable during high-volume periods.
## Parameters
• **Length (20)**: Period for standard deviation calculation
• **Standard Deviation Multiplier (2.0)**: Controls band width
• **Source (close)**: Price input for calculations
## Visual Features
• Reference lines at key levels (0, 0.2, 0.5, 0.8, 1.0)
• Background highlighting for extreme breaks
• Real-time values table
• Clean oscillator format below price chart
Perfect for intraday traders and swing traders who want to combine volume analysis with momentum oscillators.
Indikator

Indikator

Indikator