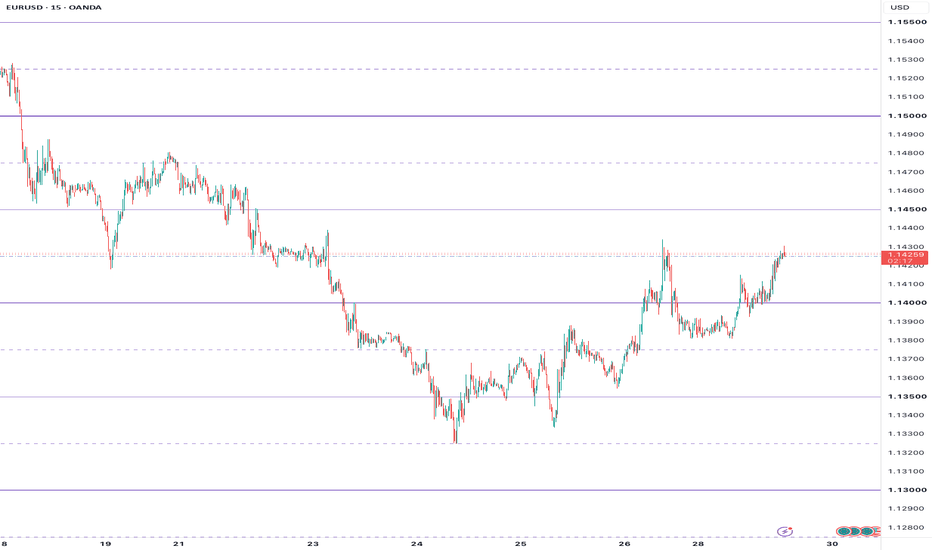
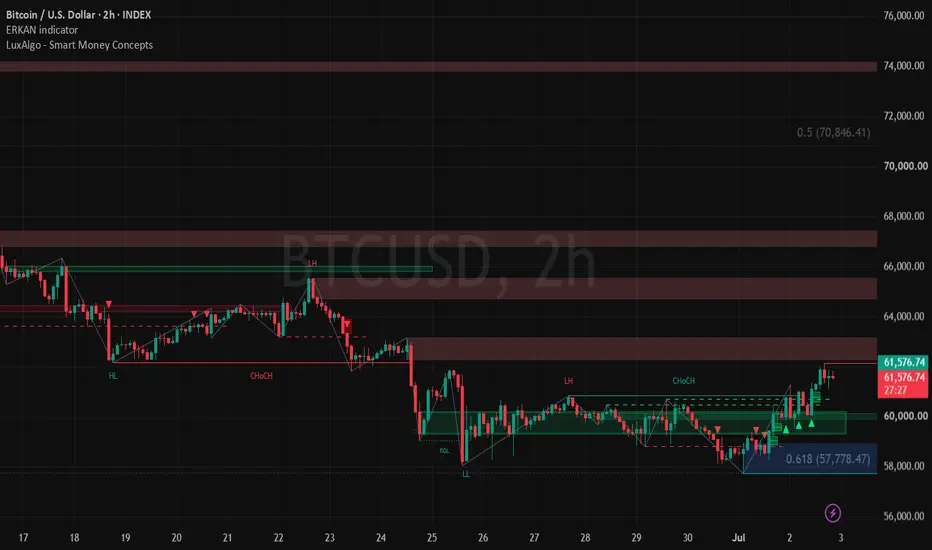
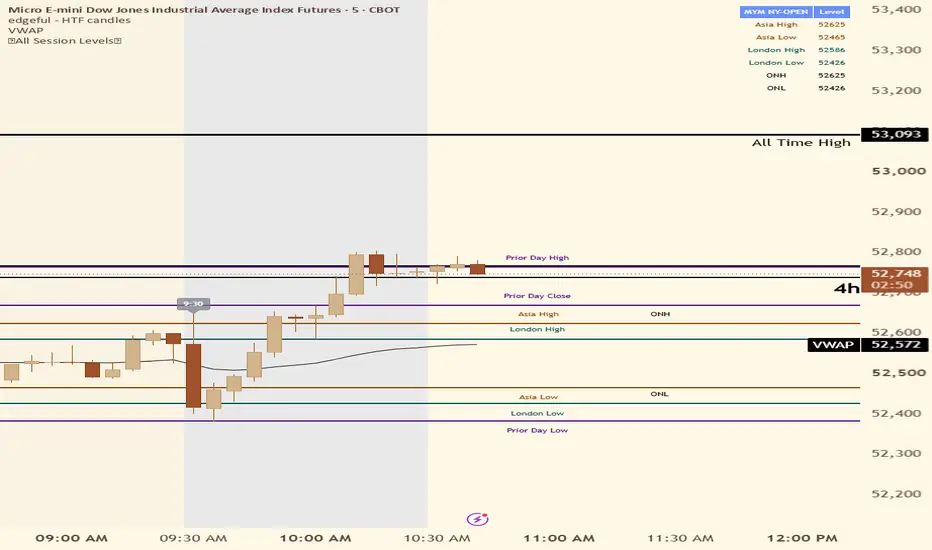
Auto Support & Resistance [ForexCracked]🔷 OVERVIEW
Auto Support & Resistance finds the levels that matter and scores how strong they are. It builds zones from confirmed swing pivots, merges nearby pivots into one level, counts every touch, and rates each zone from one to five stars. Levels never repaint: a zone only appears once its swing is confirmed.
🔷 HOW IT WORKS
Confirmed pivot highs become resistance zones and confirmed pivot lows become support zones. Pivots that land within half an ATR of an existing zone merge into it, and each merge or retest adds a touch. More touches means a more solid fill on the chart and a higher star rating. When price closes through a zone, the level flips: broken resistance becomes support, and broken support becomes resistance, exactly as classic technical analysis describes. Zones that nothing has touched for a long time fade off the chart, and only the strongest levels per side are kept, so the chart stays clean.
🔷 THE DASHBOARD
A compact panel shows the nearest resistance and nearest support: the exact level, how far away it is in pips, and its strength in stars. Drop it in any corner.
🔷 HOW TO USE
Treat the zones as areas of interest, not automatic trades. Watch how price reacts at a strong level: rejections at four and five star zones in the direction of your higher timeframe bias are the classic play, and a clean break and retest of a flipped level is the second. Always confirm with your own analysis and use a stop.
🔷 SETTINGS
Pivot strength, merge distance and zone height (x ATR), max levels per side, break buffer, zone age, colours, and dashboard position.
🔷 ALERTS
Level broken (flip), and New confirmed level.
Free and open-source. Educational tool, not financial advice. Indikator

ICT Sessions & Killzones - Asia London NY + Liquidity[LunqFX]ICT Sessions & Killzones is a modern smart-money session indicator for TradingView that maps the three global trading sessions — Asia, London and New York — as clean, colour-coded ranges and, unlike most session tools, automatically detects liquidity sweeps: the exact moment price raids a previous session's high or low and rejects it. It turns the daily rhythm of the market — the ICT killzones, session opens, and the liquidity pools left behind — into a clear, actionable map. Works on forex, crypto, indices, futures and gold (XAUUSD), on any intraday timeframe. Built in Pine Script v6. Keywords: ICT, killzones, sessions, Asia session, London session, New York session, liquidity, liquidity sweep, stop hunt, smart money concepts, SMC, session high low, opening range, forex, crypto, day trading, scalping.
◆ WHY SESSIONS MATTER
Price does not move randomly — it moves in sessions. Asia sets the range, London expands it, New York reverses or continues it. The highs and lows each session leaves behind become liquidity pools — resting stop orders that smart money targets. Knowing where those levels are, which session is active, and when a level gets swept is the core of session-based and ICT trading. This tool puts all of that on your chart automatically.
◆ WHAT IT DRAWS
Session boxes — Asia (violet), London (teal) and New York (gold) ranges drawn automatically from each session's high and low, kept across history so you can study the pattern.
Previous-session liquidity levels — the last completed session's high and low extended forward as dashed lines. These are the magnets price hunts next.
Liquidity sweep markers — a compact, colour-coded arrow (▲/▼ with the session code A / L / NY) printed when price wicks beyond a prior session extreme and closes back inside — a real stop-raid / rejection. Hover any marker for the full detail.
Neon gradient candles — turquoise up / magenta down, intensity scaled by momentum.
◆ THE LIVE DASHBOARD
A clean, colour-railed panel that reads the sessions at a glance:
Active session — which session is open right now (● marks any that are live; London and New York overlap in real hours, so both can be active).
Range per session — each session's high–low.
Range in pips — how far each session actually moved.
★ Widest range — the session that dominated the day (the "power session").
Timezone readout, fully themeable, adjustable text size.
◆ HOW IT WORKS
Every bar is assigned to a session from its own timestamp (no repainting from higher-timeframe data). The session's running high and low build the box in real time. When a new session opens, the previous session's extremes are locked in as liquidity levels. A liquidity sweep is flagged only when price trades beyond a prior session's high/low and then closes back inside it — a genuine rejection — so a clean break straight through does not trigger a false signal. This keeps the chart clean and every sweep meaningful.
◆ HOW TO USE IT
Trade the killzones. The London and New York opens produce the biggest, cleanest moves — focus your entries there.
Use prior session highs/lows as targets. Untapped levels act as magnets; price often runs them before reversing.
Fade or follow sweeps. When a sweep prints, the raid has taken liquidity — fade it back into range, or trade the reversal in the opposite direction.
Read the dashboard for context. Know which session is active and which had the widest range before you commit.
Set your times/timezone. Adjust each session's hours and the timezone in the settings to match your market and broker.
Combine with your own market structure, order blocks or bias for higher-probability confluence.
◆ SETTINGS
Session times & colours (Asia / London / New York), timezone, session boxes (soft fill or outline), previous-session levels with adjustable extension, liquidity sweep markers, neon candles, and a dashboard (show/hide, position, text size, background).
◆ ALERTS
Liquidity sweep — fires when any previous-session high or low is swept.
◆ LIMITATIONS
Sessions are an intraday concept — use a 1m to 4h timeframe. On daily or higher the panel shows a reminder and no sessions are drawn.
Default session times are in GMT; set the timezone and hours to match your instrument and broker feed, as session boundaries vary by symbol.
A liquidity sweep shows that a level was raided and rejected — it is context and confluence, not a standalone buy/sell signal.
Session ranges reflect the data of your chart's feed; different brokers can differ slightly.
◆ ORIGINALITY & NON-REPAINTING
Original work — the session engine, the rejection-based liquidity-sweep detection, the previous-session liquidity levels and the dashboard are all my own implementation; no third-party code is used. Sessions and levels are built from each bar's own timestamp with no higher-timeframe lookahead, so a sweep printed on a closed bar stays.
Educational analysis tool, not financial advice. Trading involves risk. Always do your own research and manage risk. © LunqFX. Indikator

Fix PIPS - 4 Sessions - FRA / LDN / NY / ASIA4 Sessions draws High/Low range boxes for the four major market sessions — Frankfurt, London, New York and Tokyo.
HOW IT WORKS
Each session is a translucent box that tracks the session's running High/Low as it develops. Session hours are defined in each market's home timezone (Europe/Berlin, Europe/London, America/New_York, Asia/Tokyo), so the boxes always land in the right place regardless of your chart's timezone, and DST transitions in every region are handled automatically — nothing to adjust twice a year.
DEFAULT HOURS (exchange hours, editable)
• Frankfurt — 08:00–09:00 (Xetra open, the hour before London)
• London — 08:00–16:30
• New York — 09:30–16:00 (NYSE)
• Tokyo — 09:00–15:00 (TSE)
SETTINGS
One row per session: enable toggle, color (set fill opacity right in the color picker) and hours. Weekdays only — no weekend boxes on 24/7 markets like crypto. Works on intraday timeframes. Optional on-chart info note with a UA/EN/RU language switch.
ALERTS
Alert conditions fire on each session open (Frankfurt, London, New York, Asia). Indikator

Smart Money Concepts Engine [Quantum Algo]Smart Money Concepts Engine
====================================================
🔶 OVERVIEW
Smart Money Concepts Engine is an all-in-one smart money concepts (SMC) indicator that unifies market structure, order blocks, fair value gaps with inversions, liquidity, and premium and discount analysis into a single engine — and then goes one layer deeper than drawing tools: it scores the confluence of everything on the chart into a transparent zero-to-one-hundred Confluence Score, and narrates the current market read in plain language on a live dashboard.
Most smart money indicators draw concepts and leave the interpretation to you. This engine interprets. At any moment the dashboard answers the questions an institutional-style trader actually asks: What is the structure doing on both tiers? Has liquidity been taken? Is price in premium or discount? Are there fresh zones nearby? How much of this stacks together right now?
🔶 WHAT ARE SMART MONEY CONCEPTS?
Smart money concepts describe how large market participants leave footprints in price: they break structure to reveal intent (Break of Structure and Change of Character), they enter from unmitigated zones of prior aggression (order blocks), they leave imbalances behind fast moves (fair value gaps), they engineer stop runs above equal highs and below equal lows (liquidity sweeps), and they favor buying in the discount half of a range and selling in the premium half. This engine detects, draws, and tracks the life cycle of every one of these elements.
🔶 WHY THIS SCRIPT IS ORIGINAL
1. Confluence Score. A transparent zero-to-one-hundred score built from five weighted, observable conditions: swing and internal structure alignment (25), correct premium or discount positioning for the bias (25), a fresh order block near price (20), imbalance confluence (15), and a recent liquidity sweep in the supportive direction (15). Every point is explainable — nothing is a black box.
2. Narrative engine. The dashboard writes the market read as a plain-language story that updates live, for example: "Bullish structure — sell-side taken — price in discount — demand below." No interpretation gap between what the chart shows and what it means.
3. Zone life cycle everywhere. Order blocks are born fresh, brighten when tested, and are removed the moment they are mitigated — the chart only ever shows zones that still matter. Fair value gaps flip into inversion zones when violated and are removed on the second violation. Equal highs and equal lows are struck through and relabeled the moment they are swept.
4. Volume-graded zones. Every order block is labeled with the relative volume of its origin candle (for example "Demand · 1.8× Volume"), so zone quality is visible at a glance.
5. Dual-tier structure. Swing structure (Break of Structure and Change of Character with lines and labels) and internal structure (compact context markers) are tracked as two independent bias states — and their agreement or disagreement feeds the score.
6. Graded zone-tap signals. When price returns to a fresh zone while both structure tiers align and price sits on the correct side of equilibrium, the engine prints a signal stamped with the live Confluence Score. High-scoring signals are highlighted in the accent color.
7. Anti-clutter engineering. Sweep detection carries per-level memory and a cooldown so the same level can never stack duplicate labels. Every drawing family is capped by input, keeping the chart readable and the auto-scale anchored to current price.
🔶 HOW IT WORKS
Market structure: Swing highs and lows are confirmed with a symmetric pivot lookback. A candle close through a confirmed swing level prints a Break of Structure (BoS) in trend continuation or a Change of Character (CHoCH) on reversal, on both the swing tier and the internal tier. All events are evaluated on closed bars only, so structure and signals do not repaint.
Order blocks: On every swing structure break, the engine locates the origin candle of the move — the last opposite candle before the impulse — and projects it forward as a demand or supply zone, graded by the relative volume of that candle. Zones brighten on first touch and are removed when price closes through them.
Fair value gaps: Three-candle imbalances above a minimum size (measured in Average True Range) are boxed. When price closes through a gap, it flips into an inversion zone acting in the opposite direction; a second violation removes it. Gap detection runs in the background for the Confluence Score even when drawing is disabled.
Liquidity: Consecutive swing highs or lows within a tolerance form Equal Highs (EQH) or Equal Lows (EQL) — resting liquidity lines that follow price. A wick through the level with a close back inside marks a sweep: the line is struck through, relabeled, and the event feeds the score. Single-pivot stop hunts are detected the same way, with per-level memory preventing duplicates.
Premium and discount: The range between the last confirmed swing high and low is mapped into premium, equilibrium, and discount, with deeper tinting in the extreme quartiles. The dashboard reports the live position as a percentage of the range.
Dashboard: A compact, fully themeable panel shows swing bias, internal bias, last event, range position, liquidity status, fresh demand and supply counts, imbalance count, the Confluence Score with a strength meter, and the narrative. Text size, position, and every color are adjustable, and long narrative text wraps inside its cell to keep the panel compact.
🔶 HOW TO USE IT
1. Works on any market — cryptocurrency, forex, gold, indices, stocks, futures — and any timeframe. The engine adapts structure size through the swing and internal length inputs.
2. Read the dashboard top to bottom: bias on both tiers, what just happened, where price sits in the range, and whether liquidity has been taken.
3. The highest-quality condition is full alignment: both tiers agree, a sweep has occurred against the move, price trades on the correct side of equilibrium, and a fresh volume-graded zone waits nearby — exactly what the Confluence Score measures.
4. Treat zone-tap signals as locations of interest stamped with their context quality, not as automatic entries. A score above eighty means nearly everything aligns; below fifty means the setup is thin.
5. Use inversion zones as polarity flips: a violated imbalance often acts as support or resistance from the other side.
6. Fair value gap drawing is off by default for a cleaner chart; enable it in settings — the score uses gap information either way.
🔶 SETTINGS
- Swing and internal structure lengths, structure events to keep.
- Order blocks: origin candle lookback and zones to keep.
- Fair value gaps: minimum size, inversion tracking, gaps to keep (drawing off by default).
- Liquidity: equal level tolerance and levels to keep.
- Premium and discount map with adjustable extension.
- Zone tap signals and signals to keep.
- All chart colors, plus a fully themeable dashboard: position, four text sizes, title band, background, frame, grid, and three text colors.
🔶 ALERTS
- Bullish / Bearish Break of Structure
- Bullish / Bearish Change of Character
- Buy-Side / Sell-Side Liquidity Sweep
- Demand Zone Tap / Supply Zone Tap (score-stamped)
- Fair Value Gap Inversion
🔶 FREQUENTLY ASKED QUESTIONS
Does the indicator repaint? No. Structure events, sweeps, inversions, and signals are evaluated on closed bars at confirmed pivots. Pivot confirmation introduces intentional lag equal to the structure length.
What does the Confluence Score mean? It is a transparent sum of five weighted conditions, not a prediction. It measures how much of the smart money checklist is currently aligned — a context meter, not a probability of profit.
Why did an order block disappear? It was mitigated: price closed through it. The engine removes dead zones so the chart only shows levels that still matter.
Why do sweeps print only once at a level? Each swing level carries sweep memory and a cooldown, preventing the duplicate label stacking common in liquidity tools.
Which markets and timeframes work best? All markets with candle data. Higher timeframes produce larger, cleaner structures; the internal tier keeps lower timeframes readable.
🔶 CREDITS
The smart money concepts implemented here — order blocks, fair value gaps, liquidity sweeps, break of structure, change of character, and premium and discount — are trading concepts popularized by the Inner Circle Trader methodology of Michael J. Huddleston, with intellectual roots in the market logic of Richard D. Wyckoff. This script gratefully acknowledges that lineage. The confluence scoring model, the narrative engine, the zone life cycle system, the volume grading, the anti-duplication sweep memory, and all code in this script are original work
🔶 LIMITATIONS
Structure detection is only as good as the chosen pivot lengths; very noisy instruments may need larger values. Volume grading is less meaningful on symbols with unreliable volume reporting. Removed zones are not kept as historical artifacts. The Confluence Score measures alignment, not outcome. No indicator replaces independent analysis.
🔶 DISCLAIMER
This script is provided strictly for educational and informational purposes. It is not financial advice, an investment recommendation, or a solicitation to buy or sell any financial instrument. Past behavior of any structure event, zone, or signal does not guarantee future results. Trading involves substantial risk. Always do your own research and manage risk independently. Indikator

Fair Value Gap (FVG) Supply & Demand Zones [JPT]🔷 OVERVIEW
Fair Value Gap (FVG) Supply & Demand Zones is a market structure indicator that automatically detects Fair Value Gaps (FVGs) together with Supply and Demand Zones to help traders identify potential areas where price may react.
The indicator continuously scans price action for imbalance formations and plots dynamic zones directly on the chart. When price revisits these areas, the indicator highlights potential reaction zones while displaying LONG and SHORT signals based on its programmed logic.
Designed with a clean visual layout, the indicator helps traders monitor market structure without manually drawing imbalance or supply and demand zones.
🔷 HOW IT WORKS
The indicator continuously analyzes price action to identify market imbalances and institutional trading zones.
When qualifying conditions are met, it automatically:
• Detects Bullish Fair Value Gaps (FVG)
• Detects Bearish Fair Value Gaps (FVG)
• Identifies Demand Zones
• Identifies Supply Zones
• Tracks active zones until they are mitigated
• Displays LONG and SHORT signals according to the indicator's programmed conditions
• Updates zones dynamically as new market structure develops
This provides traders with a structured view of areas where price may revisit before continuing or changing direction.
📈 Bullish Demand Setup
1. A bullish imbalance creates a Fair Value Gap.
2. A Demand Zone is established.
3. Price retraces into the zone.
4. The indicator highlights the area and may display a LONG signal when its programmed conditions are satisfied.
📉 Bearish Supply Setup
1. A bearish imbalance creates a Fair Value Gap.
2. A Supply Zone is established.
3. Price revisits the supply area.
4. The indicator highlights the zone and may display a SHORT signal when its programmed conditions are satisfied.
📊 Dynamic Market Structure
Throughout changing market conditions, the indicator continuously updates:
• Bullish Fair Value Gaps
• Bearish Fair Value Gaps
• Supply Zones
• Demand Zones
• LONG Signals
• SHORT Signals
This helps traders monitor developing market structure in real time.
🔷 VISUAL FEATURES
• Automatic Fair Value Gap Detection
• Automatic Supply Zone Detection
• Automatic Demand Zone Detection
• Dynamic Zone Updates
• LONG & SHORT Signal Labels
• Historical Zone Display
• Customizable Colors
• Clean Chart Layout
• Real-Time Market Structure Updates
• Confirmed Calculation Logic
🔷 INPUTS
The indicator includes customizable settings for:
• Fair Value Gap Detection Length
• Supply & Demand Sensitivity
• Zone Extension
• Maximum Number of Zones
• Show LONG Signals
• Show SHORT Signals
• Color Settings
• Historical Zone Display
🔷 USAGE
A common workflow is:
• Monitor newly created Fair Value Gaps.
• Observe active Supply and Demand Zones.
• Watch for price revisiting these areas.
• Use LONG or SHORT signals together with your own market structure and confirmation techniques.
• Apply appropriate risk management before entering any trade.
The indicator is intended to support technical analysis and can be combined with additional tools such as trend analysis, support and resistance, volume, or candlestick confirmation.
🔷 MARKETS
The indicator can be applied to:
• Forex
• Gold (XAUUSD)
• Silver
• Cryptocurrency
• Stocks
• Indices
• Commodities
It is designed to adapt to multiple markets and can be used for intraday, swing, or longer-term analysis.
🔷 IDEAL TIMEFRAMES
Recommended timeframes include:
• 15 Minute
• 30 Minute
• 1 Hour
• 2 Hour
• 4 Hour
• Daily
Higher timeframes generally produce more significant market structure zones, while lower timeframes provide more frequent trading opportunities.
🔷 BEST PRACTICES
Many traders combine this indicator with:
• Market Structure Analysis
• Trend Direction
• Support & Resistance
• Liquidity Analysis
• Volume
• Candlestick Confirmation
• Risk Management Rules
Using multiple forms of analysis can help provide additional context when evaluating potential trading opportunities.
🔷 DISCLAIMER
This indicator is designed as a technical analysis tool and does not predict future market movements. Fair Value Gaps, Supply Zones, Demand Zones, and LONG or SHORT signals are generated according to the indicator's programmed logic and should be used alongside your own market analysis and risk management. No indicator can guarantee profitable trading results.
Developed by Jos-ProTrader (JPT) Indikator

S/R Zone Flip Tracker v9.5 - SAMMYS/R Zone Flip Tracker
WHAT IT DOES
This indicator detects support and resistance zones from confirmed price pivots, then tracks when price breaks through a zone and "flips" its role - broken resistance becomes support, broken support becomes resistance. Flipped zones are recolored and highlighted for a configurable number of bars, and flip events fire markers and alerts. A ladder table lists the nearest zones above and below current price, sorted by distance, so you can read the immediate S/R structure at a glance without scanning the chart.
HOW IT WORKS
1. Zone creation: Swing highs and lows are detected with ta.pivothigh / ta.pivotlow. Each confirmed pivot creates a zone centered on the pivot price. Zone half-width is either a multiple of ATR (adaptive to volatility) or a fixed dollar amount, selectable in settings.
2. Zone maintenance: Nearby zones are merged when their midpoints fall within an ATR-based merge threshold. New pivots that land inside an existing zone's dedup radius are discarded instead of stacking duplicates. Zones farther from price than a distance cap (the larger of an ATR window and a percent-of-price window) are pruned, and if more zones remain than the per-mode maximum, the farthest ones are evicted. This keeps only the structurally relevant levels on the chart.
3. Flip detection: On each confirmed bar close, every zone is tested against the break method you select. "Close" requires the candle to close beyond the zone edge plus an ATR-based confirmation buffer. "Wick" allows the high/low to trigger the break. When a zone is broken upward it is reclassified as support; broken downward it becomes resistance. The flip bar is recorded so recently flipped zones render in a stronger highlight color and are tagged "S Flipped" / "R Flipped" until the highlight age expires.
4. Flip throttling: A minimum-bars-between-flips setting suppresses repeated flip signals on the same side within a short window, reducing noise in choppy conditions.
5. Trading modes: Scalping, Intraday, Swing, and Position modes each carry their own independent parameter set (pivot length, zone width, confirmation buffer, flip throttle, zone count, distance caps). "Auto" selects the mode from the chart timeframe. "Manual" exposes a fully custom set. This lets one script behave sensibly from 1-minute charts to weekly charts without retuning on every timeframe change.
6. EMA cloud: An optional 9/21 EMA cloud (lengths configurable) provides directional context behind the zones. Green fill when fast is above slow, red when below.
NON-REPAINTING DESIGN
All flip state changes are gated on barstate.isconfirmed, so flips, markers, and alerts only occur on closed bars and do not change after the fact. The optional higher-timeframe confirmation uses request.security with a confirmed-bar offset so the higher-timeframe value never previews an unclosed HTF bar: on closed chart bars it reads the current HTF value, and on the developing bar it reads the last closed HTF value. Pivots by nature confirm only after the right-side lookback completes, so zones appear a fixed number of bars after the actual swing point - this is inherent to pivot detection, not repainting.
HOW TO USE IT
- Leave Trading Mode on Auto to let the script pick parameters from your chart timeframe, or select a mode explicitly to tune it.
- Watch the ladder table for the three nearest resistance zones above price and three nearest support zones below, with price and percent distance for each. An asterisk marks recently flipped zones.
- "Flip Up" markers print when resistance is confirmed broken and reclassified as support; "Flip Dn" marks the opposite. These are commonly read as breakout-and-retest context: a fresh flip zone is a candidate area for price to retest from the other side.
- Enable MTF Close Confirmation to require the break to hold on a higher timeframe before a flip registers, which filters out breaks that only exist on the chart timeframe.
- Three alerts are available: flip to support, flip to resistance, and any flip.
SETTINGS SUMMARY
- Per-mode: pivot left/right length, zone width ATR multiple, confirmation buffer, minimum bars between flips, max zones shown, distance caps (ATR multiple and percent).
- General: ATR length, break method (Close or Wick), dedup and merge thresholds, zone width mode (ATR or Fixed $), flip highlight age.
- Visual: zone colors for support, resistance, and recently flipped states; EMA cloud toggle and lengths; ladder table position and font size.
LIMITATIONS
- Zones confirm pivot-right bars after the swing point (inherent lag of pivot detection).
- Flip markers older than the Flip Label Lookback are not redrawn on chart reload; live alerts are unaffected.
- Requires roughly pivot length plus ATR length bars of history before the first zones appear.
- This is an analysis tool, not a trading system. It does not predict price and generates no buy/sell recommendations. Indikator

Liquidity Sweep Levels ProLIQUIDITY SWEEP LEVELS PRO
WHAT IT DOES
Liquidity Sweep Levels Pro automatically detects buyside liquidity (BSL) and sellside liquidity (SSL) levels from confirmed swing pivots, draws them as horizontal lines that extend in real time, and identifies liquidity sweep events - moments where price wicks through a level to run resting stop orders and then closes back inside. It then applies a displacement-based confirmation model with confluence grading (A+/B/C) so you can distinguish genuine sweep reversals from continuation breaks.
The concept: swing highs accumulate buy stops and breakout orders above them (buyside liquidity); swing lows accumulate sell stops below them (sellside liquidity). When price pierces a level but fails to close beyond it, that liquidity has been consumed - a condition that frequently precedes a reversal toward the opposite pool. When price closes cleanly through a level instead, that is a break, and the indicator treats it as continuation rather than reversal.
HOW IT WORKS
Level detection: Swing highs and lows are identified using confirmed pivots (pivot length adapts to your chart timeframe in Auto mode, or can be set via Scalping / Intraday / Swing / Position / Manual modes). A pivot only becomes a level once fully confirmed - levels never appear retroactively.
Equal high/low clustering: New pivots forming within an ATR-based tolerance of an existing active level merge into it instead of stacking duplicate lines. Merged and retested levels grow thicker (up to 4x width), visually flagging multi-touch liquidity pools where the largest stop clusters accumulate.
Sweep vs break classification (mutually exclusive by construction):
SWEEP: wick pierces the level by at least the minimum pierce distance (ATR-based, configurable) but the bar closes back inside. Line turns dashed, sweep label prints.
BREAK: bar closes through the level. Continuation event, separate alert.
Displacement confirmation: A sweep alone does not confirm a reversal. After an SSL sweep, a later bar must close above the sweep bar's high within the confirmation window (default 5 bars) to print CONF LONG. Mirror logic for BSL sweeps and CONF SHORT. A close back through the sweep wick invalidates the setup; expiry cancels it silently.
Confluence grading: Each confirmed signal is graded using two optional filters measured on the sweep bar - EMA stack alignment (9/21/55) and relative volume (RVOL) - producing A+ (all confluences), B (partial), or C (none). A minimum-confluence gate can hard-filter signals if desired.
HOW TO USE IT
SSL SWEEP followed by CONF LONG: long setup. Stop below the sweep wick; first target is the nearest active BSL line above.
BSL SWEEP followed by CONF SHORT: short setup. Stop above the sweep wick; first target is the nearest active SSL line below.
Thicker lines mark multi-touch pools - sweeps of these levels are typically the higher-probability reversals.
The status table shows active level counts, nearest BSL/SSL prices, pending setup state with grade, and the last signal.
Six alerts are available: BSL/SSL Sweep, BSL/SSL Break, Confirmed Long, Confirmed Short.
Pine Screener support: persistent latched columns (sweep state, confirmed state, pending direction, confluence score, nearest levels, ATR distances) let you scan an entire watchlist for fresh sweep and confirmation events.
Suggested timeframes: 15m as the primary intraday chart; 5m for scalping in Scalping mode; 1H-Daily for swing context. On lower timeframes, raising Min Sweep Pierce (ATR) to 0.10-0.25 filters shallow wick grazes.
NON-REPAINTING DESIGN
All levels are created only from fully confirmed pivots, and all signals - sweeps, breaks, and confirmations - are evaluated strictly on confirmed bars. No signal, label, or line state changes retroactively. The inherent tradeoff of pivot-based detection is that a level appears only after its pivot confirms (pivot length bars after the actual swing); this is disclosed by design rather than hidden with lookahead.
SETTINGS OVERVIEW
Trading Mode: Auto (timeframe-adaptive) or fixed profiles / manual pivot length
Max Levels Per Side, ATR merge tolerance, retest tolerance
Min Sweep Pierce (ATR), swept/broken line handling
Confirmation Window, Min Confluence gate
EMA lengths, RVOL length and threshold, optional EMA plots
Full visual customization: labels, tags, colors, table position
LIMITATIONS AND NOTES
Levels require pivot confirmation, so the first bars of a session rely on levels carried from prior price action - prior-session highs and lows are typically the highest-quality pools.
Confirmation adds deliberate latency: the entry reference is the confirmation close, not the sweep close. This trades a later entry for a much lower false-positive rate.
This indicator identifies liquidity structure and event conditions. It is an analysis tool, not a trading system, and does not guarantee outcomes. Always apply your own risk management. Indikator

Indikator
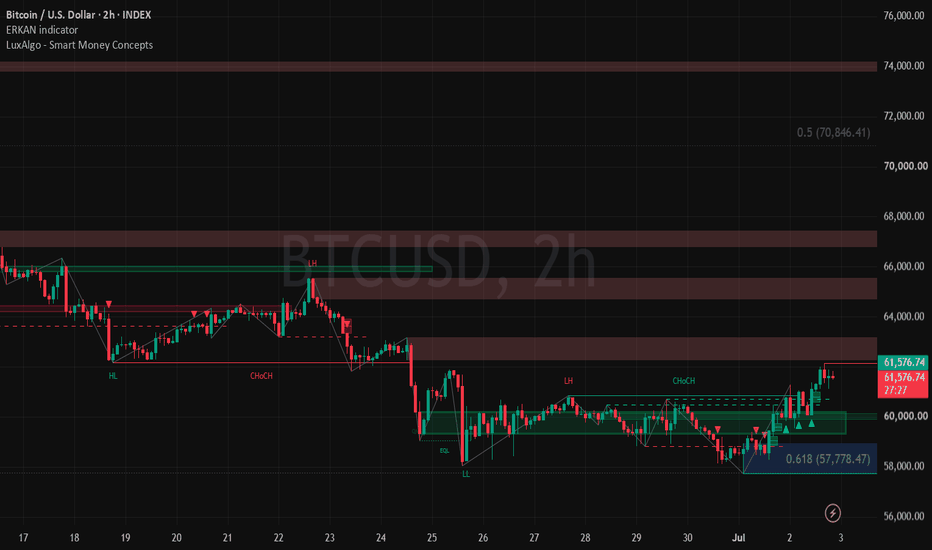
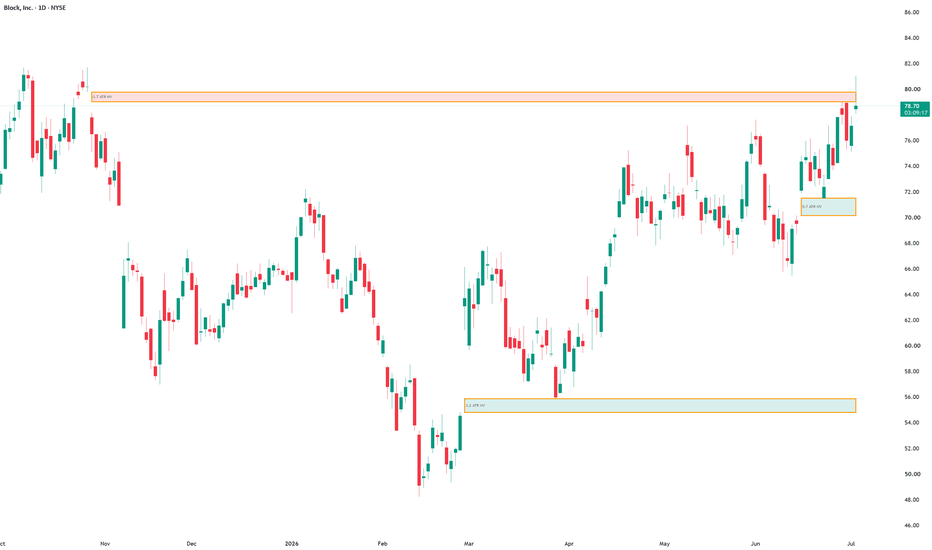
Gap MapGap Map is a price-action mapping tool that identifies true price gaps and tracks them as live zones on the chart.
A true gap is defined as:
* Gap Up: the current open is above the previous bar’s high.
* Gap Down: the current open is below the previous bar’s low.
This means the script does not draw every close-to-open gap. It only maps gaps where the new bar opens completely beyond the previous bar’s range.
1. Core Idea
Price gaps can leave visible areas on the chart where no trading occurred between two consecutive bars.
Gap Map highlights these areas as zones and keeps them active until price fully fills the gap.
The goal is to help users visually track:
* Open true gaps
* Partially filled gaps
* Fully filled gaps
* High-volume gap zones
* Historical fill behavior on the current chart
This is a mapping and analysis tool. It is not a buy/sell indicator and not a trading strategy.
2. What the Indicator Draws
When a valid true gap appears, the script draws a zone between the previous bar’s range and the current open.
For a Gap Up, the zone is drawn between:
Previous high → Current open
For a Gap Down, the zone is drawn between:
Current open → Previous low
The zone remains active until price fully fills the gap.
3. Gap Size Filter
The script includes a minimum gap size filter based on ATR.
Gap size is measured in ATR units:
Gap size / Previous ATR
This helps filter out very small gaps that may not be visually or analytically useful.
Users can reduce the threshold to show more gaps or increase it to focus only on larger gaps.
4. Partial Fill Behavior
The script can optionally shrink a gap zone when price partially fills it.
When this option is enabled, the zone adjusts to show only the remaining unfilled part of the gap.
This helps users see whether a gap is still fully open, partially filled, or already closed.
5. Full Gap Fill
A gap is considered fully filled when price reaches the full-fill level.
For a Gap Up, the gap is filled when price trades back to the previous high.
For a Gap Down, the gap is filled when price trades back to the previous low.
Filled zones can either be removed from the chart or kept as faded historical zones, depending on the user’s settings.
6. High-Volume Gaps
The script compares the gap bar’s volume with its average volume.
If the gap appears with volume above the selected relative-volume threshold, it is marked with a highlighted border.
These high-volume gaps are treated as breakaway candidates for review.
This does not mean the gap cannot fill. It only means the gap occurred with stronger-than-usual volume and may deserve additional attention.
7. Optional Statistics Table
The optional statistics table summarizes gap behavior on the current chart.
It can show:
* Number of true gap-up zones
* Number of true gap-down zones
* Percentage filled so far
* Median bars to fill
* Number of open gaps now
* High-volume gap fill statistics
The table is intended as historical context for the current symbol and timeframe.
It should not be interpreted as a forecast that future gaps must behave the same way.
8. How to Use
A practical workflow:
1. Add the indicator to a clean chart.
2. Keep the default ATR filter first.
3. Review open gap zones.
4. Check whether price is approaching a gap zone.
5. Use partial-fill behavior to monitor how much of the gap remains open.
6. Turn on the statistics table if you want historical fill context.
7. Combine the gap map with trend, volume, support/resistance, and broader market context.
8. Best Use Cases
Gap Map is most useful for markets that can create real gaps, such as:
* Stocks
* ETFs
* Indices
* Session-based futures
* Markets with clear open/close sessions
It is less meaningful on continuously traded markets where true session gaps are rare.
10. Important Notes
This script maps true gaps only.
It does not draw every close-to-open difference.
It does not predict that a gap must fill.
It does not provide entry or exit signals.
It does not measure order flow.
It does not execute trades.
High-volume gap highlighting is for visual review only, not a confirmation of direction.
11. Alerts
The script includes alert conditions for:
* New true gap up
* New true gap down
* Gap filled
Alerts are informational only. They do not confirm future price movement.
12. Limitations
Gap behavior can vary by symbol, timeframe, volatility regime, market structure, earnings events, news events, and liquidity conditions.
A gap zone can remain open for a long time.
A gap can be partially filled and then price can continue in the original direction.
Large high-volume gaps may behave differently from small low-volume gaps.
Historical fill statistics are calculated from the current chart’s own history and should be treated as context, not a guarantee.
13. Educational Disclaimer
This script is for educational and chart-analysis purposes only. It is not financial advice, investment advice, or a recommendation to buy or sell any financial instrument. Users are responsible for their own analysis, risk management, and trading decisions.
Indikator
SMT Sniper Entry Engine [trade_w_samet]🎯 SMT Sniper Entry Engine
SMT Sniper Entry Engine is a structured correlated-market divergence and confirmation indicator designed to help traders study liquidity sweeps, SMT divergence, reclaim quality, pair correlation, external-range location, displacement, Fair Value Gap evidence, micro-structure confirmation, and permanent bar-close UP or DOWN signals through one coordinated workflow.
The script is built around one central idea:
An SMT divergence should not automatically become an entry signal.
Instead of treating every difference between two correlated markets as equally meaningful, the engine first identifies a one-market liquidity sweep, then evaluates reclaim behavior, ATR-normalized sweep depth, candle direction, rejection quality, range expansion, pair correlation, external-range location, and divergence separation before the SMT event is accepted.
A qualified SMT event still does not create an immediate final signal.
The accepted SMT event arms a temporary confirmation sequence.
The engine then waits for directional displacement, a confirmed break of the SMT candle, and the additional evidence required by the active Engine Preset before a permanent UP or DOWN label is printed.
The indicator includes:
• Automatic comparison-symbol selection for supported metals, indices, cryptocurrencies, forex majors, and common forex crosses
• Manual comparison-symbol mode
• Same-timeframe comparison-market data
• Closed-bar rolling liquidity references
• Current-bar-close SMT divergence detection
• Either-market sweep acceptance
• Same-bar liquidity reclaim validation
• ATR-normalized sweep-depth measurement
• Chart-candle direction filtering
• Rejection-close filtering
• Minimum range-expansion filtering
• Separate bullish and bearish 0–100 Base Quality Scores
• Log-return pair-correlation analysis
• External-range location filtering
• ATR-normalized divergence-separation analysis
• Separate bullish and bearish 0–100 Sniper Scores
• Standard, Sniper, and Elite Engine Presets
• A temporary eight-bar confirmation window
• Sequential evidence accumulation across separate closed candles
• Directional displacement confirmation
• SMT-candle break confirmation
• Fair Value Gap confirmation
• Micro-structure break confirmation
• ATR-buffered setup invalidation
• Setup expiration
• Directional SMT cooldown
• Final signal cooldown
• One final UP or DOWN signal per completed SMT sequence
• Minimal historical SMT markers
• Dotted historical SMT reference lines
• Blue UP and orange DOWN labels
• Adjustable UP / DOWN label size
• Signal-confirming FVG boxes
• Recent-only chart-object
• A premium bottom-right dashboard
• Static TradingView alert conditions
• Combined dynamic alert() support
• “Any alert() function call” compatibility
• Data Window diagnostics
• Confirmed-close permanent signals
• No pivot functions
• No future-bar confirmation
• No historical signal backplotting
The purpose of this script is to provide a structured way to study when a correlated-market divergence is supported by sufficient liquidity, correlation, location, reaction, and confirmation evidence.
It is not financial advice.
It is not an automated trading system.
It does not guarantee profitable trades.
It does not execute broker orders.
It does not calculate position size.
It does not include a built-in TP / SL trade-management engine.
It does not provide verified win-rate or profitability statistics.
It does not replace independent analysis, execution planning, or risk management.
━━━━━━━━━━━━━━━━━━━━━━
📌 OVERVIEW
━━━━━━━━━━━━━━━━━━━━━━
At a high level, SMT Sniper Entry Engine does the following:
• Selects a comparison market automatically or manually.
• Requests the comparison market’s open, high, low, close, and ATR data on the chart timeframe.
• Builds rolling liquidity references from already completed candles.
• Checks whether only one market swept its corresponding liquidity reference.
• Requires the sweeping market to reclaim the reference on the same completed candle.
• Measures sweep depth relative to ATR.
• Evaluates chart-candle direction.
• Evaluates the candle’s closing position.
• Evaluates minimum range expansion relative to ATR.
• Produces separate bullish and bearish 0–100 Base Quality Scores.
• Measures the relationship between chart and comparison-market returns.
• Evaluates whether bullish SMT appears near the lower portion of the external range.
• Evaluates whether bearish SMT appears near the upper portion of the external range.
• Measures how clearly the non-sweeping market held its own liquidity reference.
• Produces separate bullish and bearish 0–100 Sniper Scores.
• Applies Standard, Sniper, or Elite acceptance thresholds.
• Confirms a qualified SMT event only after the current candle closes.
• Arms a temporary sequential confirmation window.
• Accumulates displacement, SMT-candle break, FVG, and structure evidence.
• Invalidates the setup if price closes beyond the SMT extreme by the stored ATR buffer.
• Expires the setup when confirmation does not arrive inside the available window.
• Applies final signal cooldown protection.
• Prints a permanent blue UP or orange DOWN label only after every required condition is confirmed.
• Optionally draws the FVG associated with the final signal.
• Displays current engine state, comparison symbol, correlation, active score, and signal counts in the dashboard.
• Provides separate static alert conditions.
• Provides one combined dynamic final-signal alert workflow.
• Exposes internal diagnostic values through TradingView’s Data Window.
The indicator does not use machine-learning prediction.
Its scores are not probabilities.
Its signal counts are not wins and losses.
Its labels do not promise future direction.
The script is a rule-based educational framework that explains how a raw correlated-market divergence becomes an accepted, rejected, invalidated, expired, or finally confirmed setup.
━━━━━━━━━━━━━━━━━━━━━━
🧠 CORE IDEA
━━━━━━━━━━━━━━━━━━━━━━
The core idea behind SMT Sniper Entry Engine is that two markets with a meaningful positive relationship do not always take corresponding liquidity at the same time.
When one market trades beyond a prior liquidity reference while the other market holds its own reference, the difference can create an SMT divergence.
However, the divergence alone contains limited information.
A basic SMT event does not automatically explain:
• whether the sweep was meaningful relative to volatility
• whether the sweeping market reclaimed the reference
• whether the chart candle closed with directional rejection
• whether the candle range expanded enough to matter
• whether the selected markets remain sufficiently correlated
• whether the event occurred near a useful external-range location
• whether the non-sweeping market clearly held its own level
• whether price produced directional displacement afterward
• whether the SMT candle was actually broken
• whether an FVG or micro-structure break confirmed the reaction
• whether the setup remained valid during the confirmation window
• whether another recent final signal is still inside the cooldown period
The engine therefore uses a staged sequence:
comparison-market selection
→ closed-bar liquidity references
→ one-market sweep
→ same-bar reclaim
→ Base Quality Score
→ pair-correlation validation
→ external-range location
→ divergence-separation validation
→ Sniper Score
→ confirmed SMT event
→ temporary setup arming
→ sequential reaction evidence
→ invalidation or expiration control
→ permanent UP or DOWN signal
For bullish conditions, the engine studies prior-low liquidity, bullish rejection, lower external-range location, directional displacement, a close above the SMT candle high, and bullish confirmation evidence.
For bearish conditions, the same process is mirrored around prior highs.
The purpose is not to produce the largest possible number of signals.
The purpose is to make the acceptance process selective, visible, and understandable.
━━━━━━━━━━━━━━━━━━━━━━
🧩 WHY THIS SCRIPT IS NOT A SIMPLE BUY/SELL INDICATOR
━━━━━━━━━━━━━━━━━━━━━━
SMT Sniper Entry Engine is not designed to be used as a blind signal generator.
A raw correlated-market divergence must move through multiple stages:
One market sweeps liquidity
→ the comparison market does not make the same sweep
→ the sweeping market reclaims its reference
→ sweep depth is evaluated
→ chart-candle direction is checked
→ rejection-close quality is checked
→ range expansion is checked
→ the Base Quality Score is calculated
→ pair correlation is checked
→ external-range location is checked
→ divergence separation is checked
→ the Sniper Score is calculated
→ the SMT event is accepted
→ the confirmation window opens
→ directional displacement is accumulated
→ the SMT candle must be broken
→ FVG and/or micro-structure evidence is accumulated
→ the setup must avoid invalidation
→ the setup must confirm before expiration
→ the final UP or DOWN label appears
Each module serves a different purpose.
The comparison engine defines the external market used for SMT analysis.
The liquidity engine identifies the one-market sweep.
The reclaim engine checks whether the liquidity event closed back inside the reference.
The Base Quality Score evaluates the completed SMT candle.
The Sniper Context Engine evaluates correlation, location, separation, and sweep quality.
The sequential confirmation engine evaluates what price does after the SMT event.
The invalidation and expiration controls remove setups that no longer satisfy the intended sequence.
The dashboard explains the current engine state.
This makes the script a coordinated SMT-confirmation workflow rather than a simple divergence marker.
━━━━━━━━━━━━━━━━━━━━━━
⚙️ HOW THE SCRIPT WORKS
━━━━━━━━━━━━━━━━━━━━━━
The script operates through connected calculation stages.
First, the engine selects a comparison symbol.
Auto mode uses the built-in symbol matrix.
Manual mode uses the symbol selected by the user.
The comparison market is requested on the same timeframe as the chart.
= request.security(
comparisonSymbol,
timeframe.period,
,
gaps = barmerge.gaps_off,
lookahead = barmerge.lookahead_off,
ignore_invalid_symbol = true)
The request uses lookahead_off.
The engine then calculates rolling chart and comparison-market liquidity references while excluding the current candle.
float chartPriorLow = ta.lowest(low , referenceLookback)
float chartPriorHigh = ta.highest(high , referenceLookback)
float comparisonPriorLow = ta.lowest(comparisonLow , referenceLookback)
float comparisonPriorHigh = ta.highest(comparisonHigh , referenceLookback)
The default reference lookback is 12 bars.
A bullish divergence is possible when one market sweeps a prior low and the other market does not.
A bearish divergence is possible when one market sweeps a prior high and the other market does not.
The sweeping market must reclaim the level on the same completed candle.
The candidate is then evaluated through:
• ATR-normalized sweep depth
• chart-candle direction
• close location
• range expansion
• Base Quality Score
• pair correlation
• external-range location
• divergence separation
• Sniper Score
• directional cooldown
When the SMT event is accepted, the engine stores:
• setup direction
• SMT bar
• SMT extreme
• SMT reaction trigger
• current ATR
• Base Quality Score
• Sniper Score
• sequential evidence states
• first confirmed FVG coordinates
The engine then monitors the next closed candles.
A final signal is accepted only when the active preset’s required evidence is present and the setup has not invalidated or expired.
━━━━━━━━━━━━━━━━━━━━━━
🟢 BULLISH SMT LOGIC
━━━━━━━━━━━━━━━━━━━━━━
A bullish SMT candidate begins at prior lows.
The engine checks the chart symbol and comparison market together.
A bullish sweep divergence exists when either:
• the chart symbol trades below its prior low while the comparison market does not trade below its corresponding prior low
• the comparison market trades below its prior low while the chart symbol does not trade below its corresponding prior low
The engine accepts a sweep from either market.
The sweeping market must reclaim the prior-low reference when reclaim validation is active.
The completed chart candle must also satisfy the active quality requirements.
The default Sniper profile evaluates:
• sufficient ATR-normalized sweep depth
• bullish chart-candle direction
• a close in the stronger portion of the candle
• minimum candle-range expansion
• minimum Base Quality Score
• minimum positive pair correlation
• location near the lower portion of the external range
• minimum divergence separation
• minimum Sniper Score
• directional SMT cooldown availability
bool bullishSmtEvent =
bullishRawSmtCandidate and
bullishSniperPass and
bullishCooldownPass
When the bullish SMT event is confirmed, the engine stores:
• the SMT low as the bullish invalidation extreme
• the SMT high as the bullish reaction-break trigger
• the current ATR
• the current Base Quality Score
• the current Sniper Score
The confirmation sequence then waits for:
• bullish displacement
• a close above the SMT candle high
• FVG and/or micro-structure evidence according to the active preset
The bullish SMT marker is context.
The final blue UP label is the completed signal.
━━━━━━━━━━━━━━━━━━━━━━
🔴 BEARISH SMT LOGIC
━━━━━━━━━━━━━━━━━━━━━━
A bearish SMT candidate begins at prior highs.
A bearish sweep divergence exists when either:
• the chart symbol trades above its prior high while the comparison market does not trade above its corresponding prior high
• the comparison market trades above its prior high while the chart symbol does not trade above its corresponding prior high
The sweeping market must reclaim the prior-high reference when reclaim validation is active.
The completed chart candle must also satisfy the active quality requirements.
The default Sniper profile evaluates:
• sufficient ATR-normalized sweep depth
• bearish chart-candle direction
• a close in the weaker portion of the candle
• minimum candle-range expansion
• minimum Base Quality Score
• minimum positive pair correlation
• location near the upper portion of the external range
• minimum divergence separation
• minimum Sniper Score
• directional SMT cooldown availability
When the bearish SMT event is confirmed, the engine stores:
• the SMT high as the bearish invalidation extreme
• the SMT low as the bearish reaction-break trigger
• the current ATR
• the current Base Quality Score
• the current Sniper Score
The confirmation sequence then waits for:
• bearish displacement
• a close below the SMT candle low
• FVG and/or micro-structure evidence according to the active preset
The bearish SMT marker is context.
The final orange DOWN label is the completed signal.
━━━━━━━━━━━━━━━━━━━━━━
💎 SMT QUALITY FILTER SYSTEM
━━━━━━━━━━━━━━━━━━━━━━
The script calculates separate bullish and bearish Base Quality Scores.
The score evaluates the completed SMT candle and its underlying liquidity event.
Each score is limited to 0–100.
The components are:
Sweep Role — maximum 25 points
The event must contain a valid one-market liquidity sweep.
Only one market should take the corresponding prior high or prior low.
Reclaim — maximum 20 points
The sweeping market must close back inside its prior liquidity reference.
Sweep Depth — maximum 20 points
The distance beyond the reference is measured relative to the corresponding market’s ATR.
Chart Candle Direction — maximum 15 points
Bullish SMT prefers a bullish chart candle.
Bearish SMT prefers a bearish chart candle.
Rejection Close — maximum 10 points
Bullish SMT prefers the chart close toward the high of the candle.
Bearish SMT prefers the chart close toward the low.
Range Expansion — maximum 10 points
The chart candle’s total range is compared with chart ATR.
The total score structure is:
25 + 20 + 20 + 15 + 10 + 10 = 100 points.
Preset-dependent minimum Base Quality Scores are:
• Standard: 60
• Sniper: 75
• Elite: 85
The Base Quality Score is not a win rate.
It is not a probability.
It measures how closely the completed SMT event matches the engine’s liquidity and candle-quality framework.
━━━━━━━━━━━━━━━━━━━━━━
📏 VOLATILITY / ATR NORMALIZATION FILTER
━━━━━━━━━━━━━━━━━━━━━━
The indicator uses ATR normalization to compare distances across changing volatility conditions.
ATR normalization is applied to:
• chart-side sweep depth
• comparison-side sweep depth
• divergence separation
• displacement body size
• setup invalidation buffer
• chart-candle range expansion
Sweep depth is calculated in relation to the ATR of the market that performed the sweep.
For example:
Chart Sweep Depth = distance beyond chart reference / chart ATR.
Comparison Sweep Depth = distance beyond comparison reference / comparison ATR.
Preset-dependent minimum sweep depth is:
• Standard: 0.04 ATR
• Sniper: 0.10 ATR
• Elite: 0.18 ATR
The chart candle must also meet a minimum range-to-ATR requirement:
• Standard: 0.40 ATR
• Sniper: 0.60 ATR
• Elite: 0.85 ATR
The setup invalidation buffer is based on the ATR stored when the SMT event occurs.
The default buffer is 0.10 ATR beyond the SMT extreme.
ATR normalization helps reduce dependence on raw price units.
It does not make one configuration universal.
Different symbols, sessions, data feeds, and market conditions can still produce different behavior.
━━━━━━━━━━━━━━━━━━━━━━
🕯️ DISPLACEMENT QUALITY FILTER
━━━━━━━━━━━━━━━━━━━━━━
After an SMT event is accepted, the engine requires directional displacement before a final signal can appear.
A bullish displacement candle requires:
• a confirmed closed candle
• close above open
• body size of at least 0.45 ATR
• body-to-range ratio of at least 0.55
• upper wick no greater than 0.35 of the full candle range
A bearish displacement candle requires:
• a confirmed closed candle
• close below open
• body size of at least 0.45 ATR
• body-to-range ratio of at least 0.55
• lower wick no greater than 0.35 of the full candle range
bool bullishDisplacement =
barstate.isconfirmed and
close > open and
signalCandleBody >= chartAtr * displacementBodyAtr and
signalBodyRatio >= displacementBodyPercent and
bullishOppositeWickRatio <= maximumOppositeWickPercent and
bullishPreviousBreakPass
The bearish process is mirrored.
The previous-bar break option is disabled in the locked default engine.
The more important directional reaction requirement is the SMT-candle break.
Displacement confirms that the market produced a completed directional response after the SMT event.
It does not guarantee continuation.
━━━━━━━━━━━━━━━━━━━━━━
📊 REACTION STRENGTH FILTER
━━━━━━━━━━━━━━━━━━━━━━
The engine does not require every confirmation component to appear on the same candle.
Instead, reaction evidence can accumulate across separate closed candles inside the temporary confirmation window.
The engine tracks:
• displacement
• SMT-candle break
• Fair Value Gap
• micro-structure break
Bullish SMT-candle break:
• price must close above the stored SMT candle high
Bearish SMT-candle break:
• price must close below the stored SMT candle low
Bullish FVG:
• current low is above the high from two bars earlier
Bearish FVG:
• current high is below the low from two bars earlier
Bullish micro-structure break:
• current close exceeds the highest high from the previous five closed bars
Bearish micro-structure break:
• current close falls below the lowest low from the previous five closed bars
Evidence is persistent while the setup remains active.
For example:
SMT event
→ displacement appears
→ FVG appears later
→ structure break appears on another candle
→ final signal confirms
The active Engine Preset determines which accumulated evidence is required.
━━━━━━━━━━━━━━━━━━━━━━
🧼 CONFIRMED SIGNAL FILTER
━━━━━━━━━━━━━━━━━━━━━━
Permanent SMT events and final UP / DOWN labels wait for candle close.
The engine uses confirmed-bar checks for:
• raw SMT candidates
• final SMT acceptance
• displacement
• FVG detection
• micro-structure breaks
• setup invalidation
• final UP signals
• final DOWN signals
The comparison-market request uses lookahead_off.
Rolling liquidity references exclude the current candle.
No future candle is used to decide whether the current candle contains an SMT event.
No final signal is plotted back onto the original SMT candle after later evidence becomes available.
The confirmation opportunity is temporary.
The default window is eight bars.
The minimum delay is one bar after the SMT event.
If the active evidence does not complete in time, the setup expires.
Historical output can still change when:
• Engine Preset changes
• comparison symbol changes
• Auto or Manual mode changes
• chart symbol changes
• timeframe changes
• exchange or broker feed changes
• historical data is revised
• the loaded history range changes
Confirmed-close logic prevents unfinished-candle conditions from becoming permanent chart signals.
It does not mean all brokers or data feeds will produce identical historical output.
━━━━━━━━━━━━━━━━━━━━━━
🎯 ENTRY MODEL
━━━━━━━━━━━━━━━━━━━━━━
SMT Sniper Entry Engine uses a confirmed-signal entry model rather than a built-in broker-order model.
A final directional setup is created only when:
• a qualified SMT event exists
• the confirmation window is open
• the setup has not invalidated
• all preset-required evidence has been accumulated
• final signal cooldown is available
• the current candle is confirmed
The final signal reference is the close of the candle where the UP or DOWN label is printed.
For an UP setup:
• the label appears below the confirmed signal candle
• the signal represents completed bullish SMT confirmation
For a DOWN setup:
• the label appears above the confirmed signal candle
• the signal represents completed bearish SMT confirmation
The script does not automatically calculate:
• an entry line
• a stop-loss level
• take-profit targets
• position size
• account risk
• broker quantity
• trade outcome
The final signal-bar close can be used as an analytical reference.
It is not a guaranteed fill.
Users must define their own execution, invalidation, stop, target, and risk model.
━━━━━━━━━━━━━━━━━━━━━━
🔗 COMPARISON MARKET MODEL
━━━━━━━━━━━━━━━━━━━━━━
The indicator supports Auto and Manual comparison-symbol modes.
Auto mode recognizes common ticker text and assigns a predefined positively related market.
Built-in mappings include:
Metals
• XAU or GOLD → OANDA:XAGUSD
• XAG or SILVER → OANDA:XAUUSD
Indices
• NAS, US100, USTEC, NDX, or NQ → OANDA:SPX500USD
• SPX, US500, SP500, or ES → OANDA:NAS100USD
• US30, DJI, DOW, or YM → OANDA:SPX500USD
Cryptocurrencies
• BTC → BINANCE:ETHUSDT
• ETH → BINANCE:BTCUSDT
Forex majors
• EURUSD ↔ GBPUSD
• AUDUSD ↔ NZDUSD
• USDCAD ↔ USDCHF
• USDJPY → CADJPY
JPY crosses
• EURJPY ↔ GBPJPY
• AUDJPY ↔ NZDJPY
• CADJPY → USDJPY
• CHFJPY → EURJPY
EUR and GBP crosses
• EURAUD ↔ GBPAUD
• EURNZD ↔ GBPNZD
• EURCAD ↔ GBPCAD
• EURCHF ↔ GBPCHF
• EURGBP → GBPUSD
AUD and NZD crosses
• AUDCAD ↔ NZDCAD
• AUDCHF ↔ NZDCHF
• AUDNZD → NZDUSD
Auto mode is based on ticker-name recognition.
Broker symbols can include prefixes, suffixes, futures contract codes, or synthetic names that are not recognized by the built-in matrix.
When the chart symbol is not recognized, the engine can fall back to the Manual Comparison Symbol value.
The dashboard should therefore be checked before relying on Auto mode.
Manual mode allows the user to select the comparison market directly.
The current engine is designed for positively correlated relationships.
Selecting an inversely related market can make the correlation and SMT logic unsuitable.
━━━━━━━━━━━━━━━━━━━━━━
🎯 SNIPER SCORE MODEL
━━━━━━━━━━━━━━━━━━━━━━
The engine produces separate bullish and bearish Sniper Scores.
The Sniper Score evaluates broader context around the SMT event.
The maximum score is 100.
The structure is:
Base SMT Quality — maximum 35 points
The 0–100 Base Quality Score contributes 35% of its value.
Pair Correlation — maximum 25 points
Positive effective correlation contributes proportionally.
External-Range Location — maximum 20 points
Bullish SMT receives this component when it occurs below the active maximum bullish range position.
Bearish SMT receives this component when it occurs above the active minimum bearish range position.
Divergence Separation — maximum 10 points
The event receives this component when the non-sweeping market holds its reference by at least the required ATR-normalized distance.
Sweep Depth — maximum 10 points
A valid minimum sweep receives five points.
A sweep at least 1.5 times the minimum depth receives ten points.
Minimum accepted Sniper Scores are:
• Standard: 60
• Sniper: 78
• Elite: 88
Minimum positive pair correlation is:
• Standard: 0.35
• Sniper: 0.55
• Elite: 0.70
External-range requirements are:
Bullish maximum position
• Standard: 0.45
• Sniper: 0.33
• Elite: 0.25
Bearish minimum position
• Standard: 0.55
• Sniper: 0.67
• Elite: 0.75
Minimum divergence separation is:
• Standard: 0.00 ATR
• Sniper: 0.03 ATR
• Elite: 0.08 ATR
The Sniper Score is not a probability.
A score of 88 does not mean an 88% probability of success.
It measures rule-based confluence according to this script’s internal framework.
━━━━━━━━━━━━━━━━━━━━━━
📦 ACTIVE SMT / FVG VISUAL SYSTEM
━━━━━━━━━━━━━━━━━━━━━━
The script separates SMT context from final signal confirmation.
Historical SMT visuals can include:
• a dotted line from the prior chart-side liquidity reference to the SMT candle
• a minimal bullish or bearish marker near the SMT event
The default historical visual system keeps recent objects only.
The default limits are:
• eight bullish SMT lines
• eight bullish SMT markers
• eight bearish SMT lines
• eight bearish SMT markers
• ten final signal labels
• six signal FVG boxes
Older visual objects can be removed when the corresponding recent-only limit is exceeded.
This is chart-object management.
It does not move a signal to another candle.
Final signal visuals include:
UP
• blue label
• white bold-italic text
• printed below the confirmed signal candle
DOWN
• orange label
• white bold-italic text
• printed above the confirmed signal candle
Signal FVG Box
• appears only when stored FVG evidence exists
• uses the FVG that participated in the active confirmation sequence
• extends 12 bars to the right
• uses a lightly shaded bullish or bearish fill
The FVG box is an analytical confirmation visual.
It is not a guaranteed support, resistance, entry, stop, or target zone.
━━━━━━━━━━━━━━━━━━━━━━
🚦 ONE ACTIVE SMT SETUP AT A TIME
━━━━━━━━━━━━━━━━━━━━━━
The script maintains one active pending SMT confirmation sequence at a time.
When a qualified bullish SMT event appears:
• the active setup direction becomes bullish
• the bullish SMT extreme and trigger are stored
• the evidence state is reset
When a qualified bearish SMT event appears:
• the active setup direction becomes bearish
• the bearish SMT extreme and trigger are stored
• the evidence state is reset
A newly accepted SMT event can therefore replace the currently stored pending setup state.
The active setup remains in memory until:
• the final UP signal confirms
• the final DOWN signal confirms
• the setup invalidates
• the setup expires
• another accepted SMT event overwrites the pending state
This design prevents multiple overlapping confirmation sequences from creating an unclear chart state.
It does not prevent the user from performing independent analysis on other markets or timeframes.
━━━━━━━━━━━━━━━━━━━━━━
⚠️ SEQUENTIAL CONFIRMATION WINDOW HANDLING
━━━━━━━━━━━━━━━━━━━━━━
The default confirmation window is eight bars.
The final signal cannot appear on the original SMT candle because the minimum bars after SMT is one.
The engine monitors each completed candle inside the window.
Evidence can be accumulated in different orders.
For example:
SMT
→ displacement
→ SMT-candle break
→ FVG
→ final signal
or:
SMT
→ FVG
→ displacement
→ SMT-candle break
→ structure break
→ final signal
Preset behavior:
Standard
Uses Reactive confirmation.
Requires:
• displacement
• SMT-candle break
Sniper
Uses Confirmed confirmation.
Requires:
• displacement
• SMT-candle break
• FVG or micro-structure break
Elite
Uses Elite confirmation.
Requires:
• displacement
• SMT-candle break
• FVG
• micro-structure break
The engine does not use the historical high-low sequence inside a candle to simulate order execution.
It evaluates whether each closed candle satisfied a defined piece of evidence.
If the setup does not complete inside the window, it expires.
━━━━━━━━━━━━━━━━━━━━━━
🏷️ SMT SNIPER LABELS
━━━━━━━━━━━━━━━━━━━━━━
The indicator uses separate context and final-signal labels.
SMT Context Markers
The default SMT marker layout is Minimal.
Bullish SMT uses an upward marker.
Bearish SMT uses a downward marker.
The marker appears on the actual SMT confirmation candle.
Its tooltip can include:
• bullish or bearish SMT direction
• Sniper Score
• Base Quality Score
• effective pair correlation
• active comparison symbol
Final Signal Labels
The final labels display:
𝙐𝙋
or:
𝘿𝙊𝙒𝙉
UP uses a blue background.
DOWN uses an orange background.
The text is white.
Available final-label sizes are:
• Tiny
• Small
• Normal
• Large
• Huge
Normal is the default.
The UP tooltip can include:
• bullish SMT confirmation mode
• final stored Sniper Score
• final stored Base Quality Score
The DOWN tooltip contains the mirrored information.
The SMT marker and final signal label serve different purposes.
The SMT marker identifies the qualified correlated-market divergence.
The UP or DOWN label identifies the completed sequential confirmation.
━━━━━━━━━━━━━━━━━━━━━━
📍 SMT DISPLAY MODES
━━━━━━━━━━━━━━━━━━━━━━
The indicator operates directly on the main price chart.
The public Display settings provide control over:
Show SMT
Shows or hides historical SMT markers and reference lines.
Show UP / DOWN
Shows or hides final signal labels.
UP / DOWN Label Size
Controls the size of final UP and DOWN labels.
Show Signal FVG
Shows or hides the stored FVG box associated with a final signal.
Show Dashboard
Shows or hides the premium bottom-right dashboard.
The internal visual profile uses:
• Clean layout
• Recent Only historical display
• dotted SMT reference lines
• minimal SMT markers
• normal SMT marker size
• limited historical object counts
• no separate displacement circles by default
Input values are hidden from TradingView’s status line.
Diagnostic plots remain available in the Data Window without adding visible price-scale clutter.
━━━━━━━━━━━━━━━━━━━━━━
🧹 SETUP INVALIDATION
━━━━━━━━━━━━━━━━━━━━━━
Not every accepted SMT event remains eligible.
A bullish setup invalidates when a completed candle closes below:
SMT low − stored SMT ATR × 0.10.
A bearish setup invalidates when a completed candle closes above:
SMT high + stored SMT ATR × 0.10.
The ATR value is stored when the SMT event appears.
This keeps the invalidation buffer linked to the volatility present when the setup was created.
A setup can also fail to produce a final signal because:
• the confirmation window expires
• displacement never appears
• the SMT candle is not broken
• required FVG evidence does not appear
• required structure evidence does not appear
• the final signal cooldown is active
• a newly accepted SMT event replaces the pending state
The directional SMT cooldown is 15 bars.
The final signal cooldown is eight bars.
A rejected, invalidated, or expired pending sequence does not print a final UP or DOWN label.
━━━━━━━━━━━━━━━━━━━━━━
📟 DASHBOARD
━━━━━━━━━━━━━━━━━━━━━━
The indicator includes a premium dashboard in the bottom-right corner of the chart.
The header displays:
trade_w_samet • SMT SNIPER
Current State
Possible states include:
• SCANNING MARKET
• BULLISH SMT DETECTED
• BEARISH SMT DETECTED
• BULLISH SETUP BUILDING
• BEARISH SETUP BUILDING
• UP SIGNAL CONFIRMED
• DOWN SIGNAL CONFIRMED
Comparison
Displays the active comparison symbol.
Correlation
Displays the current effective pair correlation.
Engine
Displays:
• STANDARD
• SNIPER
• ELITE
Pair Mode
Displays:
• AUTO
• MANUAL
Signal Score
When a relevant setup is active, the dashboard displays:
current Sniper Score / required Sniper Score.
When no setup is active, it displays:
NO ACTIVE SETUP.
UP / DOWN Counts
Displays the number of final confirmed UP and DOWN signals calculated on the loaded chart history.
Footer
Displays:
• BAR-CLOSE
• NON-REPAINT
• LIVE
The dashboard is not TradingView Strategy Tester.
It does not display:
• win rate
• profit factor
• expectancy
• drawdown
• net profit
• broker-verified results
UP and DOWN counts are signal counts only.
“LIVE” means the dashboard updates with the latest available script state.
It does not mean the script predicts unfinished intrabar outcomes.
━━━━━━━━━━━━━━━━━━━━━━
🚨 ALERT SYSTEM
━━━━━━━━━━━━━━━━━━━━━━
SMT Sniper Entry Engine includes static TradingView alert conditions for:
• Bullish SMT
• Bearish SMT
• UP
• DOWN
• Any Signal
• Any SMT
Bullish SMT
Triggers when a bullish SMT event passes the complete Base Quality and Sniper acceptance process.
Bearish SMT
Triggers when a bearish SMT event passes the mirrored acceptance process.
UP
Triggers when the bullish sequential confirmation process is complete.
DOWN
Triggers when the bearish sequential confirmation process is complete.
Any Signal
Combines final UP and DOWN conditions.
Any SMT
Combines bullish and bearish SMT conditions.
The script also includes dynamic alert() messages for final UP and DOWN signals.
Dynamic messages can include:
• product name
• direction
• chart ticker
• chart timeframe
• confirmed close price
• active comparison symbol
if enableAlerts
if buySignal
alert(
"SMT Sniper | UP | " +
syminfo.ticker +
" | " +
timeframe.period +
" | Close: " +
str.tostring(close, format.mintick) +
" | Comparison: " +
comparisonSymbol,
alert.freq_once_per_bar_close)
The DOWN dynamic message uses the mirrored format.
Dynamic final-signal alerts use once-per-bar-close frequency.
Alerts are monitoring tools.
They do not place, modify, or close broker orders.
━━━━━━━━━━━━━━━━━━━━━━
🔔 HOW TO USE ALERTS
━━━━━━━━━━━━━━━━━━━━━━
For separate static conditions:
1. Add SMT Sniper Entry Engine to the chart.
2. Open TradingView’s Create Alert window.
3. Select SMT Sniper as the condition.
4. Choose Bullish SMT, Bearish SMT, UP, DOWN, Any Signal, or Any SMT.
5. Select the desired notification method.
6. Use a confirmed-bar frequency where appropriate.
7. Test the alert before relying on it.
For one combined dynamic final-signal alert:
1. Enable Alerts in the indicator settings.
2. Open TradingView’s Create Alert window.
3. Select SMT Sniper.
4. Select Any alert() function call.
5. Configure the delivery method.
6. Test the UP and DOWN message format.
The combined dynamic alert sends final UP and DOWN events through one TradingView alert.
Static Any Signal also combines UP and DOWN conditions, but uses the static alertcondition() message.
When indicator settings, code, symbol, or timeframe are materially changed, an already-created TradingView alert can continue using the script snapshot stored when that alert was created.
Recreate alerts after important configuration changes.
Alert delivery can depend on:
• TradingView servers
• selected symbol
• selected timeframe
• market-data availability
• realtime feed status
• symbol session
• user alert configuration
• webhook or external-service availability
Creating an alert does not guarantee broker execution.
━━━━━━━━━━━━━━━━━━━━━━
🧪 HOW TO USE THE INDICATOR
━━━━━━━━━━━━━━━━━━━━━━
A practical workflow:
1. Add SMT Sniper Entry Engine to a standard candlestick chart.
2. Begin with Engine Preset set to Sniper.
3. Keep Comparison Symbol Mode on Auto for supported symbols.
4. Review the Comparison field in the dashboard.
5. If the automatic market is not appropriate, switch to Manual.
6. Select a positively related comparison market.
7. Keep Show SMT enabled while learning the setup sequence.
8. Observe the historical liquidity reference line.
9. Observe the minimal SMT marker.
10. Treat the SMT marker as context, not as the final signal.
11. Watch the dashboard state.
12. Wait for a blue UP or orange DOWN label.
13. Review the active Sniper Score and required threshold.
14. Review the correlation value.
15. Review the signal FVG box when one is available.
16. Use alerts for monitoring rather than blind execution.
17. Evaluate broader market structure independently.
18. Review session conditions, volatility, spread, and news risk.
19. Define personal entry, invalidation, stop, target, and position-size rules.
20. Test the exact symbol, timeframe, exchange, broker feed, and comparison pair personally used.
The indicator is designed for structured review.
It should not be treated as an automatic decision-maker.
━━━━━━━━━━━━━━━━━━━━━━
⚙️ SETTINGS REFERENCE
━━━━━━━━━━━━━━━━━━━━━━
The public settings menu is intentionally simplified.
Advanced thresholds remain locked inside the engine to reduce configuration clutter and preserve consistent preset behavior.
⚙️ Engine
Engine Preset
Selects:
• Standard
• Sniper
• Elite
Standard
Produces more accepted setups.
Uses Balanced Base Quality, Standard Sniper thresholds, and Reactive confirmation.
Sniper
The default profile.
Uses Strict Base Quality, Sniper context thresholds, and Confirmed evidence requirements.
Elite
The most selective profile.
Uses Elite Base Quality, Elite context thresholds, and the strictest sequential evidence requirement.
A stricter preset does not guarantee better trading results.
━━━━━━━━━━━━━━━━━━━━━━
🔗 Comparison Market
Comparison Symbol Mode
Auto
Uses the internal ticker-recognition matrix.
Manual
Uses the selected Manual Comparison Symbol.
Manual Comparison Symbol
Selects the external market used by the SMT engine.
This field is active only when Comparison Symbol Mode is Manual.
Use a positively related comparison market.
━━━━━━━━━━━━━━━━━━━━━━
🎨 Display
Show SMT
Shows or hides historical SMT reference lines and markers.
Show UP / DOWN
Shows or hides final signal labels.
UP / DOWN Label Size
Selects:
• Tiny
• Small
• Normal
• Large
• Huge
Normal is the default.
Show Signal FVG
Shows or hides the stored FVG box associated with a final signal.
Show Dashboard
Shows or hides the bottom-right premium dashboard.
━━━━━━━━━━━━━━━━━━━━━━
🔔 Alerts
Enable Alerts
Enables the script’s static alert conditions and dynamic alert() calls.
For one combined runtime UP / DOWN alert, create the TradingView alert using:
Any alert() function call.
All public input values use hidden status-line display.
Diagnostic values remain available through TradingView’s Data Window.
━━━━━━━━━━━━━━━━━━━━━━
🧠 WHAT MAKES THIS SCRIPT ORIGINAL
━━━━━━━━━━━━━━━━━━━━━━
SMT divergence, liquidity sweeps, correlation, ATR, Fair Value Gaps, and structure breaks are familiar technical-analysis concepts.
These concepts are not unique by themselves.
The originality of SMT Sniper Entry Engine lies in the coordinated process applied to them:
automatic comparison-market selection
→ closed-bar rolling liquidity references
→ one-market liquidity sweep
→ same-bar reclaim
→ ATR-normalized Base Quality Score
→ log-return pair correlation
→ external-range location
→ ATR-normalized divergence separation
→ 0–100 Sniper Score
→ preset-driven SMT acceptance
→ temporary sequential confirmation
→ displacement evidence
→ SMT-candle break
→ FVG and micro-structure evidence
→ ATR-buffered invalidation
→ setup expiration
→ permanent UP or DOWN signal
→ recent-only visual management
→ static and dynamic alerts
→ premium diagnostic dashboard
Distinctive implementation features include:
• accepting a valid sweep from either market
• using rolling closed-bar references instead of pivot confirmation
• separating the SMT event from the final signal
• calculating separate Base Quality and Sniper Scores
• requiring positive pair correlation according to preset
• using preset-specific external-range thresholds
• measuring divergence separation relative to ATR
• accumulating confirmation evidence across separate candles
• storing the SMT candle as the reaction trigger
• storing ATR at the moment the setup is armed
• using different confirmation strictness for Standard, Sniper, and Elite
• limiting historical objects without relocating signals
• providing automatic comparison-market assistance with manual override
• supporting both static and combined dynamic alerts
• exposing detailed diagnostics through the Data Window
The script is not a simple combination of unrelated indicators.
Every module supports the same objective: determining whether a closed-bar SMT divergence has enough liquidity, correlation, location, reaction, and confirmation evidence to become a permanent final signal.
━━━━━━━━━━━━━━━━━━━━━━
⚠️ IMPORTANT PRACTICAL NOTES
━━━━━━━━━━━━━━━━━━━━━━
Signal frequency depends on:
• Engine Preset
• chart symbol
• comparison symbol
• ticker naming
• timeframe
• session
• volatility
• pair correlation
• liquidity-reference structure
• sweep depth
• chart-candle quality
• external-range location
• divergence separation
• directional cooldown
• post-SMT displacement
• SMT-candle break
• FVG evidence
• micro-structure evidence
• final signal cooldown
• available history
• data provider
Standard can produce more setups.
Elite can produce substantially fewer setups.
Fewer signals do not guarantee better results.
The built-in Auto matrix uses predefined OANDA and BINANCE symbols.
The chart symbol can come from another broker or exchange.
Different feeds can produce:
• different highs and lows
• different candle closes
• different ATR values
• different liquidity sweeps
• different correlation readings
• different final signals
Manual mode can be used when comparison-feed consistency is important.
The current engine expects a positive relationship.
An inversely related comparison market should not be selected.
The dashboard’s UP and DOWN values are signal counts.
They are not wins and losses.
The Signal Score is a confluence score.
It is not historical accuracy.
The SMT marker is not the final signal.
The final UP or DOWN label appears after post-SMT confirmation.
Changing settings recalculates historical conditions.
Changing the comparison market can materially change the script’s output.
━━━━━━━━━━━━━━━━━━━━━━
⚠️ LIMITATIONS AND SHORTCOMINGS
━━━━━━━━━━━━━━━━━━━━━━
This script has important limitations:
It does not guarantee profitable trades.
It does not predict future price movement.
It does not execute orders.
It does not place broker stops.
It does not place take-profit orders.
It does not calculate position size.
It does not include spread.
It does not include commission.
It does not include slippage.
It does not include latency.
It does not model partial fills.
It does not model financing or swap.
It does not evaluate order-book conditions.
It does not evaluate news risk.
It uses bar-based OHLC data.
It does not reconstruct exact intrabar price sequence.
It assumes a positive comparison relationship.
Its automatic matrix cannot recognize every broker symbol.
Unsupported Auto symbols can use the Manual Comparison fallback.
Correlation can change over time.
A historically correlated pair can temporarily decouple.
A confirmed SMT divergence can fail.
A displacement candle can be followed by reversal.
An FVG can be filled immediately.
A micro-structure break can become a false break.
A high Base Quality Score can still fail.
A high Sniper Score can still fail.
The Signal Score is not a win probability.
The dashboard is not TradingView Strategy Tester.
Signal counts are not audited account performance.
The script does not provide verified profitability statistics.
The script does not provide broker-verified trade outcomes.
Alert delivery depends on TradingView and user configuration.
Changing settings changes historical calculations.
Changing symbol, exchange, session, timeframe, or feed can change signals.
Available history can affect rolling calculations.
Permanent final signals wait for candle close.
The final label can therefore appear later than a discretionary intrabar entry.
For these reasons, the indicator should be used as an educational decision-support tool, not as a standalone automated strategy.
━━━━━━━━━━━━━━━━━━━━━━
👤 WHO THIS SCRIPT MAY BE USEFUL FOR
━━━━━━━━━━━━━━━━━━━━━━
This script may be useful for traders who:
• understand basic SMT divergence
• compare positively related markets
• study liquidity sweeps and reclaims
• want more context than a raw SMT marker
• prefer confirmed-close signals
• want selective preset modes
• use displacement as confirmation
• use Fair Value Gap concepts
• use micro-structure breaks
• want automatic comparison-market assistance
• want a manual comparison override
• want transparent quality scoring
• want a compact public settings menu
• want a premium dashboard
• want separate SMT and final-signal alerts
• want one combined UP / DOWN dynamic alert
• want Data Window diagnostics
It may be less suitable for users who:
• want guaranteed signals
• want every raw SMT divergence displayed
• want a fully automated trading bot
• want built-in TP and SL management
• want verified Strategy Tester performance
• want inverse-correlation SMT analysis
• expect one comparison pair to work on every feed
• require tick-level execution modeling
• want signals before candle close
• expect a score to equal probability
• want the indicator to replace personal judgment
• expect alerts to execute broker orders automatically
━━━━━━━━━━━━━━━━━━━━━━
🧭 BEST PRACTICE SUGGESTIONS
━━━━━━━━━━━━━━━━━━━━━━
For the default selective profile:
• use standard candlesticks
• begin with Sniper preset
• keep Auto mode only when the dashboard comparison is appropriate
• use Manual mode for broker-specific comparison control
• select positively related markets
• keep Show SMT enabled while learning
• distinguish the SMT marker from the final signal
• wait for the final UP or DOWN label
• review the correlation value
• review the active Signal Score
• review external market structure independently
• consider session liquidity and volatility
• use personal stop placement
• use personal target planning
• use personal position sizing
• test alerts before depending on them
• test the exact symbol and timeframe personally used
For additional frequency:
• use Standard preset
Standard reduces:
• Base Quality requirements
• correlation requirements
• range-location restrictions
• divergence-separation requirements
• Sniper Score threshold
• final confirmation evidence
For additional selectivity:
• use Elite preset
Elite increases:
• minimum sweep depth
• rejection-close requirement
• minimum range expansion
• Base Quality threshold
• correlation threshold
• external-range restriction
• divergence-separation threshold
• Sniper Score threshold
• final evidence requirement
Always:
• wait for the candle to close
• verify the active comparison symbol
• use the SMT marker as context
• use the final signal as confirmation
• review broader structure independently
• review personal risk before any trade
• treat alerts as monitoring tools
• remember that every confirmed setup can fail
━━━━━━━━━━━━━━━━━━━━━━
🔓 PUBLICATION NOTE
━━━━━━━━━━━━━━━━━━━━━━
SMT Sniper Entry Engine is published as an educational correlated-market divergence and confirmation tool.
The purpose of this description is to explain:
• how the comparison market is selected
• how Auto and Manual modes differ
• which markets are included in the automatic comparison matrix
• how closed-bar liquidity references are calculated
• how a one-market sweep is identified
• how reclaim validation works
• how sweep depth is normalized by ATR
• how chart-candle direction and rejection quality are evaluated
• how the Base Quality Score is constructed
• how pair correlation is calculated and filtered
• how external-range location is evaluated
• how divergence separation is measured
• how the Sniper Score is constructed
• how Standard, Sniper, and Elite differ
• how a qualified SMT event arms the confirmation engine
• how the temporary confirmation window works
• how evidence is accumulated across separate closed candles
• how displacement is detected
• how the SMT-candle break is used
• how Fair Value Gap evidence is detected
• how micro-structure evidence is detected
• how setup invalidation works
• how setup expiration works
• when final UP and DOWN labels appear
• what the SMT markers and dotted reference lines represent
• what the signal FVG box represents
• what the dashboard displays
• what the static alerts contain
• how “Any alert() function call” works
• what diagnostic values are available in the Data Window
• how confirmed-close timing works
• what the engine does not simulate
• why familiar SMT concepts are organized into an original workflow
The script is designed to support structured analysis.
It does not promise profitable results.
It does not remove market risk.
It does not execute trades.
It does not calculate position size.
It does not provide a built-in TP / SL trade-management model.
It should not be used as a blind UP / DOWN system.
Repainting and Timing Disclosure
SMT Sniper Entry Engine is designed around confirmed-bar calculations.
Permanent SMT events and final UP / DOWN labels use barstate.isconfirmed.
The comparison-market request uses:
• barmerge.gaps_off
• barmerge.lookahead_off
Liquidity references use previous closed candles.
The current candle is excluded from the prior-reference calculation.
The script does not use:
• pivot-high functions
• pivot-low functions
• future-bar confirmation
• negative plot offsets
• historical signal backplotting
• later relocation of final signal labels
A final UP or DOWN signal appears on the candle where the complete confirmation sequence becomes valid.
It is not moved backward to the original SMT candle.
Historical drawing cleanup can delete older lines, markers, labels, or boxes when the recent-object limit is exceeded.
Deleting an old drawing is not repainting.
The original signal bar is not changed.
Historical results can still differ when:
• settings are changed
• comparison symbols are changed
• Auto or Manual mode is changed
• chart symbols are changed
• timeframes are changed
• broker or exchange feeds are changed
• historical data is revised
• available chart history is changed
Realtime behavior also depends on when TradingView receives the final data for the closing candle.
Confirmed-close design reduces unfinished-candle changes.
It does not eliminate market risk, data-feed differences, or alert-delivery limitations.
━━━━━━━━━━━━━━━━━━━━━━
🛡️ DISCLAIMER
━━━━━━━━━━━━━━━━━━━━━━
SMT Sniper Entry Engine is provided for educational and informational purposes only.
It does not constitute financial, investment, trading, legal, or tax advice.
No indicator can guarantee future results.
Markets are uncertain.
Correlation changes.
Liquidity changes.
Volatility changes.
Market structure changes.
Historical chart behavior does not ensure future performance.
Every user is responsible for their own:
• analysis
• validation
• comparison-market selection
• execution planning
• stop placement
• target planning
• position sizing
• risk management
• alert configuration
• trading decisions
• broker execution
• legal obligations
• tax obligations
The liquidity references, SMT markers, dotted lines, Base Quality Scores, Sniper Scores, correlation values, external-range filters, divergence-separation values, displacement conditions, Fair Value Gap boxes, micro-structure conditions, UP labels, DOWN labels, dashboard states, Data Window values, signal counts, and alerts are visual analysis tools only.
The SMT marker is not a guaranteed reversal.
The UP label is not a guaranteed profitable long trade.
The DOWN label is not a guaranteed profitable short trade.
The Signal Score is not a win probability.
The Base Quality Score is not a probability.
The correlation reading is not a guarantee that two markets will continue moving together.
The automatic comparison symbol is not guaranteed to be suitable for every broker feed.
The FVG box is not a guaranteed support or resistance zone.
The micro-structure break is not a guarantee of continuation.
The final signal-bar close is not a guaranteed fill.
The script does not include spread, commission, slippage, latency, financing, contract specifications, order rejection, partial fills, or broker-specific execution behavior.
Use this script as a structured SMT divergence-review and confirmation framework, not as a promise of profitability or a substitute for independent judgment.
Indikator
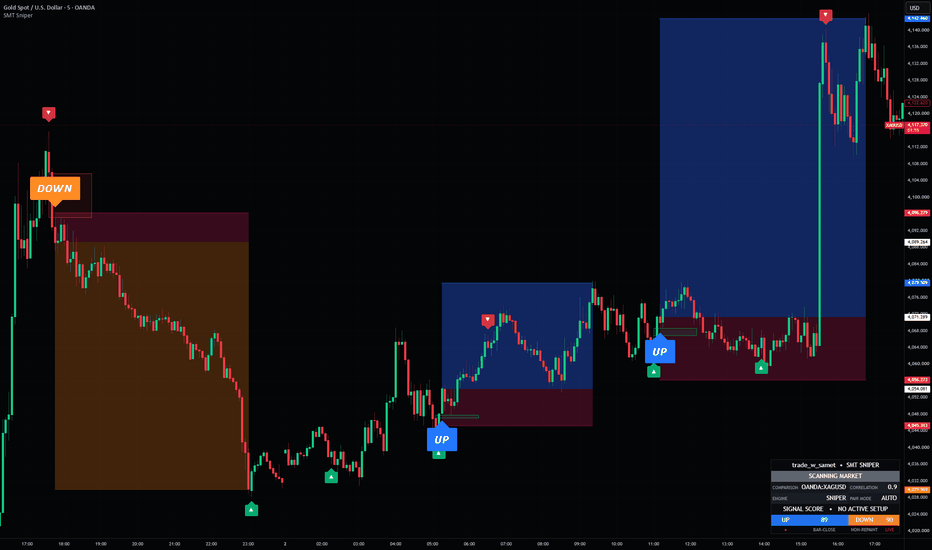
GCM Hybrid CPR MatrixDescription:
Title: GCM Hybrid CPR Matrix
“Not a sheep in the herd; but a Lion in the Matrix.”
- by uniGram.
Overview:
To be a lion in the matrix means seeing the market structure with absolute clarity while the rest of the herd gets lost in the noise. The GCM Hybrid CPR Matrix is not just another pivot script; it is an institutional-grade, algorithmic architecture designed for traders who demand precision. By unifying multiple historical pivot methodologies into a single, clean workspace, this indicator strips away chart clutter and delivers actionable structural data. It empowers you to anticipate liquidity sweeps, breakouts, and reversals with the confidence of an apex predator.
Core Architecture & Features:
• list]Unified Master Pivot System: Overlapping "P" lines from different methodologies are historically a source of visual confusion. This script strips them out entirely, anchoring Traditional, Camarilla, and Fibonacci levels seamlessly to one Master Central Pivot.
Logical Executor CPR Engine: Operates on a strict mathematical executor that absolutely prevents the standard top/bottom (TC/BC) inversion seen in basic CPR formulas, ensuring your daily zones are plotted flawlessly.
• Institutional Visual Safety: Custom color opacities are strictly locked between 60% and 70%. This ensures that your technical levels provide immense data without ever obscuring the actual price action and candlesticks.
• Seamless Session Projection: Built with advanced object-based drawing logic (Pine Script v6). The CPR ribbons and pivot lines project seamlessly across the entire daily session without visual breaks, gaps, or mid-chart termination.
• Native RSI Divergence Engine: Automatically scans and plots Regular and Hidden divergence (Bullish/Bearish) directly on the chart using dynamic lookback limits, providing instant structural confirmation.
How to Trade with the GCM HCM:
• The CPR Value Area: Use the space between the TC (Top Central) and BC (Bottom Central) as your primary value zone. Price opening above the TC signals bullish dominance, while opening below the BC indicates bearish control. A wide CPR suggests a ranging market, whereas a narrow CPR forecasts a high-probability trend day.
• Pivot Confluence: Look for overlapping zones. When a Camarilla resistance (e.g., R3) aligns perfectly with a Fibonacci or Traditional level, that specific price point becomes a high-probability institutional supply/demand zone.
• Divergence Confirmation: Never trade divergence in isolation. Use the native RSI Divergence signals at key GCM HCM levels (like a Regular Bullish signal printing exactly on Traditional S2) for high-conviction sniper entries.
Disclaimer & Risk Warning:
The GCM Hybrid CPR Matrix is an analytical tool provided for educational and informational purposes only. It does not constitute financial or investment advice. Trading in financial markets, including the use of Smart Money Concepts (SMC) and algorithmic pivot strategies, carries a high level of risk and may not be suitable for all investors. Past performance of any trading system or methodology is not indicative of future results. Always conduct your own research, use strict risk management, and consult with a certified financial advisor before deploying real capital.
HAPPY TRADING
- by uniGram.
-----------------------------------------------------------------------------------------------------------
Kannada Version (ಕನ್ನಡ ವಿಭಾಗ)
Title: GCM ಹೈಬ್ರಿಡ್ CPR ಮ್ಯಾಟ್ರಿಕ್ಸ್
“ಮಾರುಕಟ್ಟೆಯ ಮಂದೆಯಲ್ಲಿ ಕುರಿಯಲ್ಲ; ಮ್ಯಾಟ್ರಿಕ್ಸ್ನ ಸಿಂಹ.”
- by uniGram.
Overview:
ಮ್ಯಾಟ್ರಿಕ್ಸ್ನಲ್ಲಿ ಸಿಂಹವಾಗಿರುವುದು ಎಂದರೆ, ಉಳಿದ ಮಂದೆ ಗೊಂದಲದಲ್ಲಿರುವಾಗ ಮಾರುಕಟ್ಟೆಯ ದಿಕ್ಕನ್ನು ಸಂಪೂರ್ಣ ಸ್ಪಷ್ಟತೆಯೊಂದಿಗೆ ನೋಡುವುದು. GCM ಹೈಬ್ರಿಡ್ CPR ಮ್ಯಾಟ್ರಿಕ್ಸ್ ಕೇವಲ ಒಂದು ಸಾಧಾರಣ ಪಿವೋಟ್ ಸ್ಕ್ರಿಪ್ಟ್ ಅಲ್ಲ; ಇದು ನಿಖರತೆಯನ್ನು ಬಯಸುವ ವೃತ್ತಿಪರ ಟ್ರೇಡರ್ಗಳಿಗಾಗಿ ವಿನ್ಯಾಸಗೊಳಿಸಲಾದ ಸಾಂಸ್ಥಿಕ-ಮಟ್ಟದ (Institutional-grade) ಟೂಲ್. ಬೇರೆ ಬೇರೆ ಪಿವೋಟ್ ವಿಧಾನಗಳನ್ನು ಒಂದೇ ವೇದಿಕೆಯಲ್ಲಿ ತರುವ ಮೂಲಕ, ಇದು ಚಾರ್ಟ್ ಮೇಲಿನ ಅನಗತ್ಯ ಗೊಂದಲಗಳನ್ನು ನಿವಾರಿಸುತ್ತದೆ. ಮಾರುಕಟ್ಟೆಯ ಬ್ರೇಕ್ಔಟ್ ಮತ್ತು ರಿವರ್ಸಲ್ಗಳನ್ನು ಅತ್ಯಂತ ಆತ್ಮವಿಶ್ವಾಸದಿಂದ ಗ್ರಹಿಸಲು ಇದು ನಿಮಗೆ ಸಹಾಯ ಮಾಡುತ್ತದೆ.
Core Architecture & Features:
• ಏಕೀಕೃತ ಮಾಸ್ಟರ್ ಪಿವೋಟ್ ವ್ಯವಸ್ಥೆ (Unified Master Pivot): ಟ್ರೆಡಿಷನಲ್, ಕ್ಯಾಮರಿಲ್ಲಾ ಮತ್ತು ಫಿಬೊನಾಚಿ ವಿಧಾನಗಳ ಬೇರೆ ಬೇರೆ 'P' ಲೈನ್ಗಳು ಒಂದರ ಮೇಲೊಂದು ಬಂದು ಗೊಂದಲ ಸೃಷ್ಟಿಸುವುದನ್ನು ತಡೆಗಟ್ಟಲಾಗಿದೆ. ಎಲ್ಲವನ್ನೂ ಒಂದೇ 'ಮಾಸ್ಟರ್ ಸೆಂಟ್ರಲ್ ಪಿವೋಟ್' ಲೈನ್ಗೆ ಹೊಂದಿಸಲಾಗಿದೆ.
• ಲಾಜಿಕಲ್ ಎಕ್ಸಿಕ್ಯೂಟರ್ CPR ಇಂಜಿನ್: ಸಾಧಾರಣ CPR ಲೆಕ್ಕಾಚಾರದಲ್ಲಿ ಆಗುವ TC ಮತ್ತು BC ಲೈನ್ಗಳ ಅದಲು-ಬದಲಾಗುವಿಕೆಯನ್ನು (inversion) ಈ ಲಾಜಿಕಲ್ ಎಕ್ಸಿಕ್ಯೂಟರ್ ಕಟ್ಟುನಿಟ್ಟಾಗಿ ತಡೆಯುತ್ತದೆ. ನಿಮ್ಮ CPR ವಲಯಗಳು ಯಾವಾಗಲೂ ಸರಿಯಾಗಿರುತ್ತವೆ.
• ಕಣ್ಣಿಗೆ ತ್ರಾಸಾಗದ ವಿನ್ಯಾಸ (Visual Safety): ಲೈನ್ಗಳ ಟ್ರಾನ್ಸ್ಪರೆನ್ಸಿಯನ್ನು 60% ರಿಂದ 70% ಗೆ ಲಾಕ್ ಮಾಡಲಾಗಿದೆ. ಇದರಿಂದ ಪಿವೋಟ್ ಲೈನ್ಗಳ ಹಿಂದಿರುವ ಕ್ಯಾಂಡಲ್ಗಳು ಮತ್ತು ಪ್ರೈಸ್ ಆಕ್ಷನ್ ನಿಮಗೆ ಸ್ಪಷ್ಟವಾಗಿ ಕಾಣುತ್ತದೆ.
• ಸೀಮ್ಲೆಸ್ ಸೆಶನ್ ಪ್ರೊಜೆಕ್ಷನ್: ಅತ್ಯಾಧುನಿಕ 'ಆಬ್ಜೆಕ್ಟ್-ಬೇಸ್ಡ್' ಕೋಡಿಂಗ್ ಬಳಸಿರುವುದರಿಂದ, ಹಳೆಯ ಮತ್ತು ಹೊಸ ಸೆಶನ್ ನಡುವೆ ಯಾವುದೇ ಗ್ಯಾಪ್ ಇಲ್ಲದಂತೆ CPR ಲೈನ್ಗಳು ದಿನವಿಡೀ ಚಾರ್ಟ್ ಮೇಲೆ ಪೂರ್ಣವಾಗಿ ಚಾಚಿಕೊಂಡಿರುತ್ತವೆ.
• ನೇಟಿವ್ RSI ಡೈವರ್ಜೆನ್ಸ್: ಚಾರ್ಟ್ನ ಮೇಲೆಯೇ ರೆಗ್ಯುಲರ್ ಮತ್ತು ಹಿಡನ್ ಡೈವರ್ಜೆನ್ಸ್ಗಳನ್ನು (Bullish/Bearish) ಸ್ವಯಂಚಾಲಿತವಾಗಿ ಗುರುತಿಸಿ ನಿಖರವಾದ ಸಿಗ್ನಲ್ ನೀಡುತ್ತದೆ.
How to Trade with the GCM HCM:
• CPR ವ್ಯಾಲ್ಯೂ ಏರಿಯಾ: TC ಮತ್ತು BC ನಡುವಿನ ಜಾಗವನ್ನು ನಿಮ್ಮ ಪ್ರಮುಖ ವಲಯವಾಗಿ ಬಳಸಿ. ಬೆಲೆಯು (Price) TC ಗಿಂತ ಮೇಲೆ ಓಪನ್ ಆದರೆ ಅದು ಬುಲ್ಲಿಷ್ ಟ್ರೆಂಡ್, BC ಗಿಂತ ಕೆಳಗೆ ಓಪನ್ ಆದರೆ ಬೇರಿಷ್ ಟ್ರೆಂಡ್ ಅನ್ನು ಸೂಚಿಸುತ್ತದೆ. CPR ಅಗಲವಾಗಿದ್ದರೆ ಮಾರ್ಕೆಟ್ ರೇಂಜ್ನಲ್ಲಿರುತ್ತದೆ, ಮತ್ತು ಕಿರಿದಾಗಿದ್ದರೆ (Narrow CPR) ದೊಡ್ಡ ಟ್ರೆಂಡ್ ಬರುವ ಸಾಧ್ಯತೆ ಇರುತ್ತದೆ.
• ಪಿವೋಟ್ ಕಾನ್ಫ್ಲುಯೆನ್ಸ್ (Confluence): ಒಂದೇ ಬೆಲೆಯ ಬಳಿ ಎರಡು ಲೈನ್ಗಳು ಬರುವುದನ್ನು ಗಮನಿಸಿ. ಉದಾಹರಣೆಗೆ, ಕ್ಯಾಮರಿಲ್ಲಾ R3 ಮತ್ತು ಫಿಬೊನಾಚಿ ರೆಸಿಸ್ಟೆನ್ಸ್ ಒಂದೇ ಹಂತದಲ್ಲಿ ಬಂದರೆ, ಆ ಜಾಗವು ಅತ್ಯಂತ ಬಲವಾದ ಸಪ್ಲೈ/ಡಿಮ್ಯಾಂಡ್ ವಲಯವಾಗಿ ಕೆಲಸ ಮಾಡುತ್ತದೆ.
• ಡೈವರ್ಜೆನ್ಸ್ ಕನ್ಫರ್ಮೇಷನ್: ಕೇವಲ ಡೈವರ್ಜೆನ್ಸ್ ನೋಡಿ ಟ್ರೇಡ್ ಮಾಡಬೇಡಿ. GCM HCM ನ ಪ್ರಮುಖ ಲೆವೆಲ್ಗಳ ಬಳಿ (ಉದಾಹರಣೆಗೆ, ಟ್ರೆಡಿಷನಲ್ S2 ಬಳಿ Regular Bullish ಸಿಗ್ನಲ್) ಡೈವರ್ಜೆನ್ಸ್ ಬಂದರೆ, ಅದು ಅತ್ಯಂತ ನಿಖರವಾದ ಎಂಟ್ರಿಗೆ (Sniper entry) ಅವಕಾಶ ನೀಡುತ್ತದೆ.
Disclaimer & Risk Warning:
GCM ಹೈಬ್ರಿಡ್ CPR ಮ್ಯಾಟ್ರಿಕ್ಸ್ ಕೇವಲ ಶೈಕ್ಷಣಿಕ ಮತ್ತು ಮಾಹಿತಿ ಉದ್ದೇಶಗಳಿಗಾಗಿ ಒದಗಿಸಲಾದ ಟೆಕ್ನಿಕಲ್ ಟೂಲ್ ಆಗಿದೆ. ಇದು ಯಾವುದೇ ರೀತಿಯ ಹಣಕಾಸು ಅಥವಾ ಹೂಡಿಕೆ ಸಲಹೆಯಲ್ಲ. ಆಲ್ಗೋರಿಥಮಿಕ್ ಪಿವೋಟ್ ತಂತ್ರಗಳು ಮತ್ತು ಸ್ಮಾರ್ಟ್ ಮನಿ ಕಾನ್ಸೆಪ್ಟ್ (SMC) ಸೇರಿದಂತೆ ಹಣಕಾಸು ಮಾರುಕಟ್ಟೆಗಳಲ್ಲಿ ಟ್ರೇಡ್ ಮಾಡುವುದು ಹೆಚ್ಚಿನ ಅಪಾಯವನ್ನು ಹೊಂದಿರುತ್ತದೆ. ಇದು ಎಲ್ಲರಿಗೂ ಸೂಕ್ತವಾಗಿರುವುದಿಲ್ಲ. ರಿಯಲ್ ಫಂಡ್ಸ್ ಬಳಸುವ ಮುನ್ನ ಸ್ವಂತ ವಿಶ್ಲೇಷಣೆ ಮಾಡಿ, ಕಟ್ಟುನಿಟ್ಟಾದ ರಿಸ್ಕ್ ಮ್ಯಾನೇಜ್ಮೆಂಟ್ ಪಾಲಿಸಿ, ಮತ್ತು ವೃತ್ತಿಪರ ಆರ್ಥಿಕ ಸಲಹೆಗಾರರನ್ನು ಸಂಪರ್ಕಿಸಿ.
HAPPY TRADING
- by uniGram. Indikator

Optimal Trade Entry + Silver Bullet [Quantum Algo]Optimal Trade Entry + Silver Bullet
====================================================
🔶 OVERVIEW
Optimal Trade Entry + Silver Bullet is an automated ICT-style Fibonacci retracement engine that combines the Optimal Trade Entry (OTE) concept with the three Silver Bullet time windows. The indicator confirms market structure through swing highs and swing lows, detects a break of structure, automatically anchors a Fibonacci grid to the impulse leg, and highlights the 61.8% to 79% retracement zone — the Optimal Trade Entry zone — as a gradient that intensifies toward the 70.5% sweet spot. Every zone tap is graded with a transparent confluence score built from time-of-day windows, fair value gaps, and liquidity sweeps.
The goal is simple: remove the two biggest sources of error in discretionary Optimal Trade Entry trading — anchoring the Fibonacci retracement to the wrong leg, and taking entries outside the hours when the model statistically performs.
🔶 WHAT IS THE OPTIMAL TRADE ENTRY ZONE?
The Optimal Trade Entry is a smart money concept describing the discount (in an uptrend) or premium (in a downtrend) portion of an impulse leg where institutional participants typically complete their entries after a trend has been confirmed. It is defined as the area between the 61.8% and 79% Fibonacci retracement of the most recent impulse, with the 70.5% level acting as the statistical sweet spot. Price retracing into this zone after a break of structure offers a defined-risk entry: the stop belongs beyond the origin of the leg, and the targets project into the extension levels beyond the impulse extreme.
🔶 WHAT ARE THE SILVER BULLET WINDOWS?
The Silver Bullet model restricts trading to three specific one-hour windows in New York time, when algorithmic price delivery is most likely to seek liquidity and fill fair value gaps:
- London Open window — 03:00 to 04:00
- New York Morning window — 10:00 to 11:00
- New York Afternoon window — 14:00 to 15:00
This indicator shades each window on intraday charts, labels the window open, and treats window activity as a scoring input: an Optimal Trade Entry tap that occurs inside an active window grades higher than one that occurs outside it.
🔶 WHY THIS SCRIPT IS ORIGINAL
1. Pivot-and-shift automatic anchoring. The Fibonacci grid is never drawn from arbitrary pivots and never requires manual anchoring. It appears only after price closes through a confirmed swing point — a genuine break of structure — and anchors to the true origin of the impulse leg.
2. Dynamic leg stretching. While the trend continues printing new highs or new lows, the grid stretches with the market in real time, so the retracement zone is always measured against the current, mathematically complete leg — not a stale one.
3. Time-based signal qualification. The Silver Bullet windows are not decorative background shading. They are wired directly into the signal engine and the grading model, which is what separates this tool from a standard Fibonacci retracement indicator.
4. Transparent confluence grading. Every signal receives a grade of A+, A, B, or C based on four observable, verifiable conditions: entry zone tap, active Silver Bullet window, directional fair value gap formed inside a window on the current leg, and a liquidity sweep at the leg origin (the anchor pivot running the stops beyond the pivot before it). Nothing is hidden, nothing is repainted, and nothing is curve-fit.
🔶 HOW IT WORKS
Market structure engine: Swing highs and swing lows are confirmed with a symmetric pivot lookback. A candle close above the last confirmed swing high shifts the engine bullish; a close below the last confirmed swing low shifts it bearish. All signals are evaluated on closed bars only, so entries do not repaint.
Fibonacci retracement grid: On each break of structure the impulse leg is measured from the anchor pivot to the running extreme. The script plots the origin (1.0), equilibrium (0.5), the entry zone borders (0.618 and 0.79), the sweet spot (0.705, dotted), the impulse extreme (0.0), and two target extensions (default -0.27 and -0.62).
Entry zone gradient: The zone between 0.618 and 0.79 renders as four stacked slices whose opacity increases toward the 0.705 sweet spot, giving an immediate visual read of where the highest-probability fill sits.
Fair value gap engine: Three-candle imbalances that clear a minimum size threshold (measured against average true range) are boxed on the chart. By default only gaps forming inside an active Silver Bullet window are drawn, and every gap grays out automatically once price mitigates it, keeping the chart clean.
Liquidity sweep detection: When the anchor pivot of a new leg trades through the pivot before it — sell-side liquidity taken before a bullish leg, or buy-side liquidity taken before a bearish leg — the setup is flagged as a sweep and grades higher.
Trade plan projection: When price taps the entry zone and passes the active filters, the script prints a graded signal marker plus Entry, Stop (beyond the leg origin with an average-true-range buffer), Target One, and Target Two, each labeled with its exact price.
Dashboard: A compact panel tracks directional bias, live retracement percentage, entry zone status, sweet spot price, the active Silver Bullet window, fair value gap confluence count, and liquidity sweep status at a glance.
🔶 HOW TO USE IT
1. Apply the indicator to an intraday chart. One-minute to fifteen-minute timeframes suit the Silver Bullet windows best; the Fibonacci engine itself works on any timeframe.
2. Wait for the dashboard bias to flip after a break of structure.
3. Let price retrace. The dashboard shows the live retracement percentage as price approaches the Optimal Trade Entry zone.
4. The strongest setups tap the gradient inside an active Silver Bullet window after a liquidity sweep, with a fair value gap in the direction of the leg — that is the A+ profile.
5. Use the printed Entry, Stop, and Target levels as reference geometry, then apply your own position sizing and risk management.
6. Tighten or relax the engine with the two signal filters: Require Active Silver Bullet Window and Require Fair Value Gap Confluence.
🔶 SETTINGS
- Swing Detection Length — pivot lookback controlling structure size; higher values track larger legs.
- Completed Setups To Keep, Fair Value Gaps To Keep, Trade Plans To Keep — cap how many historical drawings remain, so the chart stays clean and the auto-scale stays anchored to current price.
- Independent toggles for each Silver Bullet window, the Fibonacci grid, the zone gradient, equilibrium, targets, and the dashboard.
- Fully customizable colors and dashboard position.
🔶 ALERTS
- Bullish Optimal Trade Entry — price tapped the bullish zone and passed the active filters.
- Bearish Optimal Trade Entry — price tapped the bearish zone and passed the active filters.
- Silver Bullet Window Opened — one of the three windows just began.
🔶 FREQUENTLY ASKED QUESTIONS
Does the indicator repaint? Entries are evaluated on closed bars only. Swing pivots require confirmation by design, which introduces intentional lag but keeps historical signals fixed.
Which markets does it work on? Any symbol with candle data — cryptocurrency, forex, gold, indices, stocks, and futures. The Silver Bullet windows reference New York time regardless of your chart timezone.
Which timeframe is best? The Silver Bullet windows require an intraday chart (sixty minutes or below). The one-minute to fifteen-minute range is the classic application; the Optimal Trade Entry engine alone also functions on higher timeframes.
What does the grade mean? It is a count of observable confluences (zone tap, window, gap, sweep) — a transparency tool, not a win-rate prediction.
🔶 LIMITATIONS
Pivot confirmation is intentionally delayed by the swing length, so the engine describes confirmed structure rather than predicting it. Retracements can exceed the zone and invalidate the leg during strong counter-moves. Grades measure confluence, not probability of profit. No indicator replaces independent analysis.
🔶 DISCLAIMER
This script is provided strictly for educational and informational purposes. It is not financial advice, an investment recommendation, or a solicitation to buy or sell any financial instrument. Past behavior of any level, time window, or signal does not guarantee future results. Trading involves substantial risk. Always do your own research and manage risk independently. Indikator

All Session Levels (Futures) - Asia, London, Overnight, NY PriorA session-levels built for trading during the New York session on the Micro Dow (MYM), though it works on any index future or intraday symbol. The core idea: the Asia and London sessions are thin and choppy on the Dow because the underlying US cash market is closed; rather than trading those sessions directly, this indicator plots the key levels they leave behind and helps you trade them when real volume arrives at the 9:30 ET open.
What it plots
Asia session high/low (default 8:00 PM–2:00 AM ET) — overnight liquidity pools.
London session high/low (default 3:00 AM–8:00 AM ET) — the more recent, more relevant overnight range.
Overnight high/low (ONH/ONL) — the full overnight range.
Prior day NY high/low/close — the most-watched daily references, drawn per-day so they don't stretch across chart history.
9:30 NY open marker and a shaded 9:30–10:30 killzone highlighting the highest-probability window.
Auto-detected supply and demand zones — the script identifies base-then-impulse departures (a tight consolidation candle followed by a strong directional move) and draws the base as a zone. Zones remain on the chart only until mitigated: once price closes fully back through a zone, it's automatically removed, so you only ever see live, untested zones.
Info dashboard (top-right) listing every current level and its price.
Alerts
Eight built-in alert conditions: level breaks (London, Asia, and overnight highs/lows) and zone taps (when price enters the most recent unmitigated demand or supply zone). Create them via the alarm-clock icon after adding the indicator; "Once Per Bar Close" is recommended for the break alerts.
How to use it
Set your chart timezone to America/New York (or adjust the timezone input to match your data feed).
Run it on an intraday timeframe, 3m to 15m is the sweet spot; 5m is a good all-round default.
Before the open, review the plotted overnight and prior-day levels.
In the 9:30–10:30 window, watch for price interacting with those levels: a clean break-and-hold for continuation, or a failed break that snaps back inside the range for a reversal.
Use the confluence of a zone tap, price extended past VWAP, and volume for entry confirmation.
Notes and settings
All session windows are fully adjustable in the settings, as are colors, and the supply/demand sensitivity (impulse strength, base size, lookback, and max zones per side).
The overnight window contains the Asia and London windows by design, so ONH/ONL will often overlap those extremes — toggle it off if you prefer less overlap.
The zone-tap alerts track only the most recent unmitigated zone on each side to avoid alert spam.
Disclaimer
This is an analysis and charting tool, not a trading system or financial advice. It does not generate buy/sell signals or guarantee any outcome. Levels and zones are calculated from historical price and session times; past behavior does not predict future results. Always do your own analysis and manage your own risk. Indikator

Liquidity Sweep Ledger [EmpArchitect]█ OVERVIEW
Liquidity Sweep Ledger maps buy-side and sell-side liquidity levels, then tracks what happened after those levels were swept.
Most liquidity tools mark the sweep and stop there.
This script keeps a simple ledger:
• Liquidity level active
• BSL / SSL swept
• Reclaimed or not reclaimed
• Displacement after sweep
• Structure shift after sweep
• No follow-through
• Dual sweep / ambiguous sweep
It is a structure-context tool. It does not provide entries, stop losses, targets, risk/reward, probability scores, or trade signals.
█ WHAT IT MAPS
Buy-side liquidity — BSL:
A level above price formed from confirmed swing highs, equal-high clusters, previous day high, or previous week high.
Sell-side liquidity — SSL:
A level below price formed from confirmed swing lows, equal-low clusters, previous day low, or previous week low.
When price sweeps one or more levels, the script records the sweep and tracks its lifecycle.
█ HOW IT WORKS
The script uses confirmed pivots only. A swing high or swing low becomes an active liquidity level only after the pivot is confirmed.
Sweep detection uses an ATR-scaled penetration buffer. Price must trade beyond the liquidity level by the selected minimum threshold before the level is marked as swept.
If several same-side levels are swept on one candle, the script aggregates them into one event, such as BSL swept x2 or SSL swept x3.
After a sweep, the script tracks whether price reclaims the level within the selected reclaim window.
For post-sweep response, the script checks for directional displacement using body size relative to ATR and body size relative to candle range.
For structure shift, the script freezes the latest confirmed opposite-side internal pivot at the time of the sweep and then checks whether price closes beyond that reference later.
Same-candle or sequential two-sided sweeps are marked as dual / ambiguous instead of being treated as directional events.
█ SWEEP LIFECYCLE
The script separates the sweep from the response.
A sweep can become:
• Pending reclaim
• Reclaimed
• Taken / no reclaim
• Displaced
• Structure shifted
• No follow-through
• Dual sweep / ambiguous
This matters because not every liquidity sweep produces the same response. Some levels are swept and reclaimed. Some are taken without reclaim. Some lead to displacement. Some produce no follow-through.
The script records the state instead of forcing a directional interpretation.
█ LIQUIDITY SOURCES
Included sources:
• Swing high / swing low liquidity
• Equal-high / equal-low clustering
• Previous day high / previous day low
• Previous week high / previous week low
Default source settings:
• Swing liquidity: ON
• Equal-high / equal-low clustering: ON
• Previous day high/low: ON
• Previous week high/low: OFF
Previous week high/low is included but disabled by default. Review it on your market/timeframe before enabling it.
█ DASHBOARD AND LEDGER
The dashboard shows the current liquidity-sweep ledger:
• Last sweep
• Source
• Reclaim state
• Response state
• Age
• Active BSL count
• Active SSL count
• Compact last-sweeps ledger
The ledger is the main feature. It helps review what happened after liquidity was taken.
Response detail is recorded in the ledger and dashboard. On-chart response labels are optional and are off by default to keep the chart clean.
█ ALERTS
Included context alerts:
• BSL swept
• SSL swept
• Dual sweep
• Reclaimed
• Displaced
• Structure shift
• Taken / no reclaim
• No follow-through
Alerts are structure-context alerts only. They are not trade signals.
█ TESTING NOTES
Tested during development on BTCUSDT 1H and XAUUSD 1H.
Other markets and timeframes may require adjustment of pivot length, ATR penetration, reclaim window, and response settings.
█ PAIRS WITH
Smart Liquidity Map — broader liquidity map: EQH/EQL zones, PDH/PDL, and PWH/PWL reference levels.
Liquidity Sweep Ledger focuses on the next step: once liquidity is swept, did price reclaim, displace, shift structure, or fail to follow through?
█ IMPORTANT LIMITATIONS
• A liquidity sweep is not a trade entry.
• A reclaim is not a trade signal.
• Displacement does not guarantee continuation.
• Structure shift is a mapped event, not a recommendation.
• Results depend on pivot length, ATR settings, market, and timeframe.
• The script is designed for chart review, not automated trading.
█ NOTES
• Pine Script v6
• Public and open-source
• Built by EmpArchitect
• Educational structure-context tool only
• Not financial advice
• Not a signal service
█ CORE IDEA
Liquidity Sweep Ledger maps liquidity sweeps and tracks whether price reclaimed, displaced, shifted structure, or produced no follow-through.
It gives the map.
The trader makes the decision. Indikator

FVG + Order Block Toolkit [ForexCracked]🔷 OVERVIEW
Two of the most-watched smart money footprints on one clean chart. This toolkit auto-draws Fair Value Gaps and Order Blocks as zones, keeps only the ones that still matter, and shows a live count in a compact dashboard. Fair value gaps are drawn as soft fills and order blocks as bordered blocks, so you can tell the two apart at a glance. It is free and open-source.
🔷 HOW IT DETECTS THE ZONES
Fair Value Gaps: a three-candle imbalance. A bullish FVG is marked when the low of the current candle sits above the high of the candle two bars back, leaving an untraded gap. A bearish FVG is the mirror. Gaps smaller than your Min FVG size (measured in ATR) are filtered out so the chart stays clean.
Order Blocks: displacement based. When a candle closes with a body larger than your Displacement setting (in ATR), the toolkit marks the last opposing candle before that move as the order block. A strong bullish move leaves a bullish order block on the last down candle, and the reverse for bearish.
🔷 ZONE MANAGEMENT
Every zone extends to the right until price closes through it (mitigated) or it passes the Max zone age. That means the boxes on your chart are the ones that are still unmitigated, not old clutter.
🔷 THE DASHBOARD
A compact, positionable panel shows the live count of unmitigated bullish and bearish Fair Value Gaps and Order Blocks, plus a total. Drop it in any corner.
🔷 HOW TO USE
Treat the zones as areas of interest, not automatic trades. Watch for price to return to an unmitigated order block or fair value gap in the direction of your higher-timeframe bias, then confirm with your own analysis and use a stop. Higher timeframes produce fewer and stronger zones.
🔷 SETTINGS
Fair Value Gaps: show on/off, Min FVG size (x ATR), colours. Order Blocks: show on/off, Displacement (x ATR), OB lookback, colours. General: Max zone age, Extend right, Info panel + position.
🔷 ALERTS
New Fair Value Gap, and New Order Block.
Free and open-source. Educational tool, not financial advice. Indikator

Indikator

Indikator

Supply and Demand Zones | Flux ChartsGENERAL OVERVIEW
Supply and Demand Zones indicator uses a simple but effective mechanism to find the most useful supply and demand zones on any chart. Most tools draw every zone they can find and leave the trader to sort through the clutter. This indicator does the opposite: it watches how price actually behaves at each zone and keeps only the levels that have earned attention.
The mechanism is straightforward. Each zone is built from a confirmed price swing, and from that moment it is tracked as a living object. Every time price returns, the indicator records what happened — a clean rejection (retest), a failed push-through that snaps back (also a retest), or a decisive break. From that record it computes one honest number, Held: the share of retests where the zone successfully pushed price away. A zone that has held four of five tests is immediately separated from one that keeps breaking.
That same track record then drives what you see. Instead of showing every zone, the indicator surfaces a small set of the most useful ones — ranked by how reliably they have held, how often they have been tested, and how close they are to current price. The result is a clean chart focused on the zones that have actually proven themselves, rather than a wall of boxes you have to filter by eye.
WHAT IS THE THEORY BEHIND THE INDICATOR?
Supply and demand trading is built on a simple idea: where price reversed sharply once, it often reacts again, because unfilled orders and trapped traders remain at that level. The problem is that not every zone is equal. Some levels are respected again and again; others break the first time they are tested. Most supply and demand tools draw every zone the same way and leave the trader to guess which ones still matter.
This indicator takes the position that a zone's history is more informative than its existence. A level that has been tested five times and held four of them is telling you something a fresh, untested level cannot. So instead of treating zones as static boxes, the indicator watches every interaction — bounces, failed breakouts, and clean breaks — and turns that record into a measurable hold rate. A zone earns its place on your chart by performing, not just by existing.
FEATURES
Finds the most useful zones — instead of drawing every zone, it tracks how each one behaves and surfaces only the levels that have proven themselves
Automatic zone detection — supply and demand zones are built from confirmed price swings, with boundaries sized by the average wick so each box covers the real reaction area
Per-zone track record — every zone carries its own data: how many times it has been retested, how many times it has broken, and how reliably it has held
Held statistic — each zone shows the share of its retests that successfully held, turning its history into one honest reliability number you can read at a glance
Retest tracking — every test of a zone is recorded and marked on the chart, including failed breakouts that snap back into the zone
Breakout & flip tracking — clean breaks are recorded, and the zone flips from supply to demand (or vice-versa) while keeping its full history
Strongest / Nearest ranking — shows the most useful zones, ranked by how reliably they have held, how often they have been tested, and how close they are to price
Clear, data-rich visuals — gradient zone fills, glowing retest markers, colour-coded flip segments, and a per-zone stats label that displays its retests, breakouts, and Held % right beside it
Clean-chart controls — minimum spacing hides near-duplicate zones, and a smooth fade-out dims zones as they drop off the list
Four alerts — retests and breakouts, on both supply and demand
ZONE DETECTION AND BOUNDARIES
What is a zone?
A zone is a price area drawn around a recent swing high or swing low. A swing high becomes a supply zone (an area sellers defended); a swing low becomes a demand zone (an area buyers defended). New zones are only created when they don't overlap an existing one, so the chart never stacks duplicate boxes on the same level.
Why does it matter?
Swings are where the market actually changed its mind, which makes them the most natural place to expect a future reaction. Building zones only from confirmed swings — and skipping overlaps — keeps the set of zones meaningful instead of cluttered. Clean, non-overlapping detection is the foundation everything else builds on: the track record and ranking are only as useful as the zones they start from.
How is it detected and calculated?
The indicator waits for a swing to confirm using the Swing Period: a high or low only counts once that many bars have printed on both sides of it. The zone's outer edge sits at the swing's extreme (the high for supply, the low for demand). The inner edge is set using the average wick of the candles around the swing, so the zone covers the real reaction area rather than a single thin line. Because a swing needs bars on both sides to confirm, each zone appears a fixed number of bars after the swing itself — a normal, non-repainting delay rather than a level that appears and disappears.
Settings
Swing Period — how many bars must confirm a swing on each side before it forms a zone. Higher = fewer, more significant zones; lower = more zones that react faster to price. Default 30.
Lookback — how far back the indicator looks for zones, in bars. Higher keeps older zones on the chart; lower focuses on recent price action. Default 2000.
RETESTS AND FAILED BREAKOUTS
What is a retest?
A retest is when price returns to a zone, touches it, and is rejected — closing back out on the same side it came from. This is the classic supply/demand reaction: price revisits the area and the zone pushes it away. A failed breakout — price pushing through the zone but then closing back inside it — is also counted as a retest, because the zone ultimately won.
Why does it matter?
Retests are the evidence that a zone is still active. A level that keeps rejecting price is one the market is clearly watching. Counting failed breakouts as retests is important too: a level that traps breakout traders and reclaims is often the strongest kind of level, and ignoring those events would understate a zone's true strength.
How is it detected and calculated?
On each closed bar, a zone is checked for a reaction: for a supply zone, price reaching into the zone but closing back below it counts as a retest; for a demand zone, reaching in but closing back above. To avoid over-counting when price lingers at a level, a Retest Cooldown requires a minimum number of bars between two counted retests on the same zone. Separately, if price closes clean through a zone and then closes back inside it on the next resolution, that failed breakout is recorded as a retest as well. All events are evaluated only on confirmed (closed) bars, so nothing is counted on an unfinished candle.
Settings
Retest Cooldown — waits this many bars before counting another test of the same zone, so price lingering at a level isn't counted as many separate retests. Default 3.
Retests (toggle + marker) — show or hide retest markers and choose their shape (Circle, Triangle, Cross, Diamond).
BREAKOUTS AND ZONE FLIPS
What is a breakout?
A breakout is when price closes decisively through a zone and keeps going, rather than being rejected. When a zone breaks, it flips: a broken supply zone becomes a demand zone, and a broken demand zone becomes a supply zone — the same idea as old resistance becoming new support. Crucially, the zone keeps its history through the flip; it doesn't start over.
Why does it matter?
A clean break is the opposite of a hold, and tracking it is what makes the Held statistic meaningful. The flip behaviour also reflects how these levels really work in practice — a level that breaks rarely disappears; it changes role. Keeping each zone's full history across flips means a level that has been a battleground through several cycles is shown as exactly that.
How is it detected and calculated?
When price first closes through a zone, the zone enters a pending state. The very next resolution decides what happened: if price closes through again, it is confirmed as a breakout and the zone flips its side; if price instead closes back inside, it is recorded as a failed breakout (a retest). This two-step confirmation avoids calling a breakout on a single bar that immediately reverses. Each flip also starts a new coloured time segment, so the zone's box visually records when it was supply and when it was demand across its life.
Settings
Breakouts (toggle + marker) — show or hide breakout markers and choose their shape. Off by default to keep the chart clean.
THE HELD STATISTIC
What is Held?
Held is the heart of the indicator. It answers a simple question: when price comes back to this zone, how often does the zone actually hold? It is shown on each zone's stats label as a count and a percentage, for example "Held: 4 (80%)" — meaning four of the zone's five retests successfully held.
Why does it matter?
This is the number that separates a level worth trading from one that just happens to be on the chart. A high Held % means the zone has repeatedly done its job; a low one warns you the level is leaky. Because it is measured from the zone's own history rather than assumed, it gives you an honest, at-a-glance read on reliability.
How is it detected and calculated?
After each retest, the indicator looks forward over the Hold Window — a set number of candles — and checks whether the zone was broken during that window. If the zone survived the window without a breakout, that retest counts as a hold. Only retests old enough to have a full window behind them are judged, so a very recent retest doesn't distort the number before its outcome is known. Held is then the count of successful holds, shown alongside its percentage of all retests.
Settings
Hold Window — after a retest, the zone must avoid a breakout for this many candles to count as a successful hold. Drives the Held stat and the Strongest ranking. Default 10.
STRONGEST AND NEAREST RANKING
What is the ranking?
Rather than crowd the chart with every zone it finds, the indicator shows a limited number per side and chooses which ones using one of two modes. Nearest simply shows the zones closest to current price. Strongest shows the zones that have most reliably held, weighted by how often they've been tested and how close they are to price.
Why does it matter?
Most charts have far more historical zones than are useful at once. Nearest is best when you care about the levels price is about to interact with regardless of their record. Strongest is best when you want the chart to surface proven levels — the ones that have repeatedly held — so your attention goes to the areas with the best track record.
How is it detected and calculated?
The Strongest score combines three things. Reliability is the zone's hold rate, but smoothed so a zone tested only once can't look perfect — its record is trusted more as it accumulates more tests. Evidence rewards zones that have been tested more often, with diminishing returns so one ancient zone doesn't dominate forever. Proximity favours zones closer to price. A small bonus is given to zones already on screen so the displayed list stays steady instead of swapping every bar. Nearest mode, by contrast, simply ranks by distance to price.
Settings
Rank By — Strongest (most reliable, weighted by tests and proximity) or Nearest (closest to price). Default Strongest.
Show — how many supply and how many demand zones to show at once; each side is counted separately. Default 5.
ZONE SPACING AND FADE-OUT
What are spacing and fade-out?
Two features keep the chart readable. Minimum spacing hides a zone that sits too close to one already shown, so you don't get several near-identical boxes stacked together. Fade-out smoothly dims a zone as it drops off the visible list, instead of having it vanish abruptly.
Why does it matter?
A clean chart is easier to act on. Spacing prevents visual clutter at congested levels, and the fade-out makes it obvious when a zone is no longer among the top picks without the chart jumping around distractingly.
How is it detected and calculated?
When selecting which zones to show, the indicator skips any candidate sitting within the Min Zone Spacing distance (a percentage of price) of a zone already chosen. When a previously shown zone is no longer selected, it is moved to a fade list and dimmed over a fixed number of bars before being removed. Drawing is also budgeted internally so the gradient zone fills always stay within the platform's object limits.
Settings
Min Zone Spacing (%) — hides zones sitting too close to one already shown, to keep the chart clean. Set to 0 to show every zone. Default 0.1%.
Supply / Demand colours — the colours used for supply and demand zones, their gradient fills, and their markers.
ALERTS
What alerts are available?
Bullish Retest — price bounced from a demand zone.
Bearish Retest — price rejected from a supply zone.
Bullish Breakout — price broke above a supply zone.
Bearish Breakout — price broke below a demand zone.
When do they fire?
Each alert fires on a confirmed bar at the moment the matching event is recorded, so you are notified of bounces and breaks as they are confirmed rather than on an unfinished candle.
IMPORTANT NOTES
All retests, breakouts and flips are evaluated only on closed (confirmed) bars, so events are not counted on an in-progress candle.
A breakout requires price to close through a zone and then confirm on the next resolution. A single bar that closes through and immediately closes back in is recorded as a retest (failed breakout), not a breakout.
Held only judges retests that have a full Hold Window of bars behind them, so the most recent retest may not yet be reflected in the Held count until its outcome is known.
When a zone breaks it flips side and keeps its full history, so a single long-lived zone can show interactions from several supply/demand cycles.
The number of zones shown is limited per side by the Show setting; other valid zones continue to be tracked in the background and can appear later as conditions change.
UNIQUENESS
Most supply and demand indicators draw zones and stop there, leaving the trader to guess which levels still matter. Supply and Demand Zones treats each zone as a tracked object with a measurable record. Every retest, failed breakout and clean break is recorded over the zone's life, and the Held statistic turns that record into a single, honest reliability number shown right on the zone — a level that has held four of five tests is immediately distinguishable from one that keeps breaking. Failed breakouts are folded into retests rather than ignored, capturing the trap-and-reclaim behaviour that often marks the strongest levels, and broken zones flip side while keeping their entire history instead of resetting. The Strongest ranking is driven by that same measured record — reliability, number of tests, and proximity — with smoothing so a single lucky test can't masquerade as a perfect level, meaning the chart automatically surfaces the zones that have actually proven themselves. The result is a supply and demand tool that doesn't just show you where zones are, but how much each one has earned your trust.
DISCLAIMER
This indicator is an analytical and educational tool. It does not predict future price movement and does not provide financial advice. A zone's past hold rate describes what has already happened and does not guarantee future behaviour. Always use proper risk management and combine this tool with your own analysis. Indikator

True Time Price Profile - Hybrid Dynamic Bins[ALT_analyst]True Time Price Profile - Hybrid Dynamic Bins
◆ NOTICE / DISCLAIMER
This architecture is NOT a standard Volume Profile (VP) or a conventional Time Price Opportunity (TPO) indicator.
It is a highly advanced, multi-variable structural density engine.
It was specifically designed to mathematically extract institutional defense lines and localized price absorption in environments lacking reliable tick volume (e.g., Forex, CFD, Indices),
functioning as a rigorous technical benchmark for supply/demand extraction.
◆ EXECUTIVE SUMMARY
This script is deployed as a Proof of Concept (PoC) to demonstrate the integration of price absorption, time-based variance,
and strict pro-rata energy distribution within a localized UI rendering environment.
By discarding standard aggregation methods, this open-source architecture isolates the true "quality" of price stagnation,
exposing anomalous market states where large capital defends specific price buckets.
◆ ARCHITECTURE & QUANTITATIVE LOGIC
Standard profiles often struggle because they cannot distinguish between a "rapid vacuum passing" and a "defended consolidation."
This engine utilizes three proprietary layers to resolve this logic gap:
Pro-Rata Energy Distribution Engine
To prevent large-range bars (e.g., sudden momentum spikes) from artificially inflating the profile score across empty price vacuums, this script enforces a strict pro-rata allocation matrix.
Let N_bins be the total number of price bins a single bar intersects.
The assigned value for each specific bin is calculated as:
Apportioned Value = Base Value / N_bins
This completely neutralizes vacuum zones, correctly assigning mass only to true areas of conflict.
Velocity & Acceleration (Absorption) Evaluator
Instead of counting volume, the script measures the deceleration of price action.
It compares the high-low range of the current bar (v_curr) against the previous bar (v_prev). A negative acceleration (accel < 0) indicates kinetic energy is being absorbed by limit orders.
This absolute delta is extracted as the base absorption value (|a|).
Time Variance Logic (Market Memory)
A price level tested multiple times over a prolonged period holds significantly more structural integrity than a level tested only once.
The engine applies the statistical variance of the normalized time index (t) to scale the localized importance of a bin:
Variance (σ²) = (Sum of t² / n) - (Average t)²
The final Hybrid Score is the integration of absorbed energy scaled by the logarithmic variance:
Score = Sum( |a| * ln(1 + σ²) )
◆ PRACTICAL APPLICATION: HOW TO TRADE WITH THIS ENGINE
Instead of blindly treating every high-volume node as support/resistance, utilize this engine to identify Structural Friction:
Locating Hidden Institutional Limits:
Bins with exceptionally high Hybrid Scores often act as heavy liquidity pools.
Price action will typically stall or reverse sharply upon re-entering these zones.
Breakout Validation:
If price breaks out of a Value Area (VA) without generating new high-score bins, it indicates a lack of limit-order resistance (a vacuum).
These moves are prone to rapid continuation or swift mean-reversion sweeps.
Cross-Session Node Alignment (Breakout Threshold):
By anchoring the profile to short, sequential sessions, observe if high-scoring nodes (POCs) align horizontally at the same price level across multiple independent profiles.
This structural anomaly signifies a massive, sustained accumulation of limit orders.
A decisive price breach of this specific alignment typically triggers a high-probability volatility breakout, as the defended liquidity pool is rapidly consumed.
◆ SYSTEM CAPABILITIES AND LIMITATIONS
Visual Synthesis of Invisible Nodes:
Resolves precise support/resistance vectors purely from price action kinetics, independent of broker volume feeds.
Dynamic Resolution Scaling:
The bin size is strictly tethered to the Average True Range (ATR), ensuring the profile grid automatically calibrates to the underlying asset's volatility regime.
Limitations & Warnings:
TradingView enforces a strict cap of 500 max boxes/lines per indicator. To prevent script execution limits or array errors, the maximum lookback and bin count are dynamically capped.
Furthermore, if the scaled ATR drops to absolute zero, the geometric grid cannot initialize.
◆ INPUT PARAMETERS REFERENCE
Live Update Frequency:
Toggle between 'Update on Every Tick' and 'Update on Bar Close'.
CRITICAL WARNING: Using tick updates combined with multiple MTF arrays on a fast timeframe will cause localized UI lag. Use 'Bar Close' as a CPU saver.
Profile Calculation Mode:
Select 'Classic' for standard aggregation, or 'Hybrid' to engage the Absorption + Variance matrix (The core edge of this tool).
Grid Step Multiplier:
Lower values increase vertical resolution.
Warning: Values below 0.05 on high-volatility assets may trigger the 500-box rendering limit.
Show Debug Data Table:
Projects a live array matrix on the bottom right, displaying precise Price, Count, Absorption, Variance, and Hybrid Scores for absolute algorithmic transparency.
Indikator

Auto Candlestick Patterns Targets Setup🔷 OVERVIEW
Auto Candlestick Pattern Targets automatically identifies supported candlestick reversal patterns and displays a complete trade setup directly on the chart. When a qualifying pattern is detected, the indicator plots an Entry level, Stop Loss, and up to three Take Profit levels based on its internal calculation logic.
The objective is to reduce the amount of manual chart work by presenting trade levels in a consistent visual format.
🔷 HOW IT WORKS
The indicator continuously evaluates completed candles for supported bullish and bearish candlestick formations.
When the pattern conditions are satisfied, it:
• Displays a Buy or Sell label
• Calculates an Entry level
• Places a Stop Loss based on the detected pattern
• Projects three Take Profit targets
Each setup remains visible on the chart, allowing users to review historical signals and monitor active trades.
🔷 VISUAL FEATURES
• Automatic Buy and Sell labels
• Entry level
• Stop Loss level
• Three Take Profit targets
• Risk and reward visualization
• Historical signal display
• Configurable colors and styles
🔷 INPUTS
The indicator includes options to customize:
• Signal sensitivity
• Display of Entry, Stop Loss, and Targets
• Label visibility
• Colors
• Historical setup display
🔷 USAGE
A common workflow is:
Wait for a Buy or Sell signal.
Allow the signal candle to close.
Review the plotted Entry, Stop Loss, and Take Profit levels.
Combine the setup with your own market analysis before making trading decisions.
🔷 MARKETS
The indicator can be applied to:
• Forex
• Stocks
• Cryptocurrency
• Indices
• Commodities
It is compatible with multiple timeframes, depending on the user's trading approach.
🔷 NOTES
This indicator is intended as a chart analysis tool and does not predict future price movements. Trade setups are generated according to the indicator's programmed rules and should be evaluated alongside other forms of technical analysis and appropriate risk management. Indikator

Trend Momentum Breakout [AlphaPine]Overview
Trend Momentum Breakout is built for traders who use trendline breaks as part of their market-structure review.
The indicator displays support and resistance trendline references, keeps the chart focused on recent structure, and highlights breakout conditions based on the selected confirmation settings.
It is designed to answer one focused chart-reading question:
Where is price showing a confirmed break of a support or resistance trendline reference?
This indicator is not a complete trading system. It is a structure layer that can be used alongside broader market context, price action, volume, higher-timeframe bias, risk planning, and a trader's own execution rules.
What It Shows
Support and resistance trendline references.
Bullish breakout markers after resistance breaks.
Bearish breakout markers after support breaks.
Smaller and larger structure views.
Optional volume confirmation.
Optional moving averages for trend context.
Optional structure point markers for visual review.
Alerts for monitored breakout conditions.
Visual Legend
Red line: resistance trendline reference.
Green line: support trendline reference.
Thicker line: larger structure.
Thinner line: smaller structure.
Dashed line: projected or recently broken trendline segment.
Green up marker: bullish resistance breakout.
Red down marker: bearish support breakout.
Gray marker: optional structure point marker.
How To Use
Add the indicator to a liquid market and start with the default settings.
Use the visible trendline references as market-structure context. When a breakout marker appears, treat it as a confirmed structure event, not as an automatic trade entry.
Traders can adjust the structure scale, chart cleanliness, breakout confirmation, optional volume filter, display style, and optional moving averages to match their chart-reading workflow.
Alerts can be used to monitor breakout conditions without watching every chart continuously. Alerts should be treated as notifications, not automatic trade instructions.
Confirmation Behavior
Breakout markers appear only after the indicator has enough confirmed chart structure to display an active trendline reference. A marker is shown when price confirms a break under the selected settings.
Optional volume confirmation can be enabled for traders who want an additional participation filter.
Important Live-Chart Note
This indicator uses confirmed chart structure. Confirmed structure requires time to form, so historical trendlines can look cleaner than what a trader would have seen live at the original turning point.
This is normal for structure-based indicators. Historical plots should be used for review and learning, not as proof of profitability or as evidence that every past marker was tradable in real time.
For live use, wait for the current bar to close, the trendline to be confirmed, and the breakout marker or alert to appear under the selected settings.
Settings Overview
The default settings are designed to keep the chart readable while showing recent support and resistance trendline structure.
Available controls include:
Structure lookback and scale.
Maximum visible lines.
Trendline selectiveness.
Advanced structure sensitivity.
Scan depth and chart-performance balance.
Breakout confirmation strictness.
Optional volume confirmation.
Recent marker display.
Marker size and visibility.
Trendline and marker colors.
Optional moving averages.
Alert controls and cooldown.
Moving Averages
Moving averages are included as an optional chart overlay only.
They are useful when traders want basic trend context without adding a separate moving average indicator. They do not turn Trend Momentum Breakout into a trend-following system and should still be interpreted with the broader chart.
Best Use
This indicator is intended for markets and timeframes where traders already use trendline structure as part of their analysis.
Good fit:
Trendline breakout review.
Market structure mapping.
Support and resistance break monitoring.
Discretionary trade planning.
Multi-timeframe chart review.
Breakout watchlists with alert support.
Less suitable for:
Automatic buy/sell execution.
Low-liquidity markets with erratic candles.
Choppy conditions where trendline breaks may be less informative.
Using historical markers as standalone proof of profitability.
Trading Notes
Resistance and support are often better understood as areas, not perfect single-price levels. This indicator draws trendlines as visual references because its purpose is trendline breakout mapping. Traders should still account for spread, volatility, liquidity, candle context, and nearby support/resistance zones.
Breakouts can fail. A confirmed trendline break does not remove the need for risk management, invalidation planning, and broader market context.
What Makes It Useful
Trend Momentum Breakout helps organize trendline breakout analysis by combining structure references, confirmation markers, visual controls, optional volume context, optional moving averages, and alert support into one focused indicator.
The goal is not to replace a trader's decision process. The goal is to make trendline breakout structure easier to see, review, and monitor.
Disclaimer
This indicator is for educational and analytical use only. It is not financial advice and does not guarantee any trading result. Traders are responsible for their own analysis, risk management, and execution decisions. Indikator

Sessionscope [Quantum Algo]Sessionscope is a time-based ICT killzone tool that plots the four primary intraday
killzones, projects the liquidity each one creates, and then measures what happens after
that liquidity is taken. It is built for traders who use Smart Money / ICT concepts and
want session context plus a quantified read on how each killzone behaves on their specific
instrument.
It is not a buy/sell signal system. It is a context and statistics tool.
WHAT IT PLOTS
- Four killzone range boxes, each with its high, low and equilibrium (50%) level.
- Forward-projected session liquidity: each closed killzone's high as buy-side liquidity
(BSL) and its low as sell-side liquidity (SSL).
- Liquidity sweep marks, recolored by outcome (reversal vs continuation).
- The New York midnight open (00:00 ET) as a daily reference line.
- A statistics dashboard summarizing each killzone over the full chart history.
THE FOUR KILLZONES
Default windows, in New York time (America/New_York):
- Asia 20:00 - 00:00
- London Open 02:00 - 05:00
- New York AM 07:00 - 10:00
- London Close 10:00 - 12:00
These are the conventional ICT killzone windows. Because the timezone is anchored to
America/New_York rather than a fixed UTC offset, the windows automatically follow US
daylight saving (EST/EDT) and stay aligned year-round. All four windows, names and colors
are fully editable, so you can shift them, repurpose one (for example to a New York PM or
Silver Bullet window), or adapt the New York window to index timing (08:30 - 11:00) if you
trade futures rather than forex.
SESSION LIQUIDITY (BSL / SSL)
While a killzone is open, the box tracks its developing high and low in real time. When the
killzone closes, those extremes are frozen and projected forward as horizontal liquidity
levels - the high as buy-side liquidity, the low as sell-side liquidity - and extended until
the next instance of that same session. A sweep is registered when price trades through a
projected level (a wick or close beyond the high, or beyond the low). The level can be frozen
at the moment of the sweep to keep the chart clean.
SWEEP OUTCOME ENGINE (the core idea)
Marking a sweep is common. Sessionscope goes further and classifies the outcome of every
sweep:
- High sweep -> REVERSAL if price closes back below the swept high within a configurable
number of bars; otherwise CONTINUATION.
- Low sweep -> REVERSAL if price closes back above the swept low within that window;
otherwise CONTINUATION.
A reversal is the classic ICT liquidity-grab outcome (the level is run, then rejected). A
continuation means the level broke and held (a genuine expansion). Each sweep mark is
recolored to its resolved outcome, and the result feeds the Rev% statistic below. This turns
the qualitative liquidity-grab premise into a measured, per-session number.
NEW YORK MIDNIGHT OPEN
The first traded price after 00:00 America/New_York is captured each day and drawn as a
horizontal reference for that session - a level many ICT traders use as a daily equilibrium
anchor. It is fixed once printed and does not move.
STATISTICS DASHBOARD
For each enabled killzone, accumulated over the entire visible chart history:
- Avg Rng : average high-to-low range of the session, in price.
- xATR : that average range expressed as a multiple of the daily ATR(14), so you can see
which killzone expands most relative to typical daily volatility.
- Swept% : how often the session's liquidity is taken - the share of its high and low
levels that get swept before the session next reopens.
- Rev% : of the sweeps that occurred, how often price reversed back inside the range
(a grab) rather than continuing through (a breakout).
- Bias% : share of sessions that closed above their open (directional tendency).
- n : number of completed sessions in the sample.
Read together, Swept% and Rev% answer two distinct questions: how often does this killzone's
liquidity get run, and when it does, how often does it snap back? Bias% and xATR add the
session's directional lean and its size relative to the day.
HOW IT WORKS (calculation notes)
- Sessions are detected with Pine's time/session function in the chosen timezone; the box
high/low are running extremes of the bars inside each window.
- The daily ATR used for xATR is requested from the 1D timeframe using an offset expression
with lookahead disabled, so it is fully confirmed and constant intraday (no lookahead bias).
- Sweep outcomes are evaluated only on confirmed price relative to fixed, already-closed
levels.
- Statistics are accumulated over the full chart history independently of what is drawn.
- To keep the price scale anchored to current price, only a configurable number of recent
sessions of boxes and levels are kept on the chart (older drawings are removed); this does
not affect the statistics, which always use full history.
WHAT MAKES IT DIFFERENT
Most session and killzone tools stop at colored boxes, session highs/lows, midpoints and a
basic range table. Sessionscope adds the outcome layer: it does not just show that liquidity
was swept, it measures whether each session's sweeps tend to reverse or continue, and colors
them accordingly. The Rev% metric, combined with Swept%, is the part that goes beyond a
standard session-range tool.
SETTINGS
Grouped for clarity: Timezone; Sessions / Killzones (per-session enable, name, window,
color); Box & Level Visuals (boxes, fills, high/low, equilibrium, labels, history cap);
Session Liquidity & Sweeps (projection, sweep marks, freeze-on-sweep, line style, reversal
window, outcome coloring); New York Midnight Open; Statistics Dashboard (position, size);
and Alerts.
HOW TO USE
- Apply on an intraday timeframe; 1m to 1h work best (5m or 15m for clean session structure).
- Mark your higher-timeframe bias first, then use the killzone windows to time entries.
- When a killzone level is swept, read the outcome color and that session's historical Rev%
to gauge whether a reversal back inside the range is the higher-probability path.
- Use xATR to see which session is statistically the most active on your instrument, and
Bias% for its directional lean.
REPAINTING
Boxes and the live high/low update in real time while the current session is forming - this
is expected real-time behavior, not lookahead. Once a session closes, its levels are fixed;
sweeps are detected on price crossing those fixed levels; and an outcome, once resolved on a
closed bar, does not change. No lookahead is used anywhere in the script.
CONCEPTS AND CREDIT
The concepts used here - killzones, buy-side and sell-side liquidity, liquidity sweeps, the
midnight open, and premium/discount equilibrium - originate with the Inner Circle Trader
(Michael J. Huddleston) and the wider Smart Money Concepts / price-action community, where
they are taught and discussed openly. The session window defaults follow the killzone times
commonly used by that community. All code in this script - the session detection, liquidity
projection, sweep-outcome classification and statistics engine - is written independently and
reuses no third-party code. It is published open-source so anyone can read, verify and modify
it under TradingView's House Rules.
DISCLAIMER
This script is provided for educational and informational purposes only. It is not financial,
investment or trading advice, and it does not produce buy or sell recommendations. All
statistics are descriptive measurements of historical data on the current chart and do not
predict future price behavior; past behavior of a session or level does not guarantee future
results. Trading involves substantial risk of loss. You are solely responsible for your own
decisions and risk management. Test any tool thoroughly on your own markets and timeframes
before relying on it. Indikator

Round NumbersRound Numbers highlights the key psychological price levels around the current market by drawing round, half, and quarter number levels around price.
The goal is simple: make round numbers easier to see, improve chart readability, and help you stay visually oriented without cluttering the chart with unrelated logic.
How it works
Automatically adapts level spacing across different markets using daily range and decimal-place anchoring.
Works with Forex, cryptocurrencies, indices, commodities, and stocks.
Optional symbol-specific override multipliers are available for instruments that require custom spacing.
Displays
Round levels
Half levels
Quarter levels
Use cases
Visualize where price is trading relative to nearby psychological levels.
Improve chart structure and orientation.
Keep important price levels visible across different markets.
Settings
Visible Levels - Number of levels displayed around the current price.
Round / Half / Quarter - Individual visibility and style settings.
Overrides - Optional symbol-specific spacing multipliers.
This indicator is designed as a visual reference layer. It does not generate trade signals and does not attempt to identify support or resistance using order flow, liquidity, or reversal logic.
Indikator