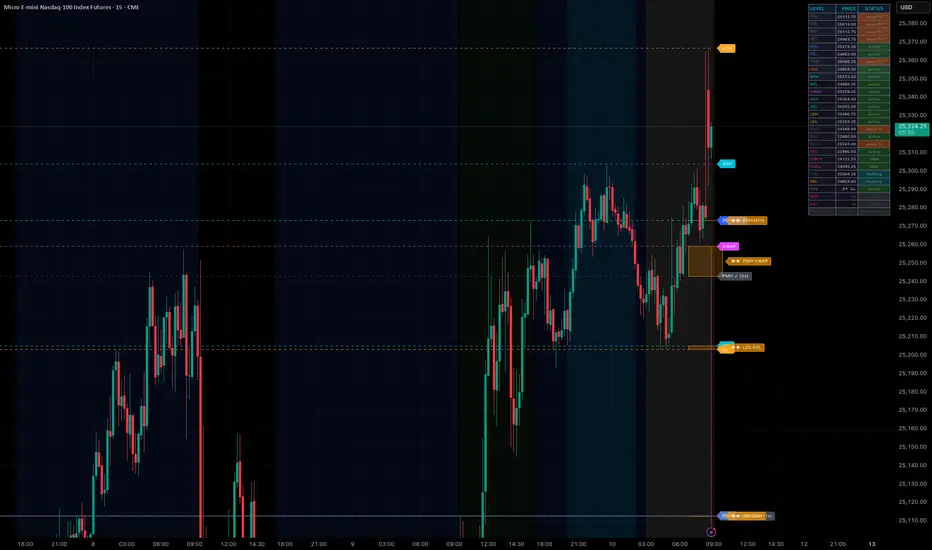
Session Ranges & Killzones + ORBSession Ranges & Killzones + ORB NY 8am, 9:30am, 2pm, 8pm and 2am ORB ranges NY Midnight open, 9am and 10am open linesIndikatoroleh AClass88Diupdate 52
Nilesh MTF Liquidity LevelsOverview This indicator plots multi‑timeframe liquidity levels (highs and lows) on the chart and removes them once price sweeps the level. It is designed to help traders see where liquidity may be resting above or below current price. How it works The script tracks the previous candle’s high and low on several higher timeframes (15m, 30m, 1H, 4H, Daily) and draws horizontal lines from those levels into the future. When price makes a wick or close beyond a level (depending on the user setting), Indikatoroleh njrathod202344
Nilesh HL LinesNilesh HL Lines is a liquidity-based indicator that plots previous hourly and daily highs and lows as extended horizontal levels. These levels represent potential liquidity zones where price may react. The script automatically tracks and removes levels once they are swept, helping traders focus only on active liquidity. Key features: Tracks hourly and daily high/low levels Automatic removal after liquidity sweep Custom color and opacity settings Adjustable lookback for hours and days OptionalIndikatoroleh njrathod202325
Breakout with text box Tubbsie ### 0DTE Breakout Framework (SPY / QQQ) – EMA Pullbacks + Bias Box Built specifically for **SPY & QQQ 0DTE options traders**, this indicator focuses on one objective: > **Catch clean trend continuation moves while avoiding chop and emotional trades.** It combines EMA structure, precise pullbacks, and real-time market context into a simple, rules-based execution framework. --- ### 🔥 What This Is Designed For * 0DTE scalps and intraday momentum trades * EMA pullback entries (9 / 13 / 48 strIndikatoroleh Tubbsie7
IPO Day High Line (<= 1000 Trading Days)This script is about the stocks listed in the last 1000 trading days. It searches for the highest price point on the listing's day and draws a horizontal line. It is assumed that newly listed stocks have completed their base formation once they cross the highest price point of day one. It is useful for traders when the stock is listed in the last 1000 Days. I have kept it simple; feedback and improvements appreciated. Since we are looking for 1st Day's high, it works better on daily timeframeIndikatoroleh shripadrupali15
Macro Fibo LookBackAuto Macro Fibonacci ( Overview Drawing Fibonacci retracements manually on higher timeframes can often be subjective and tedious. The Auto Macro Fibonacci indicator automates this process by scanning a user-defined historical period (lookback) to identify the absolute macro peak and trough, instantly plotting a flawless, rule-based Fibonacci retracement. Whether you are looking for deep pullbacks, harmonic pattern completion zones, or major structural support/resistance, this tool filters out tIndikatoroleh Okeefe0661
Liquidity Trap & Reversal bot [Point algo]The Psychology of the Liquidity Trap Retail traders are taught to place their Stop Losses just above previous swing highs or just below previous swing lows. Market makers and institutional algorithms often drive price into these "pockets of liquidity" to fill their own large orders. This script identifies the specific 111% – 113% "Sweet Spot" where these traps frequently occur. The 111% Liquidity Trap & Reversal is a structural tool that maps out these institutional "Stop Run" zones and providIndikatoroleh pointalgo2106
QM Range (DAFE)Quasimodo Range Engine A Systematic Framework for Liquidity, Structure, and Range Analysis A Mechanical Approach to Decoding Market Microstructure and Order Flow. 🎓 THEORETICAL FOUNDATION The Quasimodo Range Engine (QM-R) is a comprehensive analytical framework designed to map market structure by tracking the flow of liquidity. It is built on the premise that markets frequently engineer liquidity through temporary sweeps of established pivot points, trapping breakout participants before iIndikatoroleh DskyzInvestments8460
Daily Deviation Range and Gap Stats - NikaQuant ## What It Does This indicator projects six pairs of deviation levels above and below a defined session range, draws a daily gap line at a configurable time, and shows a live stats panel with historical hit rates, mean-revert rates, gap fill statistics, and trade-decision suggestions. The range itself is captured as the high and low of 5-minute closes during a configurable New York time window (default 19:30 to 20:30 NY). Once the window closes, the range is locked and six fibonacci-style deIndikatoroleh NikaQuantDiupdate 41
Quantum Liquidity Map - VP, VWAP & CVD Confluence [NikaQuant]Info: An overlay that combines three institutional order-flow methods — visible-range Volume Profile, session-anchored VWAP with standard-deviation bands, and Cumulative Volume Delta with divergence detection — into one coordinated tool for reading liquidity and order-flow conviction. ## Why This Combination Exists Each of the three methods answers a different question about price, and none of them can answer the others alone. Volume Profile answers "where has the market actually traded?" — iIndikatoroleh NikaQuantDiupdate 2536
Big C Key LevelsBig C Key Levels plots the most important price levels for intraday trading — all in one clean, customizable indicator. Levels included: CDH / CDL — Current Day High and Low, updates live as the session develops PMH / PML — Premarket High and Low, locked in at 9:30 AM EST PDH / PDL — Previous Day High and Low PWH / PWL — Previous Week High and Low Features: Full customization — colors, line style, line width, and show/hide toggles for each level group Alert system built in — set alerts for anIndikatoroleh xfactor101Diupdate 51
Gann Sq9 Levels - @darshaksscGann Square of 9 (Sq9) is one of W.D. Gann's most powerful tools for identifying price support and resistance levels. This indicator applies the core Sq9 formula — stepping ±0.25 increments on the square root of a base price — to automatically plot key levels directly on your chart. 𝗛𝗼𝘄 𝗶𝘁 𝘄𝗼𝗿𝗸𝘀: The indicator takes a base price (session high/low midpoint, session open, previous close, or manual input) and calculates symmetrical resistance levels (R1–R6) above and support levels (S1–S6) beIndikatoroleh darshakssc10 1.1 K
Liquidity Reaction Market Context FrameworkDescription Liquidity Reaction – Market Context Framework is a structured visual tool designed to provide traders with clear market context based on session behavior, time-based positioning, and key reference levels. This script does not aim to generate signals. Instead, it builds a contextual framework that helps traders understand how price evolves across different trading sessions and how liquidity transitions occur throughout the day. Core Concept Markets do not move randomly — they eIndikatoroleh LiquidityReactionDiupdate 33
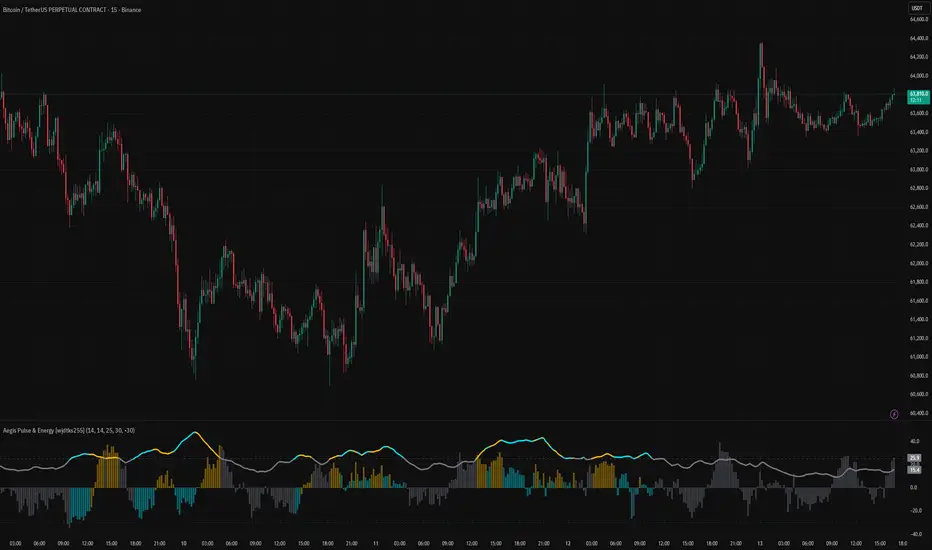
Aegis Pulse & Energy [wjdtks255]■ 1. Overview Aegis Pulse & Energy is a hybrid strength oscillator that synchronizes trend intensity with capital flow. It filters out weak, manipulative price movements and identifies high-conviction trends where actual "Smart Money" is active, represented as the market's vital pulse. ■ 2. Technical Breakdown (The Energy Engine) ADX Trend Intensity: Measures the pure strength of a trend, regardless of direction. A surge above the 25 threshold indicates the start of a high-energy movement. MFIndikatoroleh wjdtks255Diupdate 13
NS Style Daily/Weekly Zones PROSimple support and resistance zones from the daily, weekly, hourly timeframes, projected onto your chart. Helps you stay focused on key areas where price is likely to react. Use weekly for overall direction, daily for levels, and drop down for entries. No clutter. Just levels.Indikatoroleh shaunrev8
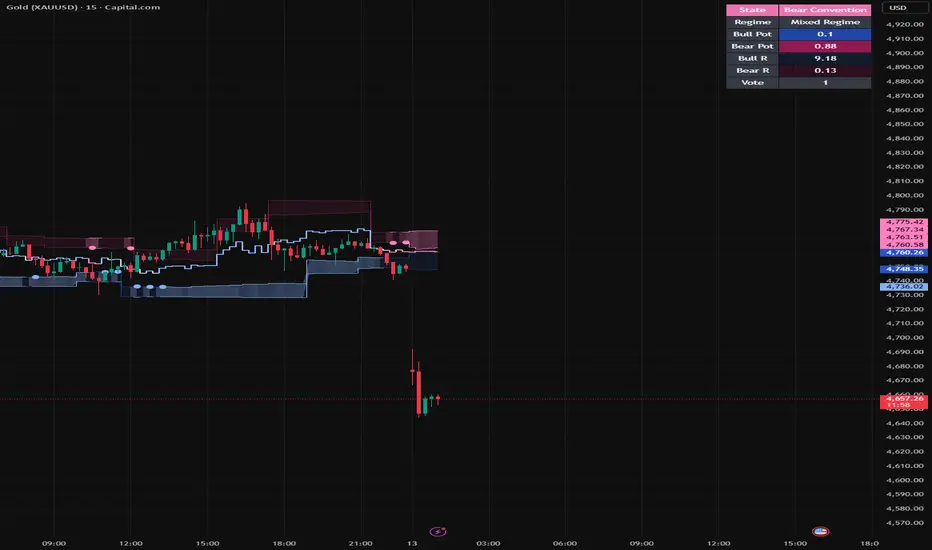
Stochastic Potential Zones Stochastic Potential Zones Most indicators try to tell you where price is. This one tries to tell you where price is most likely to settle. That is the whole point. The math comes from stochastic stability and risk dominance. In simple terms, a system can have two stable outcomes, but one of them is usually easier to reach and easier to defend. Over time, that easier state tends to dominate. This script applies that exact idea to price. The indicator builds two structural basinsIndikatoroleh TheWannaBeQuant12
Realtime Non-Repaint PathName: Realtime Non-Repaint Path Searchable Name: Realtime Non-Repaint Path Technical name: Realtime Non-Repaint Percentage-Reversal Path Short title: RT NR Path Summary Realtime Non-Repaint Path is a standalone path-visualization and path-state script designed to show live non-repainting directional path structure and a simplified hidden path reveal. It uses a percentage-reversal path model to classify live path direction, maintain a live anchor/candidate structure, draw a live Indikatoroleh AceInfinityDiupdate 225
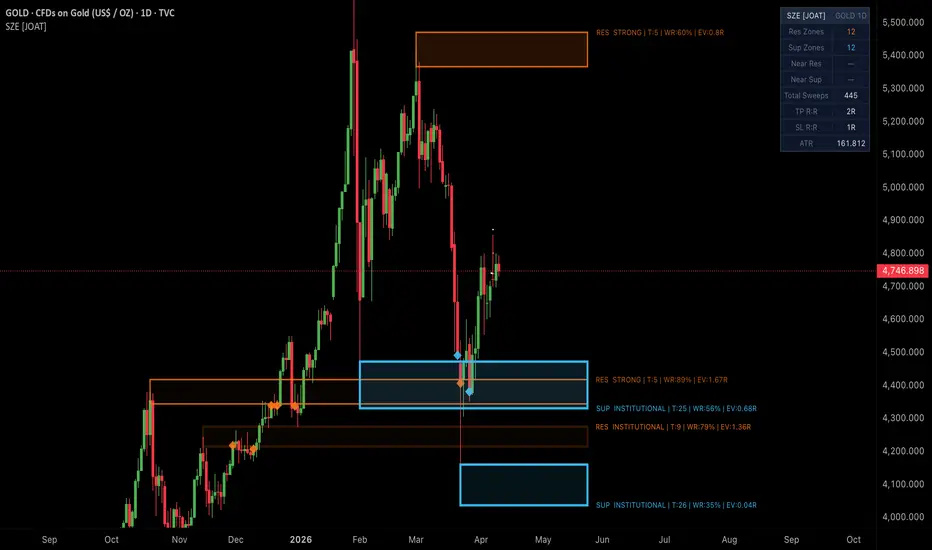
Statistical Zone Engine [JOAT]Statistical Zone Engine Introduction Statistical Zone Engine is an open-source overlay indicator that builds pivot-cluster support and resistance zones with walk-forward statistical scoring. Each zone is backed by a full expected value computation: the indicator counts historical touches and bounces from the zone's price range over a configurable lookback, computes a win rate, and derives an EV score in units of R. Zones are tiered into four strength categories — Weak, Moderate, Strong, Indikatoroleh officialjackofalltrades189
MTF Pivot Lines (1H / Daily / Weekly)This indicator displays pivot-based support and resistance lines from three higher timeframes — 1-Hour, Daily, and Weekly — directly on your chart, regardless of the timeframe you are currently viewing. ─── FEATURES ─── 【 Multi-Timeframe Pivot Lines 】 Draws the most recent pivot high (resistance) and pivot low (support) from the 1H, Daily, and Weekly timeframes as persistent horizontal lines that extend across the entire chart. 【 Wick-Body Zone Fill 】 Optionally fills the range between the wiIndikatoroleh na-gi29
Dow Theory and Price Action V2This indicator is the successor to "T-DOW-FLOW: Final Edition". The trend visualization has been redesigned in a Supertrend style, making it cleaner and easier to read, along with various other refinements. This indicator integrates multiple analytical tools based on Dow Theory and price action concepts, designed to help traders identify trend direction, key support/resistance levels, and multi-timeframe structure. ─── COMPONENTS ─── 【 Dow Theory Trailing Line 】 An ATR-based trailing line driIndikatoroleh na-gi206
Price to Volume ChangePrice to Volume Change — All-Positive Ratio Lollipop Chart A separate-pane indicator that measures the ratio between price change and volume change on consecutive completed bars. All values are positive — the ratio always shows how many times more the dominant side changed. Color indicates WHICH side is dominant (green = price, red = volume) and WHETHER price and volume agree on direction (bright = confirmed, dim = divergence). What Makes This Original All-positive scale — Unlike indIndikatoroleh yuval3000Diupdate 15
Price Volatility GaugePrice Volatility Gauge A price-derived volatility indicator that measures realized price range behavior and presents it in four distinct modes. Unlike implied volatility indicators that require options data, PriceVol works on any asset by analyzing price action alone — making it universally applicable to stocks, indices, forex, crypto, and commodities. What Makes This Original This indicator introduces a novel approach to measuring volatility: Standard deviation-adjusted price range Indikatoroleh yuval30005
The Pink LineThe Pink Line — Higher-Timeframe S/R With Breakout Confirmation An overlay indicator that identifies key support and resistance levels derived from a higher timeframe and validates breakouts using candle structure and relative volume. Unlike standard pivot or S/R indicators that simply mark price extremes, The Pink Line adds three layers of confirmation before signaling a potential entry. What Makes This Original Most support/resistance tools plot static levels from pivot points or round nIndikatoroleh yuval3000Diupdate 10
Key Levels Lite by ProDeskTradesKey Levels Lite plots the four most important institutional price reference levels used by professional traders, with real-time sweep tracking for each. Levels plotted: - PDH / PDL — Previous Day High & Low. Locked at the prior RTH session close. Most-watched daily reference for institutional Indikatoroleh ProDeskTrades27