Trendlines [FEELS]Auto trendline tools tend to draw every line they can find, then quietly redraw them when price disagrees. This indicator does the opposite: a line is drawn only after price has respected it three times, and once drawn it never moves. Every line carries its own proof, a plain-text counter of how many times price has touched it.
HOW IT WORKS
The engine pairs confirmed swing pivots and validates the segment between them: if price closed through it anywhere along the way, the pair is rejected. Survivors become invisible candidates. A candidate is promoted to a real chart line only when a third touch confirms that the market actually respects it, and from that moment the geometry is locked.
- Touch counter: every line is labeled in plain text, "Support · 3 touches". More touches also make the line thicker, so the most respected line on the chart is the most visible one.
- Two scales: the base set tracks the swings you trade, the Major set (thicker, built from roughly 3x bigger swings) tracks the macro structure.
- Breaks: a break is a close beyond the line plus an ATR buffer, marked on the chart when it happens. Wicks through the line do not count.
- Flip watch: a broken line is not deleted. It stays on the chart as a dotted grey ghost, and when price returns to it from the other side, a Retest marker prints: broken support acting as resistance, tracked automatically. Ghosts expire on their own.
- Housekeeping: near-duplicate lines merge into the stronger one, and lines nobody has touched for a long time, or that drifted more than 10 ATR away from price, retire quietly. The chart stays at a few lines that matter instead of a fan of guesses.
HOW TO READ IT
1. The touch counter is a strength ranking. A line with 5 touches has proven itself more than a line with 3, and the strongest lines are where reactions have historically been most consistent.
2. Touches and breaks read differently. Price returning to a rising support with a high touch count is the classic trend pullback structure. A close through the line (Break marker) means the structure that carried the trend is gone.
3. Retest markers show the flip. After a break, the old line often gets tested from the other side; the Retest marker prints when that happens, with the line itself as the natural invalidation level of the pattern.
HONESTY
- Confirmation has a cost. A swing pivot confirms only after the "Swing size" number of bars, so a line appears on the chart only once its third touch is confirmed, and at that moment it is drawn back to its origin. On a bar replay this looks like a line appearing into the past out of nowhere. That is the price of the no-repaint rule, not a glitch.
- After a line is drawn its position never changes. Breaks are evaluated on closed bars only, and Break/Retest markers stay where they printed.
- The touch badges at the right edge follow the last bar for readability; that movement is cosmetic, not a signal.
- Touch and break tolerances are ATR-based, so they adapt to each symbol's volatility instead of using fixed percentages.
- Works on any symbol and timeframe with enough history to form swings.
ALERTS
New support line · New resistance line · Support touched · Resistance touched · Support broken · Resistance broken · Flip retest.
SETTINGS
Every input has a tooltip. The ones that change the picture most: "Swing size" sets how big a swing must be to anchor a line, "Touches to confirm" is the promotion rule (3 by default), "Max lines per side" caps the chart at the lines that matter, "Macro lines" adds the thicker second scale, "Line width" and "Text size" scale the visuals for presentations.
ORIGINALITY
Most auto-trendline scripts connect the latest two pivots and update the line as new pivots print, so the line you see today is not the line you saw yesterday. This engine is built the other way around: lines must earn their place through touch-count validation before they exist, their geometry is locked after, near-duplicates are merged, and broken lines move to a ghost stage that keeps tracking them for the support/resistance flip. The pivot pairing, segment validation, touch accounting and the line lifecycle are written from scratch for this script.
This is a descriptive tool for reading trendline structure. It is not financial advice and does not predict price. Indikator

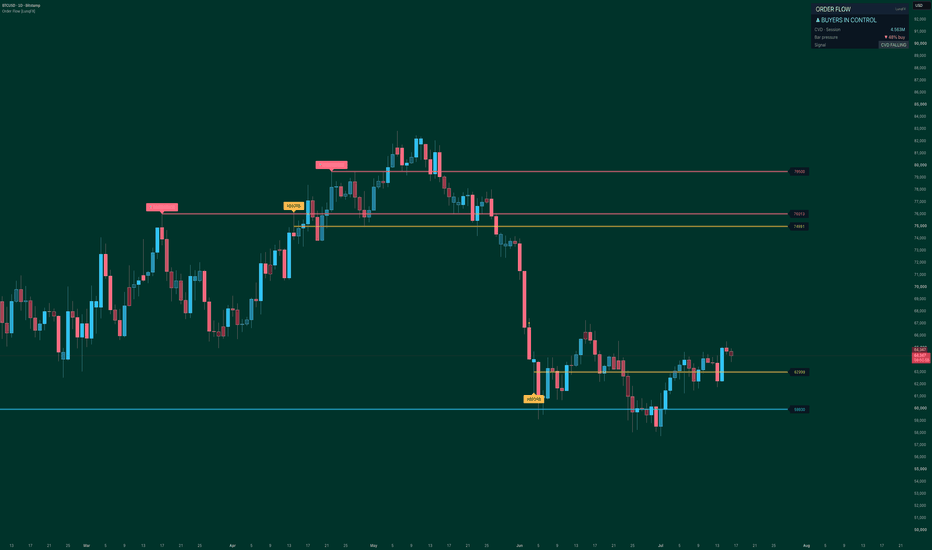
Order Flow Volume Delta, CVD, Absorption & Divergence [LunqFX]Price shows you WHERE the market went. Order flow shows you WHO pushed it there — buyers or sellers — and whether they had real volume behind the move. This Order Flow indicator reads the volume delta on every candle (the balance of buying volume vs selling volume), builds it into a cumulative volume delta (CVD) trend, and automatically marks the two order-flow events that lead price: absorption and delta divergence. Everything is drawn on your chart as clean delta candles, order-flow support/resistance levels and a live buying-pressure dashboard.
❶ THE CONCEPTS (so it's clear)
▸ VOLUME DELTA — the difference between buying volume and selling volume inside a bar. Positive delta = buyers were more aggressive, negative = sellers. It is the core of all order-flow analysis.
▸ CVD (CUMULATIVE VOLUME DELTA) — delta added up over time. A rising CVD means buyers are steadily accumulating; a falling CVD means distribution by sellers. CVD is how you see the real trend of order flow, not just price.
▸ ABSORPTION — a bar with heavy volume but almost no price movement. It means a large player (smart money / institutional) is absorbing every market order at that level. Absorption very often appears right before a reversal.
▸ DELTA DIVERGENCE — price makes a new high but CVD does not (or a new low but CVD does not). The move has no real volume behind it — a trap / exhaustion signal that warns a reversal is likely.
❷ WHAT YOU SEE ON THE CHART
▸ Delta candles — sky-blue when buyers won the bar, coral when sellers won; the brighter the candle, the more one-sided the flow. You read buying and selling pressure at a glance.
▸ Order-flow levels — every absorption (gold) and divergence (blue / coral) is projected to the right as a support/resistance level with its exact price. These are the levels where big volume actually traded, so price reacts to them again.
▸ Live dashboard — who is in control (buyers vs sellers) from the CVD, the CVD value, the current bar's buy/sell pressure split, and the latest signal.
❸ HOW TO TRADE IT — STEP BY STEP
1 — Read the BIAS. The panel shows ▲ BUYERS or ▼ SELLERS IN CONTROL from the CVD. Trade with the side that controls order flow, not against it.
2 — Watch for DELTA DIVERGENCE against the move. Price higher high while CVD makes a lower high = buyers are exhausted → look for shorts. Price lower low while CVD makes a higher low = sellers are exhausted → look for longs. This is the highest-value order-flow reversal signal.
3 — Use ABSORPTION as a reversal cue. When heavy volume fails to move price, the move is being absorbed; watch for the turn and use that gold level as your invalidation line.
4 — Trade the reaction at order-flow levels. Old absorption and divergence levels act as support and resistance — enter when the delta flips back in your favour as price returns to a level.
5 — Confirm with Bar pressure. The panel's ▲/▼ % buy shows the live buy/sell split — take the trade when it agrees with your setup and the bias.
❹ HOW IT WORKS (fully transparent)
Each bar's volume is split by where price closed in its range: buy-volume = volume × (close − low) ÷ range, sell-volume = volume × (high − close) ÷ range, and delta = buy − sell. This is a transparent, range-based volume-delta estimate — it needs no tick or bid/ask feed, so it runs on any symbol. CVD is the running sum of that delta (session-anchored on intraday charts, fully cumulative on daily and higher, handled automatically). Absorption is flagged when volume rises above its average by your chosen multiple while the candle body stays smaller than a fraction of ATR. Divergence compares each confirmed swing pivot in price with the CVD value at that pivot. Every reading comes from closed bars and confirmed pivots — no repainting, no lookahead.
Order flow is strongest on markets with true exchange volume — crypto, stocks, futures and indices — and on intraday timeframes (1m–4h), where buying and selling pressure is most meaningful. On forex, volume is broker tick-volume, so treat the delta as an approximation of order flow rather than exact.
SETTINGS — CVD reset (Session / Week / None), absorption sensitivity, divergence swing length, number of order-flow levels + glow, delta candles on/off, dashboard position.
ALERTS — bullish delta divergence, bearish delta divergence, absorption, and CVD crossing zero (buyers / sellers taking control).
This indicator is an educational market-analysis tool, not financial advice. The volume delta shown here is a transparent estimate from price and volume, not exchange-audited bid/ask order flow, and past behaviour does not guarantee future results. Always confirm with your own analysis and manage your risk.
Indikator
ICT SMC H4 FVG Retest M15 Scalping KillzonesICT SMC H4 FVG Retest — M15 Scalping Killzones
Overview
ICT SMC H4 FVG Retest — M15 Scalping Killzones is a multi-timeframe trading indicator designed to identify structured intraday setups based on:
* Confirmed higher-timeframe Fair Value Gaps
* M15 execution Fair Value Gaps
* ICT-style killzones
* Session highs and lows
* H4 buy-side and sell-side liquidity
* Market or limit-entry models
* Liquidity-based profit targets
The indicator is intended to be used on a 15-minute chart.
Its purpose is not to generate a large number of signals. It is designed to wait for a higher-timeframe imbalance, a valid departure from that zone, and a later retest during an active trading session.
⸻
Core strategy
The standard short setup follows this sequence:
1. A bearish H4 Fair Value Gap is confirmed.
2. Price moves below the H4 FVG.
3. Price later returns to the H4 FVG during an enabled killzone.
4. A bearish M15 FVG forms and overlaps the H4 zone.
5. The M15 candle closes and confirms the setup.
6. The indicator displays the proposed entry, stop-loss and target.
The bullish setup uses the opposite sequence:
1. A bullish H4 FVG is confirmed.
2. Price moves above the H4 FVG.
3. Price later returns to the H4 FVG during an enabled killzone.
4. A bullish M15 FVG forms inside or overlapping the H4 zone.
5. The M15 candle closes and confirms the setup.
6. The indicator displays the proposed entry, stop-loss and target.
The H4 FVG that is created during the initial market displacement is treated as a future retest zone. The indicator does not use the M15 FVGs that formed before the H4 candle was confirmed.
⸻
Non-repainting higher-timeframe logic
The indicator only uses confirmed higher-timeframe candles.
A new H4 FVG is therefore displayed only after the third H4 candle in the three-candle FVG sequence has closed.
This avoids using an H4 imbalance that may appear intrabar and disappear before the H4 candle closes.
The trade-off is intentional:
* the FVG is not shown as confirmed while the H4 candle is still forming;
* once the H4 candle closes, the confirmed zone appears on the M15 chart;
* the indicator then waits for a future retest.
The confirmed HTF FVG is used for signals and alerts. No unconfirmed HTF data is used for trade validation.
⸻
Fair Value Gap definition
Bullish FVG
A bullish FVG exists when the low of the third candle is above the high of the first candle.
The imbalance is the price range between:
* the high of the first candle;
* the low of the third candle.
Bearish FVG
A bearish FVG exists when the high of the third candle is below the low of the first candle.
The imbalance is the price range between:
* the high of the third candle;
* the low of the first candle.
The large middle candle is usually the displacement candle, but its full body is not the FVG. The FVG is only the untraded space between the first and third candles.
⸻
Entry modes
The indicator includes three HTF retest models.
A — Strict retest
Price must first close outside the HTF FVG, then return to the zone.
For a bearish FVG:
* price must close below the FVG;
* price must later return into it.
For a bullish FVG:
* price must close above the FVG;
* price must later return into it.
This is the most selective mode and is the default setting.
A′ — Tolerant retest
A wick outside the HTF FVG is sufficient to validate the departure.
This mode produces more opportunities than the strict model but may accept less decisive departures.
B — Direct tap in killzone
No prior departure from the HTF FVG is required.
A direct touch of the HTF zone during an enabled killzone can become eligible if the remaining entry conditions are satisfied.
This is the least selective mode.
⸻
M15 confirmation
By default, the indicator requires an M15 Fair Value Gap in the same direction as the HTF FVG.
For a short:
* the HTF FVG must be bearish;
* the M15 FVG must also be bearish;
* the M15 FVG must overlap the HTF FVG.
For a long:
* the HTF FVG must be bullish;
* the M15 FVG must also be bullish;
* the M15 FVG must overlap the HTF FVG.
The M15 FVG size filter can be used to ignore very small imbalances.
When Require an M15 FVG is disabled, the indicator can generate a setup from a simple HTF FVG retest during a killzone.
⸻
Candle-close confirmation
The setting:
Validate signals only at M15 close
should normally remain enabled.
When enabled:
* an intrabar M15 FVG is not enough;
* the setup must still be valid when the M15 candle closes;
* triangles and alerts are produced only from confirmed M15 conditions.
This prevents signals from appearing during a candle and disappearing before its close.
⸻
Killzones
Killzones are anchored to the native timezone of each market. They automatically follow daylight-saving changes where applicable.
Asia killzone
Default timezone:
Asia/Tokyo
Default window:
09:00–13:00 Tokyo time
London killzone
Default timezone:
Europe/London
Default window:
07:00–10:00 London time
New York AM killzone
Default timezone:
America/New_York
Default window:
09:30–11:00 New York time
New York PM killzone
Default timezone:
America/New_York
Default window:
13:30–16:00 New York time
Each killzone can be enabled, disabled or adjusted independently.
The background colors only indicate an active trading window. They do not indicate bullish or bearish direction.
⸻
Entry types
Market at close
The proposed entry is the closing price of the confirmed signal candle.
The setup becomes visually active immediately after confirmation.
Limit at FVG edge
The indicator places a theoretical limit entry at the relevant edge of the M15 FVG.
For a bearish setup, the entry is placed at the lower boundary of the bearish M15 FVG.
For a bullish setup, the entry is placed at the upper boundary of the bullish M15 FVG.
If M15 confirmation is disabled, the relevant HTF FVG boundary is used instead.
The limit order remains pending for the selected number of M15 candles. If it is not filled before expiration, the order is cancelled and the HTF zone may become available for a later setup.
⸻
Stop-loss placement
For a bearish setup, the stop-loss is placed:
* above the opposite side of the M15 FVG;
* plus the selected tick buffer.
For a bullish setup, the stop-loss is placed:
* below the opposite side of the M15 FVG;
* minus the selected tick buffer.
When M15 FVG confirmation is disabled, the stop is placed beyond the opposite side of the HTF FVG.
The Stop buffer in ticks setting adds a small safety margin beyond the imbalance boundary.
⸻
Profit targets
The indicator supports two target models.
Liquidity target
When enabled, the indicator searches for the nearest eligible liquidity level in the direction of the trade.
Possible targets include:
* previous Asia session high or low;
* previous London session high or low;
* previous New York session high or low;
* H4 buy-side liquidity;
* H4 sell-side liquidity;
* the current session high or low.
A target must offer at least the selected minimum reward-to-risk ratio.
Fixed R:R fallback
If no eligible liquidity target is available, the indicator uses the selected fixed reward-to-risk ratio.
The default fallback is:
2.0R
⸻
Swept liquidity handling
Two modes are available.
Legacy v3.3
Previously swept session levels and H4 liquidity levels may still be used as targets.
This mode preserves the original behavior of the earlier indicator.
Untouched liquidity only
Once a liquidity occurrence has been swept, it is no longer eligible as a target.
A new pivot or a new completed session may later create a new active liquidity occurrence at the same or a similar price.
This mode is generally more selective because it targets liquidity that has not yet been consumed.
⸻
Session levels
The indicator tracks the highs and lows of:
* Asia
* London
* New York
Each session is calculated in its native timezone, which prevents the levels from drifting when the United Kingdom or the United States changes between standard time and daylight-saving time.
At the end of a session:
* the high and low are frozen;
* their labels remain anchored to the session close;
* the levels can be used as potential liquidity targets.
The number of stored sessions can be adjusted in the settings.
⸻
H4 SSL and BSL levels
The indicator also plots confirmed H4 pivot liquidity.
BSL
Buy-Side Liquidity
Displayed above confirmed H4 swing highs.
SSL
Sell-Side Liquidity
Displayed below confirmed H4 swing lows.
The pivot lookback determines the significance and confirmation delay of these levels.
A larger lookback produces more structurally significant levels, but they are confirmed later.
⸻
Dashboard
The dashboard shows the current state of the setup for both long and short directions.
Three display sizes are available:
* Small
* Medium
* Large
HTF active
A confirmed HTF FVG is currently active in that direction.
HTF departure
Price has moved outside the HTF FVG according to the selected A or A′ departure logic.
In Mode B, a prior departure is not required for the final signal.
HTF retest
The current candle is touching or overlapping the active HTF FVG.
Killzone
The current candle is inside at least one enabled killzone.
M15 FVG
A valid M15 FVG exists in that direction and passes the minimum-size filter.
HTF overlap
The M15 FVG overlaps the active HTF FVG.
M15 close
The current M15 candle is confirmed.
While the live M15 candle is still forming, this field may display No.
Available
No previous trade or pending limit order is currently blocking a new setup.
Raw signal
The structural conditions are satisfied before final trade-availability and candle-close validation.
Signal
All required conditions are satisfied and a valid setup has been produced.
⸻
Signal markers
A confirmed short setup is displayed as:
* a red downward triangle;
* the letter S.
A confirmed long setup is displayed as:
* a green upward triangle;
* the letter L.
The indicator also creates a label containing:
* entry price;
* stop-loss;
* target;
* expected reward-to-risk ratio.
The risk and reward areas are displayed directly on the chart.
⸻
Near-miss labels
The optional Show near misses setting helps diagnose why an otherwise valid-looking setup was rejected.
Possible reasons include:
* LEFT — price has not yet departed from the HTF FVG;
* KZ — the setup is outside an enabled killzone;
* CLOSE — the M15 candle has not yet closed;
* BUSY — a trade or limit order is already active.
Near-miss labels are primarily intended for testing and configuration. They may create visual clutter during normal use.
⸻
Alerts
The indicator provides separate alert conditions for:
* LONG setup detected;
* SHORT setup detected;
* LONG limit order filled;
* SHORT limit order filled;
* target reached;
* stop-loss reached.
For confirmed signals, alerts should be configured to trigger once per bar close.
⸻
Recommended starting configuration
For index futures such as NQ or MNQ:
* Chart timeframe: 15 minutes
* HTF FVG timeframe: 240 minutes
* Entry logic: A — Strict retest
* Require M15 FVG: Enabled
* Validate only at M15 close: Enabled
* Entry type: Limit at FVG edge or Market at close
* Minimum M15 FVG size: adjust to the instrument
* Liquidity mode: Untouched liquidity only
* Minimum target R:R: 1.0–1.5
* Fallback R:R: 2.0
* London killzone: Enabled
* New York AM killzone: Enabled
The Asia and New York PM killzones can be enabled according to the instrument and the trader’s preferred session.
⸻
Practical workflow
1. Apply the indicator to an M15 chart.
2. Confirm that an HTF FVG is active in the dashboard.
3. Wait for price to move away from the HTF FVG.
4. Wait for price to return to the zone during an enabled killzone.
5. Look for a same-direction M15 FVG inside or overlapping the HTF FVG.
6. Wait for the M15 candle to close.
7. Review the proposed entry, stop and target.
8. Confirm the broader market context before placing a trade.
The indicator is best used as a structured decision-support tool rather than as a fully autonomous trading system.
⸻
Important limitations
* A confirmed H4 FVG appears only after the relevant H4 candle closes.
* The indicator will not retrospectively use an M15 FVG that formed before the H4 FVG became confirmed.
* H4 pivot liquidity is confirmed with delay because pivots require candles on both sides.
* If both the stop and target are touched during the same M15 candle, the visual trade logic uses the stop-loss as the conservative outcome.
* The script is an indicator, not a broker emulator or complete backtesting strategy.
* No indicator can guarantee profitability.
⸻
Disclaimer
This indicator is provided for educational and analytical purposes only. It does not constitute financial advice, investment advice or a recommendation to buy or sell any financial instrument.
Trading futures, leveraged products and other financial markets involves substantial risk. Users are responsible for testing the indicator, defining their own risk-management rules and determining whether the methodology is suitable for their trading plan. Indikator

Edo Liquidity SweepsEdo Liquidity Sweeps — Detects Liquidity Sweeps of Swing Highs and Lows and Tracks Each One Through Detected, Confirmed and Faded States
Markets move toward liquidity. Above every relevant swing high rests buy-side liquidity — the stops of short positions and the breakout buy orders waiting there. Below every relevant swing low rests sell-side liquidity — the stops of longs and the breakout sells. Those order clusters act as magnets: very often price travels precisely to reach them. A liquidity sweep is the moment that happens and is rejected — price wicks beyond the level to take the resting liquidity, then closes back on the other side, the classic trap that leaves breakout traders offside and frequently turns price around.
Edo Liquidity Sweeps isolates that single event and, crucially, tracks what happens next. It marks each sweep on the chart and follows it through three clear states — Detected, Confirmed and Faded — so you can separate the sweeps that actually reversed price from the ones that failed, all validated on closed bars so the indicator does not repaint. It is the sweep specialist of the Edolab structure family, designed to pair with Edo Liquidity Zones, which maps the liquidity pools these sweeps take.
LIQUIDITY LEVELS: SWING HIGHS AND LOWS
Everything starts from the swings that define where liquidity sits. A swing high is confirmed when a candle has the highest high of its surroundings; a swing low, the lowest low. The size of that surroundings is set by the Swing Profile: Scalper (5 bars each side) tracks short-term liquidity for intraday work, Swing (10 bars, the default) is the balanced setting for 4H and daily, and Long Term (21 bars) watches only the liquidity of the major structures. Each confirmed swing high becomes a buy-side liquidity level to monitor, and each swing low a sell-side one, until price sweeps it.
SWEEP DETECTION
A sweep is detected, on closed bars only, when price pierces a level with a wick but closes on the opposite side. A bearish sweep: the candle's high takes a swing high (grabbing the buy-side liquidity) but the close stays below that level — price pierced the high and rejected it, an downward reversal is expected. A bullish sweep: the candle's low loses a swing low (grabbing the sell-side liquidity) but the close stays above it — price pierced the low and rejected it, an upward reversal is expected. At detection the indicator draws a dotted line at the swept level with a Sweep ▲ or Sweep ▼ label, and records the high and low of the sweep candle itself, which will later decide whether the sweep confirms or fails. A wick that pierces a level but closes back on the same side generates nothing.
THREE STATES: DETECTED, CONFIRMED, FADED
A sweep is not a one-candle signal. The indicator follows each one through three states, evaluated on every closed bar against the range of the sweep candle. Detected: the sweep has just happened and it is not yet known whether price will turn — a dotted line. Confirmed: price confirms the reversal by closing beyond the sweep candle's extreme in the expected direction — the line turns solid and bold and the label gains a ✓. Faded: price closes the opposite way, reclaiming the level, so the sweep failed — the line turns dashed and faded grey and the label gains a ✕. For a bullish sweep, confirmation is a close above the sweep candle's high and a fade is a close below its low; for a bearish sweep it is the mirror. This follow-through confirmation is what separates the operative sweeps from the anecdotal ones: a Confirmed sweep has proven the rejection had continuation, while a Faded one warns that the trap did not work and the level has genuinely been broken.
INFORMATION PANEL
The panel condenses the read into a compact table. It shows the Last Sweep with its direction (Bull ▲ / Bear ▼) and state, and the live count of sweeps in each state: Detected, Confirmed and Faded. The Confirmed-to-Faded ratio gives a quick sense of how reliable sweeps are behaving on that instrument and timeframe. The panel sits in any of the four chart corners (Top Right by default), comes in three sizes (Tiny / Small / Normal) and two themes (Dark / Light), and can be hidden entirely.
NO REPAINTING
Sweeps are validated on closed bars only and on confirmed pivots, so a level and its sweep never appear or disappear intrabar. A wick that pierces a level but closes back inside generates nothing — the indicator waits for the close. This removes the false signals that clutter tools which mark instantly, at the cost of confirming each sweep once it has completed. There are no higher-timeframe functions: all logic runs on the current chart timeframe.
CONFIGURATION
The inputs are grouped by block. Detection sets the swing profile and the maximum number of sweeps kept on the chart (12 by default). Style exposes the bullish and bearish sweep colours, the faded colour, the label size and the Dark/Light theme. Panel controls panel visibility, position and size. The defaults are calibrated to work without adjustment on stocks, crypto, forex, indices and futures, on any timeframe — the input most users touch is the Swing Profile, to match the sensitivity of the tracked liquidity to their horizon.
ALERTS
Five predefined alerts cover the life of a sweep: Bullish Sweep Detected and Bearish Sweep Detected fire the moment a sweep is detected; Bullish Sweep Confirmed and Bearish Sweep Confirmed fire when a sweep confirms its reversal through follow-through; and Sweep Faded fires when a sweep fails and the level is reclaimed. The Detected alerts are the earliest but least confirmed, the Confirmed alerts are more reliable at the cost of arriving later, and the Faded alert is useful to discard a reversal idea. All alerts fire on bar close, consistent with the indicator's anti-repaint validation.
HOW TO READ IT
Wait for confirmation: a Detected sweep only flags that liquidity was taken and rejected, not that price will turn — waiting for it to become Confirmed reduces false signals at the cost of entering later, and the panel's Confirmed-to-Faded ratio shows how trustworthy sweeps are being. Read the fade as a warning: when a sweep turns Faded, the trap did not work and the level was genuinely broken — recognising a failed sweep in time avoids forcing a reversal idea the market has already rejected. Trade sweeps in confluence: a confirmed sweep that takes liquidity at an important level, a demand zone or a higher-timeframe support is a far more solid reference than an isolated one. And pairing Edo Liquidity Sweeps with Edo Liquidity Zones closes the loop — the zones say where liquidity sits, the sweeps say when it is taken.
OPEN SOURCE
Edo Liquidity Sweeps is published as a free open source indicator. The full Pine Script is publicly accessible on TradingView for study, adaptation and integration into any workflow. Part of the Edolab Markets free tools ecosystem alongside Edo Liquidity Zones, Edo Smart Money Map, Edo Order Blocks, Edo ZigZag Auto Fib SR and more available on TradingView.
This indicator is a technical analysis tool for educational and informational purposes only. It does not generate automatic buy or sell signals and should not be considered financial advice. Trading financial markets involves significant risk of capital loss. Past performance does not guarantee future results. Always use proper risk management.
TAGS
LiquiditySweep SmartMoneyConcepts Liquidity MarketStructure PriceAction StopHunt SwingHighLow SupplyDemand Reversal Overlay Indicator OpenSource Edolab EdolabMarkets Stocks Crypto Forex Indices
CATEGORIES (TradingView dropdowns)
— Direction: Both
— Market category: All markets (Stocks / Crypto / Forex / Indices)
— Analysis type: Trend Analysis / Chart patterns / Support and Resistance
Indikator

Daily Pivot Points - Classic ( S&R Levels )Daily Pivot Points
Classic daily pivot point levels — P, R1, R2, S1, S2 — calculated automatically from the prior session's High, Low, and Close. Levels update at the start of each new trading day and are labeled directly on the right edge of the chart with their exact prices, so you always know where you stand without doing any math.
Levels included:
P — Central pivot (orange)
R1 / R2 — Resistance zones (red)
S1 / S2 — Support zones (green)
R3 / S3 — Extended levels (optional, off by default)
Features:
Right-edge price labels on every level — no guessing
Soft zone fill between R1→R2 and S1→S2 for a clean visual bias
Works on any intraday timeframe (1m, 5m, 15m, 30m, 1H)
Built-in alerts for R1, R2, S1, S2 crosses
Fully customizable colors and line width
How to use:
Pivots are one of the most widely used levels in intraday trading. Price tends to react at these zones — use P as the neutral line, R1/R2 as overhead resistance targets, and S1/S2 as downside support. Watch for rejection or breakout at each level to time your entries and exits.
Lightweight, no repainting, no clutter. Just the levels that matter.
Added concise inline comments explaining:
why lookahead_on + is used (locks levels to prior day at open)
the floor-trader pivot formula logic
why stepline style prevents diagonal artifacts
how the var label + delete-and-redraw pattern keeps the label count clean
the barstate.islast gate
No bloat — just enough for a reader to follow the logic without re-deriving it. Indikator

Session Kill Zone Volume Map [StrixEDGE]Session Kill Zone Volume Map
A session-aware overlay that maps institutional kill zones — London, New York, and Asia — directly onto your chart with volume-weighted session boxes, Opening Range Breakout levels, and a unified analytics dashboard. Built to give intraday traders immediate visual context on where volume clusters, how sessions develop relative to their historical norms, and when a confirmed breakout is underway.
🔍 What This Indicator Does
The indicator automatically detects the three major forex/futures sessions based on UTC time and draws color-coded session boxes whose fill intensity scales dynamically with real-time volume. High-volume sessions appear visually heavier; low-volume sessions fade into the background. This gives you an instant read on whether today's session is running hotter or cooler than average — without checking a single number.
On top of each session, it tracks the Opening Range (first 15, 30, or 60 minutes) and plots ORB-High and ORB-Low levels as dashed reference lines extending through the session. When price breaks an ORB level with volume confirmation, a directional marker (▲ or ▼) prints on the chart and an alert fires.
▲
▼
A single unified dashboard panel consolidates everything: live session volume, percentage distribution with a visual bar, historical average range, ORB win rate, and session sample count — all in one clean table.
⚡ Key Features
Session Auto-Detection
London (08:00–17:00 UTC)
New York (13:00–22:00 UTC)
Asia (00:00–09:00 UTC)
are detected automatically. All session start and end times are fully customizable down to the minute, so you can adjust for DST shifts or align to your broker's server time.
Volume-Weighted Session Boxes
Each session box fills with the session's assigned color at a transparency that adjusts in real time based on cumulative volume relative to the historical session average. A session running at 2× its normal volume will render noticeably more vivid than one at 0.5×. The base transparency is user-controlled.
Opening Range Breakout (ORB) Levels
The indicator captures the high and low of the first N minutes of each session (configurable: 15 / 30 / 60 min) and draws them as horizontal reference lines. These extend through the rest of the session, serving as the breakout thresholds traders watch for directional continuation.
Volume-Confirmed Breakout Signals
When price closes beyond an ORB level and the breakout bar's volume exceeds the 20-period SMA × a user-defined multiplier (default 1.5×), a directional triangle prints on the chart. No volume confirmation = no signal. This filters out low-conviction breaks.
Unified Session Dashboard
A single professional table displays all session data at a glance:
- Live session volume (absolute + percentage share)
- Volume distribution bar per session
- Historical average session range over your chosen lookback
- ORB win rate (percentage of confirmed breakouts that held direction through session close)
- Session sample count
Table position, text size, and visibility are all input-controlled.
Session High/Low Break Alerts
Separate alert conditions fire when price crosses the previous session's high or low with volume confirmation, giving you an additional layer of inter-session breakout detection.
9 Alert Conditions
Individual bull/bear ORB break alerts per session, a unified "any ORB break" alert, and session high/low break alerts — all configurable in TradingView's alert manager.
⚙️ Inputs & Settings
| Group | Setting | Description |
|---|---|---|
| Session Times | Start/End Hour & Minute | Full control over each session's UTC boundaries |
| ORB Settings | Period (15/30/60 min) | Opening range duration |
| ORB Settings | Line Style / Width | Visual style of ORB levels |
| Display | Show/Hide Sessions | Toggle individual session boxes |
| Display | Base Box Transparency | Controls how transparent session boxes are at normal volume |
| Display | Dashboard Position | Table corner placement |
| Display | Dashboard Text Size | Tiny / Small / Normal / Large |
| Display | Stats Lookback | Number of past sessions for avg range and ORB win rate |
| Alerts | Volume Confirm Multiplier | How far above SMA(20) breakout volume must be |
| Colors | Session & Breakout Colors | Full color customization per session and direction |
📖 How To Use
Session Context
Load on a 5m–1H chart. The session boxes immediately frame where London, New York, and Asia operated. The fill intensity tells you which session carried the most conviction — use that to weight your analysis toward the active kill zone.
ORB Strategy
After the opening range completes, the ORB-H and ORB-L lines become your breakout thresholds. A volume-confirmed break (▲/▼ marker) signals directional intent. Traders often look for price to retest the broken ORB level as support/resistance before committing to a continuation trade.
▲
▼
Dashboard Read
Check the Vol % column to see which session is dominating flow. The ORB WR column tells you how reliable ORB breakouts have been historically for each session on the current instrument — if London shows 85% and Asia shows 50%, that's actionable edge for session selection.
Alerts
Set up any of the 9 alert conditions to get notified without watching the chart. Combine the unified "Any ORB Break" alert with a mobile notification for hands-free monitoring.
📋 Notes
- Designed for intraday timeframes (15m and below recommended for ORB accuracy). A warning displays if loaded on Daily or higher.
- During the London/NY overlap window (13:00–17:00 UTC by default), volume is attributed to both sessions. The percentage distribution shows relative contribution, not mutually exclusive slices.
- ORB win rate is a binary metric: did price close beyond the broken ORB level at session end? It does not measure how far price traveled.
- The volume gradient uses transparency modulation, not a multi-stop color gradient, due to Pine Script rendering constraints.
- Works on any instrument with volume data (forex via tick volume, futures, crypto, equities). Indikator

Indikator

ATR Trend Band by ByblloATR Trend Band by Bybllo
This indicator plots a smoothed trend line (the "rope") that only moves once price has traveled beyond an ATR-based threshold from its last position, so small back-and-forth noise is absorbed and the line only steps in the direction of a genuine move. Around that rope line, a stepped upper/lower band tracks the highs and lows of the current directional leg, and the space between the rope and each band is filled with a true color gradient — strong color near the band, fading to transparent near the rope — so the current trend direction and its "room" are visible at a glance. When the rope's direction flips, a short transition window is highlighted with its own color and an optional cloud, so brief reversals or whipsaws are visually distinguished from an established trend.
Key Features
ATR-threshold "rope" smoother: the center line only moves once price has moved beyond (ATR length × ATR multiplier) from the line's current value, filtering out minor noise while still reacting to genuine directional moves.
Stepped upper/lower band that resets to the current high/low on a fresh directional leg and then expands to track the extremes of that leg, with the opposite band computed as rope ± the ATR threshold.
True gradient cloud fill between the rope and each band, with an adjustable steepness control for how quickly the color fades toward the rope line.
Distinct up / down / transition coloring on the rope line and the outer band lines, so the current trend direction is clear without reading numbers.
Optional transition-zone cloud that highlights the short window right after a directional flip, before the new trend is considered established.
Real-price calculation via request.security() keeps the indicator consistent regardless of chart type (Heikin Ashi, Renko, etc.).
How to Use
Treat the rope line's color and slope as the current trend direction; a color change (through the transition color) signals a potential shift in direction.
Use the stepped band as a dynamic support/resistance reference for the current leg — price re-testing the band without breaking the rope's direction can be read as a continuation, while a rope flip against the band suggests the leg may be ending.
Lower the "Gradient Steepness" input for a shorter, more intense color burst near the band edges, or raise it for a smoother gradient spread across the full band width.
Turn on "Show Transition Cloud" if you want the brief post-flip window visually flagged, which can help you avoid reacting to whipsaws immediately after a direction change.
Adjust "ATR Length" and "ATR Multiplier" together to control how sensitive the rope is: a smaller multiplier reacts faster but flips more often, while a larger multiplier is slower but more stable.
Notes
The gradient fill relies on Pine's built-in fill() gradient feature, which is supported across all account tiers (free and paid).
The transition window auto-clears after 5 bars if the rope has not resumed its prior direction, so it always reflects a short, recent window rather than an indefinitely "stuck" state. Indikator

Support & Resistance Confluence Levels, Hold Record & ReversalOVERVIEW
Four lines. Two above price, two below. That is the whole chart.
Every other support/resistance tool has the opposite problem. It finds forty levels and leaves you to work out which two matter. Forty levels is not information, it is wallpaper — and a level you have to hunt for is a level you will not trade.
So this tool inverts the design. It does not ask "where are the levels?" It asks:
WHICH LEVEL WOULD I ACTUALLY TRADE, RIGHT NOW, AND WHY SHOULD I BELIEVE IT?
A price is only promoted to a level when SEVERAL INDEPENDENT METHODS AGREE ON IT. One method finding a level proves nothing — every method finds levels everywhere. The signal is AGREEMENT.
This is a research and framing tool. It is NOT a strategy, NOT a signal service, and NOT a validated edge.
THE SIX VOICES — four propose, two confirm
PROPOSERS. Each nominates candidate prices, independently:
◆ SWING PIVOT the classic. Where price actually turned.
~ KERNEL EXTREMUM the turning point of the SMOOTHED price (Nadaraya-Watson), which is the shape
rather than the noise. This is Lo, Mamaysky and Wang's method, and it finds
structurally different levels from a raw pivot. That independence is exactly
what makes agreement between the two worth something. Agreement between two
methods that make the same mistakes is worth nothing at all.
⇈ HIGHER TIMEFRAME a swing on the HTF. The level a bigger participant is watching.
▣ PRIOR PERIOD yesterday's high and low. Last week's high and low. The most watched prices on
any chart — and missing from almost every auto-S/R script on TradingView.
CONFIRMERS. They do not nominate, they vouch:
▪ VOLUME NODE the level sits where volume actually transacted. Real business was done here,
not merely a turning point.
○ ROUND NUMBER the psychological grid.
Candidates within an ATR tolerance merge, and the merged level inherits every voice that spoke for it. A level needs MIN VOICES to exist at all. Everything below that is DISCARDED, not hidden. Then only the nearest two above and two below are drawn.
The label tells you why the level is there: "◆~▣▪ 4v held 3/4 24,247.00" — four independent voices, tested four times, held three.
AND THEN THE PART NOBODY DOES: WE TEST WHETHER CONFLUENCE ACTUALLY RANKS
"Levels are stronger when several methods agree" is one of the most repeated claims in technical analysis and almost nobody has ever checked it. It is checkable. So the panel reports:
High confluence (3+) +0.24R n=61 PROVEN
Low confluence -0.03R n=88
Control (unconditional) +0.02R n=240
DOES CONFLUENCE RANK? YES — more voices IS better
And the control is DIRECTION-MATCHED. Reversals at support are overwhelmingly LONG on a drifting index — and a long-biased event set compared against a 50/50 control is handed the drift for free and calls it an edge. Longs are compared only with control longs, shorts only with control shorts, and the control is then blended back using the events' OWN direction mix. It is a subtle trap and it will manufacture an edge out of nothing if you let it.
And the verdict is a TEST, not a comparison. High confluence is measured against low confluence with a Welch t-test, and the difference must clear |t| > 1.96 before it is allowed to be a finding. Below that, the panel prints the least satisfying answer there is — NO DIFFERENCE — because that is the honest one. A tool that reports a 0.02R gap as a verdict is not measuring anything, it is decorating.
If the extra voices do not rank on your instrument, then on your instrument they do not rank, and no amount of agreement between methods will change that. That row is the reason this script exists.
THE HOLD RECORD — and why "held 3/4" is not what most scripts mean by it
A TEST IS AN EPISODE, NOT A BAR. Price arrives at the level and the test stays OPEN until price LEAVES it — back the way it came (HELD) or straight through (BROKE). A bar that closes INSIDE the zone has resolved nothing and is counted as nothing.
Counting every touching bar as a completed test drops an entire consolidation into the denominator as failures, and manufactures hold rates near 10% that say nothing about the level and everything about the counter. An unresolved test is neither a hold nor a break, exactly as an unresolved trade is neither a win nor a loss.
AND A TEST IS AN APPROACH, NOT A BAR TOUCHING A BOX. Price exits the zone (HELD), the next bar dips straight back in — and without a re-arm rule that counts as a brand-new test. Chop sitting on a level then logs a hundred "tests" that were really one event. Measured live before this was fixed: 224 tests of a single level on a 5m chart, and hold rates that all landed between 61% and 75% no matter which level you looked at. A statistic that cannot tell any two levels apart is not measuring the levels — it is measuring the bar size. Price must now travel clear of the zone before the level can be tested again. One approach, one test.
The volume filter gates the SIGNAL and never the RECORD. A level that holds on thin volume still HELD. Quietly dropping it from the numerator while leaving it in the denominator is how a hold rate gets manufactured.
IF TWO ZONES OVERLAP, THEY ARE THE SAME LEVEL
The merge tolerance is held to at least the combined zone half-widths. Otherwise two levels a fraction of an ATR apart refuse to merge and then draw overlapping boxes anyway, and the geometry contradicts itself on the chart for anyone to see. It is a small thing that quietly tells you the tool was never looked at.
A LEVEL IS AN ANCHOR, NOT A TRAILING AVERAGE
Levels merge as new candidates arrive, and the merged price is a COUNT-WEIGHTED mean: the tenth candidate moves the level by a tenth of the gap, not half of it. This sounds like a detail. It is not. A level that moves halfway toward every new candidate will slide toward price — because price is where new candidates come from — until it is no longer an anchor at all, but a trailing average sitting in the middle of the action, "tested" on every swing. The maths here is the difference between a level and a moving average with extra steps.
Levels are retired by DISTANCE, and confluence buys REACH. A level far from price is useless however many voices it has; a level at price is what you are trading. But eviction cannot simply drop the weakest, either — every level is BORN with one voice, so a weakest-first rule kills every new level in the cradle, before it can earn a second, and the chart slowly fills with ancient far-away fossils while nothing can form where price actually is. Confluence buys a level the right to be further away. It does not buy it immortality.
THE REVERSAL TRADE — because nobody looks at a level to admire it
Price tests the level and closes back out. Entry at the CLOSE, stop beyond the level, target a fixed R multiple.
ENTRY IS THE CLOSE, for the event and for the control alike. A rejection is a SIGNAL, not a fill.
Entering at the level — a better price — while the control enters at the close hands every level a
free head start, and it would "win" without the level having done anything at all.
THE R MULTIPLE IS FIXED so that the event and the control are measured on IDENTICAL geometry. A
variable target against a fixed-target control is not a comparison: the near target is reached more
often AND resolves inside the grading horizon more often, so the two are not even being asked the
same question.
THE NEXT OPPOSING LEVEL is drawn too, and separately tested: is it reached before the stop, and HOW
FAR AWAY IS IT IN R? A hit rate with no distance attached is a fact about the distance, not about
the levels — a target half a unit of risk away being reached often proves nothing.
Signals fire only at the levels actually on screen. Every level keeps its record; only the ones you are watching can fire. You do not trade a level twelve levels away from price.
And when a level BREAKS, you are told. A level holding is the reversal; a level giving way is the other half of why anyone draws one. Breaks are marked with an x and carry their own alerts — reported as pure information, with no trade framed and no claim made, because the break is not what this engine calibrated. Saying so is cheaper than pretending otherwise.
NON-REPAINT, AND ITS HONEST COST
Pivots confirm some bars late. The kernel extremum confirms a half-window late — a centred kernel looks into the future, and we refuse to. So a level appears some bars AFTER the swing that created it. That lag is the price of not repainting and it is paid deliberately.
Levels, tests, holds, breaks, signals and every calibration event are computed on CONFIRMED bars only. The HTF read uses lookahead_off. Nothing is drawn and then moved.
DATA AND SCOPE
Any symbol, any timeframe. ATR-normalised throughout. Volume improves the score but is NOT required — without it the volume-node voice simply abstains rather than guessing.
HOW TO USE
0. Turn the KEY on once (Dashboard & theme > Show the key). It explains the six glyphs. Turn it off
again — you only need it the first time.
1. MIN VOICES is the one input that matters. 1 gives you the forty-line wallpaper every other S/R
script gives you. 2 requires agreement. 3 shows only the prices several independent methods
arrived at on their own. Raise it until the chart shows levels you would actually trade.
2. Read the hold record. "Held 3/4" tells you more than any colour ever will.
3. READ THE CONFLUENCE VERDICT BEFORE YOU WEIGHT ANY OF IT. If the voices do not rank here, a level
is a LOCATION, not a probability — treat it as context, not as a signal.
4. Wait for the rejection: price into the level, close back out, on real volume.
5. Entry, stop and target are drawn. They are arithmetic, not advice.
ALERTS
Support held · Resistance held · Any rejection · Support broke · Resistance broke
EXPORTS (Data Window — consume from other scripts via input.source())
EXP_Sup1, EXP_Sup2, EXP_Res1, EXP_Res2, EXP_SupVoices, EXP_ResVoices, EXP_Signal, EXP_Entry, EXP_Stop, EXP_Target, EXP_ConfluenceEdge
CONCEPT CREDIT
Support/resistance and polarity are long-standing public trading concepts with no single author; the written tradition runs through Charles Dow, Richard Wyckoff and Edwards & Magee.
The TRADING-RANGE BREAK — the formal S/R rule — was first tested at scale by William Brock, Josef Lakonishok and Blake LeBaron, "Simple Technical Trading Rules and the Stochastic Properties of Stock Returns", Journal of Finance 47(5), 1992. Their findings were later shown to be vulnerable to data-snooping (Sullivan, Timmermann and White, 1999) — which is precisely why this tool MEASURES the rule on your instrument instead of asserting it.
Nonparametric kernel regression for level detection is from Andrew W. Lo, Harry Mamaysky and Jiang Wang, Journal of Finance 55(4), 2000; the Nadaraya-Watson estimator is due to Nadaraya and Watson (1964). ATR — J. Welles Wilder. Triple-barrier forward labelling — Marcos Lopez de Prado. Welch's t-test — B. L. Welch.
The confluence gate, the voice model, the episode-based hold record, the confluence-ranking test and the direction-matched control are the author's own. Clean-room implementation; no third-party Pine code is reused. Not affiliated with, nor endorsed by, any of the above.
HONESTY AND LIMITATIONS
Calibration is IN-SAMPLE, with no costs or slippage, and uses overlapping windows. A proven in-sample edge is NOT a guarantee out-of-sample. Real fills, spreads and commissions will reduce it.
The confluence gate is one rule among many — a different tolerance gives different levels.
Confluence is TESTED here, not assumed. If the panel says the extra voices do not rank, then on this instrument they do not, and no amount of agreement between methods will change that.
Both barriers on one bar: the STOP is assumed first — conservative, and the only assumption that cannot flatter the result. Unresolved trades at the horizon are marked to market, not booked as losses. Nothing is marked PROVEN below t = 1.96, and nothing is rated at all below the minimum sample.
Nothing in this script predicts price.
DISCLAIMER
Research and educational tool only. NOT financial advice, NOT a recommendation, and NO guarantee of results. Entry, stop and target output is arithmetic, not advice. Trading carries risk of loss. Test out-of-sample and make your own decisions. The author accepts no liability for any use. Indikator

Supply & Demand Zones Liquidity & Stop Hunt [LunqFX]Supply and demand zones are where price reacts — but most indicators draw every swing as a box and leave you to guess which one matters. Liquidity Zones ranks them: it marks the key supply and demand zones, scores each one by how much liquidity it holds, and shows whether it is still fresh — so you know which level to trade and which to ignore.
❶ WHAT EACH ZONE SHOWS
Every zone is a coloured block — magenta = SUPPLY (sellers, above), teal = DEMAND (buyers, below) — and carries three readings that are original to this script:
LIQ SCORE (0–100) — how much volume traded inside the zone versus the strongest zone on the chart. 100 = the heaviest zone (the real magnet); a low score = a thin, weak level.
VOLUME ▲ / ▼ — the up-volume vs down-volume that built the zone: did buyers or sellers do the work inside it.
FRESH / TESTED N× — FRESH = price has not returned yet (strongest reaction expected); TESTED N× = already retested N times, weaker each time.
❷ HOW TO TRADE IT
1 — Read the BIAS in the panel. ▲ BUY-SIDE = favour longs, ▼ SELL-SIDE = favour shorts. Trade with it, not against it.
2 — Pick a zone with a HIGH LIQ Score (70+). Low-score zones are thin and unreliable — skip them.
3 — Prefer FRESH zones. A FRESH high-LIQ zone is the highest-probability reaction. A many-times-TESTED zone is more likely to break than hold.
4 — Wait for price to return to that zone. The bright edge line is your reference level.
5 — Enter on the reaction: LONG — bias BUY-SIDE, price drops into a FRESH teal DEMAND zone, LIQ 80, Volume ▲ (buyers dominant). Long on the reaction, stop below the zone, target the next supply zone above. SHORT — bias SELL-SIDE, price rallies into a FRESH magenta SUPPLY zone, LIQ 76, Volume ▼ (sellers dominant). Short on the reaction, stop above the zone, target the next demand zone below.
❸ WHAT TO AVOID
Trading low-LIQ zones — they hold little liquidity. Fading a zone whose Volume split disagrees with its side (e.g. a supply zone built on heavy up-volume) — the level is weak. Chasing a many-times-TESTED zone expecting a clean bounce.
Works on any symbol and timeframe — forex, gold (XAUUSD), indices, crypto and stocks — intraday and higher timeframes alike.
❹ DASHBOARD
The panel lists every zone with its price, LIQ Score, FRESH/TESTED status and side (BUY/SELL), plus a LIQ-weighted overall bias — the full picture at a glance. Optional neon candles can be turned off to keep your own style.
❺ HOW IT WORKS
1 — Swing highs and lows are found from confirmed pivots (closed bars — no repainting). Each swing high opens a supply zone, each swing low a demand zone. 2 — Each zone is a block centred on the swing, its height scaled to ATR so it fits the instrument's volatility. 3 — For every zone the script measures the volume traded inside it, the up/down-volume split, and how many separate times price entered it. 4 — LIQ Score = the zone's volume ÷ the strongest zone's volume, scaled 0–100. 5 — The bias is weighted by LIQ Score, so one heavy zone counts for more than several thin ones — an honest read of whether liquidity leans buy or sell.
No repainting
Zones are built only from confirmed pivots and rendered on the last bar over a fixed lookback. A zone that appears in a screenshot is a zone that was there live — history is never recalculated.
This indicator is an educational market-analysis tool, not financial advice. Zone strength and past reactions describe historical behavior and do not guarantee future results. Always confirm with your own analysis and manage risk. Indikator

Trendline Architect [Quantum Algo]Trendline Architect
====================================================
🔶 OVERVIEW
Trendline Architect is an automatic trendline indicator that does what most trendline tools skip: it validates every line before drawing it, makes each line earn its status through real touches, grades every breakout by quality, and then automates the break-and-retest sequence that trendline traders normally track by hand. Lines are born as dotted candidates, promoted to solid confirmed trendlines only after the market validates them with a third touch, graded on breakout, kept on a retest watch after they break, and paired into parallel channels automatically — all with a deliberately quiet chart: one-letter signals whose full context lives in hover tooltips.
The problem this script solves is trendline spaghetti and trendline noise. Automatic trendline tools typically draw every pivot-to-pivot connection and alert on every violation. This engine rejects invalid lines at birth, refuses duplicates, caps how many lines can exist per side, silences the breaks of unproven lines by default, and filters weak breakouts by grade — so what remains on the chart is only what the market has actually respected.
🔶 WHAT IS A TRENDLINE BREAK AND RETEST?
A trendline connects successive swing points and acts as dynamic support or resistance while price respects it. A breakout occurs when price closes decisively through the line. The retest is what disciplined traders wait for next: price returning to the broken line from the other side and rejecting — old support acting as new resistance, or old resistance reclaimed as support. That return-and-reject is one of the most traded patterns in classical charting, and this engine detects the entire sequence automatically: validated line, graded break, watch window, confirmed retest.
🔶 WHY THIS SCRIPT IS ORIGINAL
1. Geometric validity at birth. A candidate line is rejected before it is ever drawn if any candle close violated the segment between its two anchor pivots. Lines that were never respected never reach the chart.
2. Touch-earned lifecycle. Every line starts as a dotted, untagged candidate. Each validated touch — a wick into tolerance with a close that respects the line — is counted, and only at the configured touch count is the line promoted: solid, thicker, fully colored, with a live ×N touch tag. The chart itself shows which lines the market obeys.
3. Anti-spaghetti engineering. Duplicate candidates with similar slope and position are refused, each side is capped at a configurable number of active lines with the weakest evicted first, and stale lines expire by age. The chart stays readable on every timeframe.
4. Breakout quality grading. Every breakout is scored from three observable components — volume z-score, penetration depth in Average True Range units, and breakout candle body ratio — into grades A, B, and C. Grade A signals highlight in the accent color.
5. A retest engine. Broken lines are not deleted; they turn into gray watch lines for a configurable window. A return to the broken line with a rejecting close prints the Retest signal — the classic polarity flip, automated.
6. Silence by default, depth on demand. Signals print as single letters — B for breakout, R for retest — with the full context (direction, grade, volume, penetration) in the hover tooltip. Two noise filters ship enabled: breaks of unconfirmed lines retire silently, and breakouts below a minimum grade stay off the chart and out of the alerts.
7. Automatic channel detection. When an active support line and resistance line run parallel within a slope tolerance, the engine fills the channel between them and reports it on the dashboard.
8. A live architecture dashboard. Active support and resistance counts, the nearest line with its distance in Average True Range units, a trend read derived from confirmed line slopes, the last break grade, the retest watch count, and channel status — in a compact, fully themeable panel.
🔶 HOW IT WORKS
Line construction: Confirmed swing pivots anchor every candidate line. Each new pivot is paired with the previous same-side pivot, the segment is checked for historical violations, duplicates are rejected, and side capacity is enforced before the line is created.
Touch validation: A touch counts only when the wick enters the tolerance band around the line and the close still respects it. Touches accumulate on the line's tag; the confirming touch promotes the line and, from that point, validated touches are marked with dots.
Breakouts: A close through the line beyond the buffer triggers the break. Confirmed lines produce graded signals; forming lines retire silently when the default filter is on. The broken line converts to a gray dashed watch line.
Retests: Within the watch window, a return to the broken line with a rejecting close prints R — upward reclaim of broken resistance, or downward rejection at broken support. Watch lines that see no retest expire quietly.
Channels: Active opposite-side lines are compared by slope; the closest parallel pair within tolerance is filled as a channel.
Non-repainting: Pivots require confirmation, and all touches, promotions, breaks, and retests are evaluated on closed bars only. Once printed, nothing moves.
Chart hygiene: Completed lines, touch dots, and signals are all capped by input, keeping the chart clean and the auto-scale anchored to current price.
🔶 HOW TO USE IT
1. Works on any market — cryptocurrency, forex, gold, indices, stocks, futures — and any timeframe. Raise the pivot length for larger structures.
2. Trust the visual hierarchy: dotted lines are candidates, solid lines with ×N tags are market-validated, gray dashed lines are broken and on retest watch.
3. Treat B signals as regime information: grade A breakouts with volume and penetration carry far more weight than the minimum-grade ones, and the grade is one hover away.
4. The R signal is the classic entry location: the broken line has flipped roles and price has confirmed the flip. Stops belong on the far side of the retested line.
5. Use the dashboard's Nearest row to know how far price is from the closest active line in Average True Range units before it gets there.
6. If you want the raw, unfiltered feed, disable the two noise filters in Signals — the engine detects everything either way.
🔶 SETTINGS
- Detection: pivot length, maximum anchor span, active lines per side, line expiry, completed lines to keep.
- Touches, breaks and retests: touch tolerance, touches to confirm, breakout buffer, retest watch window.
- Signals: breakout and retest toggles, confirmed-lines-only filter, minimum breakout grade.
- Channel detection with slope similarity tolerance.
- Full color customization, extension length, touch dots toggle.
- Themeable dashboard: position, four text sizes, title band, background, frame, grid, and three text colors.
🔶 ALERTS
- Trendline Confirmed — a line collected its confirming touch.
- Bullish / Bearish Trendline Breakout — a qualified close through a line, honoring the grade filter.
- Bullish / Bearish Retest Confirmed — a broken line was retested and rejected.
- Parallel Channel Detected — an active support and resistance pair is running as a channel.
🔶 FREQUENTLY ASKED QUESTIONS
Does the indicator repaint? No. Anchors are confirmed pivots and every touch, break, and retest is evaluated at bar close. Pivot confirmation introduces intentional lag equal to the pivot length.
Why do I see so few lines? By design. Between geometric validation, duplicate rejection, side caps, and expiry, only lines with genuine market respect survive. Raise the per-side cap or lower the confirmation count for a busier chart.
What do B and R mean? B is a graded breakout and R is a confirmed retest of the broken line. Hover either label for direction, grade, volume, and penetration details.
Why did a breakout print no signal? Either the line was still unconfirmed while the confirmed-only filter is on, or the break graded below your minimum. The line still changed state; only the signal was filtered.
What makes a grade A breakout? Elevated volume, deep penetration beyond the line in Average True Range terms, and a strong-bodied breakout candle — all three together.
🔶 CREDITS
Trendline analysis, breakout trading, and the break-and-retest pattern are classical charting techniques in the public domain, refined by generations of technicians. This script gratefully acknowledges that shared lineage. The geometric validity engine, touch-earned lifecycle, breakout grading model, retest watch engine, channel detection, noise-filtering architecture, and all code in this script are original work — no third-party or open-source script code was reused.
🔶 LIMITATIONS
Trendlines are geometry, not guarantees: valid lines break and graded breakouts fail. Pivot confirmation delays anchor recognition by design. Volume grading is less meaningful on symbols with unreliable volume reporting. Channel detection reports the closest parallel pair, not every possible channel. No indicator replaces independent analysis.
🔶 DISCLAIMER
This script is provided strictly for educational and informational purposes. It is not financial advice, an investment recommendation, or a solicitation to buy or sell any financial instrument. Past behavior of any trendline, breakout, or retest does not guarantee future results. Trading involves substantial risk. Always do your own research and manage risk independently.
Indikator

True Order Blocks & Liquidity LevelsTrue Order Blocks & Liquidity Levels — a comprehensive price action toolkit for market structure analysis, liquidity mapping, and institutional zone detection across any instrument and timeframe.
The logic behind order blocks, imbalances, and internal pullbacks is built in strict accordance with the inside bar methodology — one of the most precise approaches to identifying institutional points of interest. Every module accounts for whether a bar is an inside bar, which significantly improves signal quality and eliminates false zones that commonly appear with traditional approaches.
━━━━━━━━━━━━━━━━━━━━━━━━━━━━━━━━━━━━━━━━
MODULES
━━━━━━━━━━━━━━━━━━━━━━━━━━━━━━━━━━━━━━━━
▸ Internal Pullbacks
Displays market structure as lines connecting sequential pivot highs and lows. Inside bars are ignored during structure building, keeping pullback lines clean and noise-free. The last open line redraws in real time as price develops.
Adjustable number of visible lines
Color, style (solid / dashed / dotted) and width customization
▸ Internal Liquidity
Horizontal lines automatically placed at each confirmed pivot high and low. A line persists until price crosses it — at that moment the line is removed and an alert fires. These levels mark clusters of stop orders and serve as potential targets for liquidity sweeps.
Independent limit on the number of visible levels
Color and style customization
Alert on level breach
▸ Imbalance (FVG)
Fair Value Gap detector built on three consecutive non-inside bars. The algorithm steps over inside bars when searching for the FVG — this means the gap can span more than 3 candles visually if inside bars appear in between, which is intentional and produces cleaner zones. Open-price gaps are handled by clipping FVG boundaries to the body of the middle candle.
Separate colors for bullish and bearish FVG zones
Maximum number of displayed zones
Midline drawn inside each zone for easier reference
▸ Order Blocks
Institutional interest zones formed by a strict algorithm: an order block is drawn only when the bar preceding a FVG performed a liquidity sweep — meaning it broke the high or low of the prior significant pivot. The block is placed on the candle immediately preceding the impulsive move. If an absorption candle stands between the OB candidate and the FVG, the candidate is reset — preventing false blocks from forming on overly aggressive moves.
Automatic mitigation tracking: when price touches the zone, the block changes to a "mitigated" color
Option to hide mitigated blocks entirely
Separate colors for bullish, bearish, and mitigated blocks
Adjustable history depth
Alerts on new block formation and on mitigation
▸ Inside Bars
Highlights bars that fit entirely within the range of the previous mother candle. A series of consecutive inside bars signals compression and accumulation ahead of a directional move.
Barcolor highlight with customizable color
Adjustable lookback depth
▸ Absorption
Marks candles that fully engulf the range of the previous mother candle (high > mother high and low < mother low). These candles often indicate absorption of accumulated positions and a short-term shift in intent.
Separate highlight color independent of Inside Bars
Alert on absorption candle formation
▸ PDH / PDL — Previous Day High & Low
Displays high and low levels from previous trading days (up to 7 days). Levels that have been fully engulfed by price are automatically hidden. Each level is labeled: the most recent is marked "PDH" / "PDL", older ones show the date in month/day format.
Adjustable number of days displayed
Unified color for all PDH/PDL levels
Alert when price crosses a level
▸ Market Sessions
Draws session boxes for each trading session over the last N days. Five fully independent sessions are supported — defaults are Asia, Frankfurt, London, New York, and one custom user-defined session.
Custom name, start and end time (UTC), and background color per session
Optional horizontal border lines showing session high and low
Border style and width customization
Adjustable display depth (number of days)
Alerts when price crosses the high or low of a closed session
━━━━━━━━━━━━━━━━━━━━━━━━━━━━━━━━━━━━━━━━
TREND FILTER
━━━━━━━━━━━━━━━━━━━━━━━━━━━━━━━━━━━━━━━━
Colors the chart background based on WaveTrend oscillator alignment across up to three independent timeframes. When all selected timeframes show WT above zero simultaneously — bullish background. When all show WT below zero — bearish background. When timeframes disagree — no background, signalling an unclear or transitional market state.
How WaveTrend is calculated: WT is built as a double-smoothed normalized channel index on HLC3. The first EMA measures the average deviation of price from its mean; the result is normalized and smoothed again to produce the final oscillator value. Values above zero indicate bullish bias, below zero — bearish.
Show trend filter — master on/off switch
WT Channel Length — EMA length for channel calculation. Shorter = more reactive
WT Average Length — smoothing EMA applied on top. Larger = calmer signal
TF 1 / TF 2 / TF 3 — each row has an enable toggle and a timeframe selector. Defaults: 15m, 1h, 4h. A disabled timeframe is treated as neutral and excluded from alignment check
Confirm trend on bar close — when enabled, background and alerts only react to values from the last closed HTF bar, eliminating intra-bar repainting. When disabled, the background updates in real time as the HTF bar forms
Bullish / Bearish background colors — customizable with transparency
Trend Changed alert — fires on bar close on any of the six possible state transitions: uptrend ↔ neutral ↔ downtrend and direct flip. Alert message specifies the exact transition
━━━━━━━━━━━━━━━━━━━━━━━━━━━━━━━━━━━━━━━━
DASHBOARD
━━━━━━━━━━━━━━━━━━━━━━━━━━━━━━━━━━━━━━━━
A compact table showing WaveTrend values for each enabled timeframe. Only enabled timeframes are displayed — from one to three rows.
Column 1: timeframe label (15m, 1h, 4h etc.)
Column 2: current WT value rounded to one decimal. Cell background reflects signal strength: neutral grey (−10 to +10), weak green/red (±10 to ±40), saturated green/red (beyond ±40)
Position — 9 placement options across the chart
Text size — Tiny / Small / Normal / Large
━━━━━━━━━━━━━━━━━━━━━━━━━━━━━━━━━━━━━━━━
ALERTS
━━━━━━━━━━━━━━━━━━━━━━━━━━━━━━━━━━━━━━━━
Every module has its own independent alert toggle. All messages can optionally be prefixed with the instrument ticker — useful when monitoring multiple charts simultaneously.
Liquidity level breached
Absorption candle formed
New order block created
Order block mitigated
Session high or low crossed
PDH / PDL level crossed
Trend changed (WaveTrend multi-TF)
Indikator

Liquidity Sweep & Stop-Hunt Signals [ForexCracked]🔵 OVERVIEW
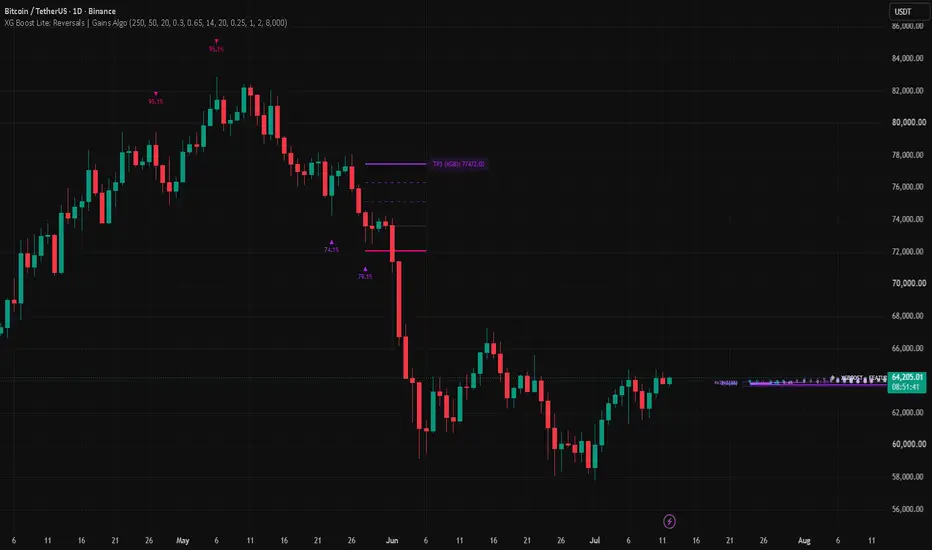
Liquidity Sweep & Stop-Hunt Signals marks the price levels where stop orders pile up, detects the moment price runs those stops and reverses, and prints a BUY or SELL with a ready-made entry, stop and target. It is a focused reversal tool built around one of the most reliable behaviours in the market: the failed breakout.
Every signal confirms on candle close, so nothing repaints after the bar is done. A live dashboard shows the higher-timeframe bias, the last signal, and the current trade plan.
🔵 WHAT A LIQUIDITY SWEEP ACTUALLY IS
Stops cluster in obvious places: just above a recent swing high (buy-side liquidity) and just below a recent swing low (sell-side liquidity). Price is often drawn to those pools because that is where resting orders sit.
A sweep, or stop hunt, happens when price spikes through one of those swings, triggers the stops, and then closes back inside the range on the same candle. Breakout traders get trapped, and the reversal that follows is the trade this tool is built to catch.
🔵 HOW IT FINDS SIGNALS
• It tracks recent swing highs and lows as liquidity lines and keeps them on the chart until they are taken
• A SELL fires when a candle's high runs above a tracked swing high but its close falls back below it (buy-side liquidity swept, then rejected)
• A BUY fires when a candle's low runs below a tracked swing low but its close climbs back above it (sell-side liquidity swept, then rejected)
• An optional rejection-body filter ignores weak wicks and only accepts sweeps that close with a real body back inside the level
• An optional higher-timeframe EMA bias lets you take only trend-aligned sweeps, only counter-trend sweeps, or all of them
🔵 THE TRADE PLAN IT DRAWS
On every signal the tool draws three lines and labels them:
• Entry at the close of the sweep candle
• Stop just beyond the swept wick, with an ATR buffer so normal noise does not clip it
• Target at your chosen reward-to-risk multiple of that stop distance
You get a complete plan on the chart the moment a signal prints, with the exact prices in the label.
🔵 SETTINGS
• Swing Strength: how major a swing must be to count as liquidity (higher = fewer, cleaner levels)
• Levels Tracked: how many liquidity lines to keep per side
• Trend Filter: All sweeps, HTF trend only, or Counter-HTF only
• HTF Bias Timeframe and EMA Length: the higher-timeframe trend reference
• Require Rejection Body and Min Rejection Body (x ATR): quality filter for the sweep candle
• Stop Buffer (x ATR) and Reward : Risk: the trade-plan geometry
🔵 HOW TO USE
• Start on H1 or H4 for forex, gold and indices, with the HTF bias set one or two steps higher
• Treat a swept level plus a strong rejection close as the signal, not the wick alone
• Use Counter-HTF only when you want pure reversal setups at range extremes, and HTF trend only when you want continuation entries after a stop-run against the trend
• Size every trade off the drawn stop distance at a fixed account risk
• Raise Swing Strength on noisy pairs so only the meaningful liquidity gets tracked
🔵 BEST AND WEAKEST CONDITIONS
✅ Strongest at range extremes, session highs and lows, and around prior day or week highs and lows, where liquidity genuinely rests
⚠️ Weakest in fast one-way trends with no pullbacks, and on very low timeframes where every wick looks like a sweep
⚠️ DISCLAIMER
This tool identifies liquidity sweeps and marks reversal setups. It does not predict price. A swept level is a probability, not a certainty, and sweeps can extend further before reversing. Results depend on market conditions, settings, and your own execution and risk management. Shared for educational and research purposes; not financial advice. Indikator

Liquidity Rails @darshaksscLiquidity Rails projects dotted liquidity lines from every confirmed swing pivot — sellside
liquidity above prior highs, buyside liquidity below prior lows — and automatically removes
each line the moment price sweeps through it, giving an always-current liquidity map instead
of a cluttered chart full of old, already-swept levels.
🔶 HOW IT WORKS
Every confirmed pivot high spawns a dotted line projecting forward, labeled "Sellside
liquidity." Every confirmed pivot low spawns a dotted line labeled "Buyside liquidity." Nearby
levels of the same type (within an ATR-based tolerance) automatically merge into a single
line with a touch count, instead of stacking overlapping duplicate labels. The moment price
closes through a level, that line is deleted — swept liquidity doesn't linger on the chart.
🔶 HOW TO USE
- Red dotted line above price = resting sellside liquidity (prior high).
- Green dotted line below price = resting buyside liquidity (prior low).
- A line disappearing = that level was just swept by price.
- "×2 / ×3" on a label = multiple nearby swing points clustered into one liquidity zone.
🔶 SETTINGS
Swing Lookback (pivot sensitivity), Max Tracked Lines, ATR-based label offset, Merge Nearby
Levels tolerance, custom colors.
🔶 LIMITATIONS
Pivot confirmation requires right-side bars, so lines appear with an inherent lag — standard
for any non-repainting pivot-based tool. In fast trending markets many lines can appear and
sweep in quick succession; increase Max Tracked Lines or Swing Lookback for a calmer view.
This script is 100% original, open-source (MPL 2.0), and does not repaint.
For educational/informational purposes only. Not financial advice. Past performance does
not guarantee future results. Always use proper risk management. Indikator
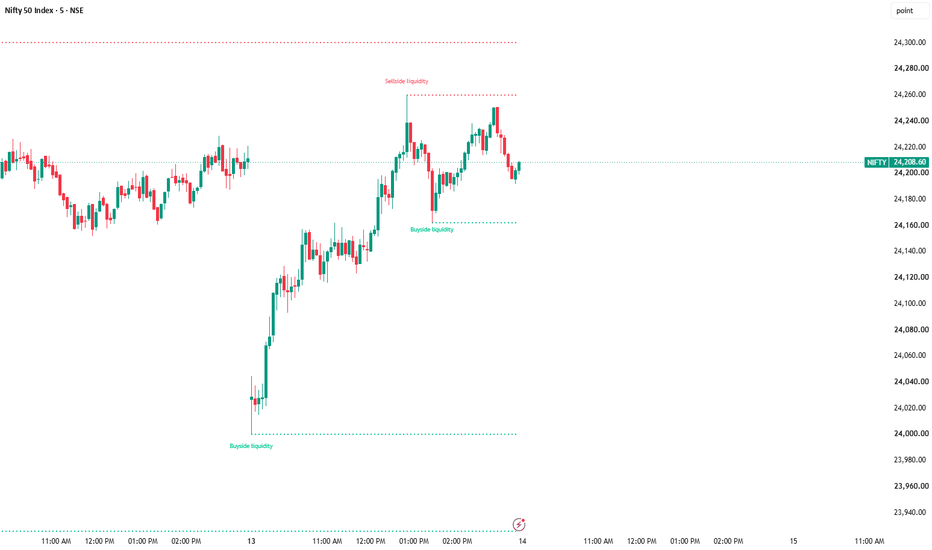
Liquidity Sweep & Golden Zone [StrixEDGE]Overview
Liquidity Sweep & Golden Zone is a multi-timeframe structural analysis tool built for traders who use Smart Money Concepts (SMC) and ICT methodology. It identifies liquidity sweeps at confirmed swing levels, maps the Fibonacci Golden Zone (OTE), and presents a real-time confluence dashboard across 15-minute, 1-hour, 4-hour, and daily timeframes.
The indicator answers three questions at a glance: where is the liquidity?, has it been swept?, and do multiple timeframes agree on direction?
How It Works
Liquidity Sweep Detection
The engine tracks confirmed swing highs and swing lows using pivot detection. These pivots represent resting liquidity pools — areas where stop-loss orders accumulate:
- Buy-Side Liquidity (BSL) sits above swing highs, where short sellers place their stops. When price wicks above a swing high and closes back below, a BSL sweep is triggered — signaling that buy-side stops were hunted. This typically precedes bearish continuation.
- Sell-Side Liquidity (SSL) sits below swing lows, where long traders place their stops. When price wicks below a swing low and closes back above, an SSL sweep is triggered — signaling that sell-side stops were hunted. This typically precedes bullish reversal.
Each sweep event displays the estimated volume in USDT at the moment of the sweep. This is calculated as `volume × close` on the sweep bar and serves as a proxy for the magnitude of liquidations that occurred. Higher volume sweeps tend to produce stronger reversals.
After a sweep, the level is updated to the new extreme — preventing duplicate signals and establishing a fresh liquidity reference.
Support & Resistance (Pivot-Based)
Active (un-swept) pivot levels are drawn on the chart as structural Support and Resistance:
- A line extending from the bar where the pivot formed to the current price area
- A zone band (ATR × 0.15) around the level, representing the area of influence
- Origin labels showing "Buy-Side Liquidity SWEEP" or "Sell-Side Liquidity SWEEP" with the USDT volume
- Price labels on the right edge for quick reference
These levels update dynamically: when a new pivot is confirmed, the line starts from the new origin. When a sweep occurs, the level shifts to the sweep bar.
Golden Zone (Fibonacci OTE: 0.618 – 0.786)
The Golden Zone represents the Optimal Trade Entry area — the 61.8% to 78.6% Fibonacci retracement of the most recent price range. Unlike pivot-based calculations, this indicator uses a **lookback-based approach**: it finds the highest high and lowest low over a configurable number of bars, then derives the zone from that range.
The zone is visualized with:
- A filled box between the 0.618 and 0.786 levels (transparency adjustable)
- Dashed border lines at 0.618 and 0.786
- A dotted midline at the 0.702 level
- Price labels showing exact values
- A centered "GOLDEN ZONE" tag
This approach produces a stable, always-visible zone that doesn't depend on individual pivot detection, making it reliable across all market conditions.
Multi-Timeframe Heatmap
The core of this indicator is a 7-column heatmap table that evaluates market conditions across four timeframes simultaneously:
| Column | What It Shows | Bullish | Bearish |
|--------|--------------|---------|---------|
| SWEEP | Recent liquidity sweep direction | ● BULL (SSL swept) | ● BEAR (BSL swept) |
| GZ | Price position relative to Golden Zone | ▲ ABOVE | ▼ BELOW |
| S/R | Price position vs. pivot S/R midpoint | ▲ BULLISH | ▼ BEARISH |
| BIAS | EMA 21/50 trend direction | ▲ BULL | ▼ BEAR |
| RSI | RSI(14) value with decimal precision | Color-coded by zone | Color-coded by zone |
| SIGNAL | Composite of all conditions | LONG ▲ | SHORT ▼ |
Signal Logic: The SIGNAL column counts four conditions per timeframe — RSI above/below 50, price in/above the Golden Zone, price above/below the S/R midpoint, and EMA bias direction. When 3 or more conditions align bullish, the signal reads LONG. When 3 or more align bearish, it reads SHORT. Otherwise, NEUTRAL.
A confluence bar at the bottom aggregates all timeframes. When the majority of conditions across all four timeframes agree, it displays STRONG BULLISH or STRONG BEARISH CONFLUENCE.
RSI Color Coding
| RSI Range | Color | Meaning |
|-----------|-------|---------|
| > 70 | Orange | Overbought |
| 50 – 70 | Green | Bullish momentum |
| 30 – 50 | Red | Bearish momentum |
| < 30 | Blue | Oversold |
Settings
Structure Settings
| Setting | Default | Description |
|---------|---------|-------------|
| Pivot Lookback Length | 5 | Bars left and right to confirm a swing pivot. Higher values produce fewer but stronger levels |
| Sweep Active Memory | 10 | How many bars a sweep signal remains active on the heatmap after detection |
Golden Zone
| Setting | Default | Description |
|---------|---------|-------------|
| Lookback Period | 20 | Number of bars to find highest high and lowest low for Fibonacci calculation |
| Show Golden Zone | On | Toggle zone visibility on chart |
| Fill Golden Zone | On | Shade the area between 0.618 and 0.786 |
| Fill Transparency | 88 | Opacity of the filled zone (50–98) |
| Golden Zone Color | Gold | Color for all Golden Zone elements |
Support & Resistance
| Setting | Default | Description |
|---------|---------|-------------|
| Show S/R on Chart | On | Toggle S/R lines, zone bands, and labels |
| Support Color | Teal | Color for support level and SSL elements |
| Resistance Color | Red | Color for resistance level and BSL elements |
| Line Width | 2 | Thickness of S/R lines (1–4) |
| Line Style | Solid | Solid, Dashed, or Dotted |
| Show Price Labels | On | Display price values at the right edge of each level |
Sweep Event Labels
| Setting | Default | Description |
|---------|---------|-------------|
| Show Sweep Labels | On | Toggle sweep event markers on chart |
| Bullish Sweep Color | Green | Color for SSL sweep labels (bullish reversal) |
| Bearish Sweep Color | Red | Color for BSL sweep labels (bearish reversal) |
Heatmap Table
| Setting | Default | Description |
|---------|---------|-------------|
| Show Heatmap Table | On | Toggle the entire dashboard |
| Table Position | Top Right | 9 position options across the chart |
| Table Cell Size | Normal | Tiny, Small, Normal, Large, or Auto |
Alerts
Five alert conditions are built in and ready to use:
1. Bullish Liquidity Sweep — SSL swept, potential bullish reversal
2. Bearish Liquidity Sweep — BSL swept, potential bearish reversal
3. Bull Sweep + Golden Zone — SSL swept while price is inside the OTE zone (high-probability long)
4. Bear Sweep + Golden Zone — BSL swept while price is inside the OTE zone (high-probability short)
5. Price in Golden Zone — Price enters the 0.618–0.786 zone on any bar
Disclaimer
This indicator is a technical analysis tool designed to assist in identifying potential areas of interest based on market structure and liquidity concepts. It does not constitute financial advice. The USDT volume figures are approximations, not verified liquidation data. Always use proper risk management and combine this tool with your own analysis. Past performance of any signal or pattern does not guarantee future results. Trade at your own risk. Indikator

XG Boost Lite: Reversals | GainzAlgoWe are excited to release this indicator, which uses our brand-new Arbor library for gradient boosting! This engine brings true, high-performance machine learning natively into Pine Script v6, bypassing the need for external webhooks or API layers. By utilizing iterative, tree-based models on your chart, XGBoost Lite: Reversals adapts directly to the historical structure of the asset you are trading, identifying precise pivot exhaustion points with high statistical conviction.
🧠 Understanding Gradient Boosting & XGBoost
To trade successfully with machine learning, it helps to understand exactly what is happening beneath the hood of the asset's data.The Core TheoryGradient Boosting is a powerful machine learning technique used for regression and classification tasks. Unlike deep learning networks that process data through abstract node layers, gradient boosting relies on an ensemble of simple decision trees, often called "weak learners" or "stumps".
The training process works sequentially:
The Initial Guess: The model makes a basic baseline prediction.Calculating the Error (Residuals): It checks where its prediction missed the actual historical market outcome.
Correcting the Mistakes: A new decision tree is built specifically to predict those errors (the gradient of the loss function).
Iterative Learning: The model repeats this process for several rounds. Each new tree focuses entirely on correcting the flaws of the previous ones, scaling its adjustments by a Learning Rate to maintain stability.
What Makes XGBoost Special?
XGBoost (Extreme Gradient Boosting) optimizes this framework for speed, scalability, and performance. It applies strict regularization techniques to minimize overfitting, ensuring the model doesn't just "memorize" past market noise but instead learns genuine structural behaviors.By evaluating multiple market features simultaneously, it estimates the probability of a specific event occurring.
🛠️ About the Indicator
XGBoost Lite: Reversals is a machine learning-driven technical indicator designed to catch exhaustion and reversal setups.
The Machine Learning Pipeline
Dual Engines: The script fits four separate models simultaneously—a classifier and a regressor for Longs, and a classifier and a regressor for Shorts.
Dynamic Retraining: Rather than remaining static, the model automatically flushes its memory and retrains its internal mathematical weights every n bars to adapt to evolving market regimes.
Strict Non-Repainting Execution: A critical upgrade in this framework forces features and calculations to compute and lock strictly on bar close. Signals, dynamic entry points, and risk metrics are only printed once the triggering candle is finalized, ensuring what you see on the historical chart matches real-time execution perfectly.
The Core Features Evaluated
The model processes a combination of multi-dimensional market inputs to generate a unified prediction:
RSI (14): Evaluates traditional momentum expansion and contraction.
Relative Volume (20): Evaluates institutional engagement by dividing current volume against its 20-period SMA.
Z-Score (20): Measures how far the current price has deviated from its statistical mean.
ADX (14): Gauges the overall strength of the macro trend to prevent trading directly into a runaway freight train.
📊 How to Use the Indicator
The Real-Time Dashboard: When applied to your chart, the indicator renders an advanced Feature Importance Scatter Plot in the right-hand margin.
Distribution Scatter: The horizontal bars plot the historical density of successful signals. Darker, tightly packed nodes represent highly concentrated, high-probability clusters discovered by the algorithm.
Visualizing Signals
When a market pivot is detected (e.g., a structural swing low or high) and the classifier hits your target confirmation probability, a signal arrow prints on the chart displaying the mathematical certainty ($e.g., 74.2\%$) of the reversal.
⚙️ The Settings Inputs
The indicator’s interface is neatly categorized into three primary functional groups:
⚙️ XGBoost Model Settings:
Training Lookback (Bars): (Default: 250) The historical window used to feed the training arrays. Max capped at 300 to remain computational within Pine Script limits.
Retrain Frequency: (Default: 50) Determines how often (in bars) the model recalibrates its trees. Boosting Rounds: (Default: 20) The number of sequential trees (stumps) trained per model. Higher numbers capture deeper complexities but risk overfitting.
Learning Rate: (Default: 0.3) The step size applied to each boosting round to prevent the model from learning too quickly. Min Probability for Signal: (Default: 0.65) The minimum confidence threshold ($65\%$) required from the classification model to trigger an active trade.
ADX Length / Minimum Filter: (Default: 14 / 20.0) Prevents counter-trend signals if the prevailing macro trend is too strong.
🛡️ Target & Risk Management
SL Wick Buffer ×ATR: (Default: 0.25) Sets how much breathing room is given below a swing low wick or above a swing high wick, scaled by ATR.
TP1 ×Risk (R-multiple): (Default: 1.0) Targets a clean 1:1 Risk-to-Reward ratio for the initial profit take.
TP3 Min ×Risk (Floor): (Default: 2.0) The minimum target floor for the machine learning regression objective.
Break-Even After TP1: (Default: True) Automatically moves the Stop Loss to the exact entry price the moment TP1 is captured, eliminating risk on the remainder of the trade.
📈 How to Trade the Indicator
Trading with the machine learning model requires blending quantitative probabilities with standard structural execution:
The Entry: Wait for a Bullish (Neon Purple) or Bearish (Neon Pink) arrow to finalize on a closed candle. The percentage printed indicates the model's confidence.
Placing Risk: The system automatically draws a solid line anchoring your Stop Loss tightly to the local structural wick pivot, applying an ATR buffer to account for minor noise.
Scaling Targets:
Target 1 (TP1): Landed at a symmetrical 1:1 distance. When hit, the indicator dynamically updates your Stop Loss to your entry line, locking in a "scratch-or-better" runner.
Target 2 (TP2): Represents the mathematical midpoint between your baseline risk and the macro ML objective.
Target 3 (TP3): Driven directly by the XGBoost Regression Model. The regressor estimates the potential mathematical expansion based on current market features—if volatility is expanding, TP3 will automatically stretch further to ride major trend changes.
📊 Deep Dive: The Feature Importance & Scatter Plot Dashboard
The dashboard rendered on the right side of the chart acts as the "brain" of the indicator. It provides real-time transparency into exactly how the machine learning model is weighing data and evaluating current market conditions.
Feature Importance Bars (The Relative Weights): The horizontal progress bars display the mathematical percentage weight allocated to each of the four indicators processed during the model's most recent training cycle. These values change dynamically every time the model triggers a retraining block (default: every 50 bars) as it adapts to shifting market conditions. For example, if the market moves into a heavy trending phase, you will notice metrics like the ADX or Z-Score capture a higher percentage of the model's attention, whereas the RSI will frequently become the dominant driver if the asset is range-bound.
The Holographic Scatter Plot (Historical Feature Density): Layered over the progress bars is an advanced distribution scatter plot consisting of individual circular glyphs (○, ◉, ●) that plot a rolling record of the last 30 historical signal points. The horizontal position of each dot shows exactly where the feature value landed relative to its historical extremes (0 on the far left, 1 on the far right). The script introduces a subtle vertical "jitter" to separate these dots so you can visually identify high-density clusters where successful reversal setups frequently occur, while the shifting style of the glyphs flags tightly packed clusters of solid nodes (●) to indicate highly concentrated mathematical sweet spots discovered by the XGBoost classifier.
Indikator

GMS Session Rays (Sydney/Asia/London/NY)A lightweight Pine v6 indicator that plots the previous completed session’s High and Low for the four major sessions—Sydney, Asia, London, New York—so you always see the most actionable structure levels without chart clutter. Lines auto-update at the end of each session and extend right as horizontal rays. Labels are clean, stack automatically to avoid overlap, and can be placed on the left or right side of the chart.
What it shows
Previous session High/Low for each enabled session (not the current live session).
Right-extended rays at those prices, updated when the session closes.
Optional labels per session (e.g., “sydney high”, “london low”), with auto-stacking to prevent overlaps.
Customization
Per-session toggles: show/hide each session; show/hide labels per session.
Style controls: color, width, and line style (Solid/Dotted/Dashed) per session.
Label controls: global on/off, Left/Right placement, bars offset, Y-offset (in ticks), size (Tiny/Small/Normal), auto-stacking with adjustable step.
Session windows: editable HHMM-HHMM for Sydney/Asia/London/NY.
Timezone: set a single indicator timezone (default America/New_York).
Only Today mode: clears older rays daily to keep charts minimal.
How it works (under the hood)
Tracks High/Low only while a session is active; when it ends, those values are frozen and plotted as the previous session levels. Indikator

Classic Pattern EngineIs a chart-pattern detection tool built around confirmed swing pivots.
The script identifies selected classic chart-pattern structures and draws them directly on the chart. It is designed as a visual pattern-mapping tool, not as an automated trading system.
What the script detects
Reversal patterns:
- Double Top
- Double Bottom
- Triple Top
- Triple Bottom
- Head and Shoulders
- Inverted Head and Shoulders
Continuation / structure patterns:
- Rectangles
- Ascending Triangle
- Descending Triangle
- Symmetrical Triangle
- Rising Wedge
- Falling Wedge
- Bull Flag
- Bear Flag
- Bullish Pennant
- Bearish Pennant
How it works
The script uses confirmed pivot highs and pivot lows to build a swing structure. It then compares the most recent confirmed swings against geometric conditions such as:
- Similarity of highs or lows
- Pattern height relative to ATR
- Slope of upper and lower boundaries
- Convergence or parallel behavior
- Pattern duration
- Flag or pennant context when applicable
Each detected pattern receives a quality score. This score is based on the geometry of the pattern, such as symmetry, height, similarity of key swing points, slope behavior, and structure fit. The score is intended to help users filter weaker shapes from cleaner structures.
Entry, Stop, and Target levels
The script can display Entry, Stop, and Target reference levels for detected patterns.
These levels are geometric references derived from the detected pattern structure. They are not trade recommendations.
The script can also track the state of the detected setup:
- Pending: the pattern is detected but entry has not been triggered
- Active: entry level has been reached
- Target Hit: price reached the target reference level
- Stop Hit: price reached the stop reference level
- Expired: the setup remained unresolved beyond the selected time window
The Entry label can also show an estimated R:R value based on the distance between Entry, Stop, and Target.
Main settings
Detection:
- Pivot strength
- Equality tolerance in ATR
- Minimum pattern height
- Minimum pattern quality
- Maximum pattern length
Display:
- Show only latest pattern
- Show pattern lines
- Show entry / stop / target levels
- Show R:R in entry label
- Fade inactive levels after result
- Entry / stop / target projection length
- Pattern line width
- Entry / stop / target line width
- Entry / stop / target label size
Colors:
- Pattern colors
- Entry line color
- Stop line color
- Target line color
- Entry text color
- Stop text color
- Target text color
- Resolved / inactive level styling
How to use
Use the indicator as a visual assistant for identifying and reviewing chart-pattern structures.
A detected pattern means the required swing geometry has formed. It does not mean that the pattern will complete successfully or that price will reach the target.
Users can choose to display only the latest pattern for a clean chart, or keep more visual history by changing the display settings.
Repainting note
This script uses confirmed pivot highs and confirmed pivot lows. A pattern can only be detected after the required pivot confirmation bars have passed.
For this reason, pattern drawings may appear on earlier swing points after confirmation. This is a normal confirmation delay caused by pivot-based detection.
The script does not use lookahead. Entry, stop, target, and state labels update only as new bars develop after a pattern has been detected.
Limitations
Chart patterns are geometric interpretations of price structure. Different traders may classify the same structure differently.
The displayed Entry, Stop, Target, and R:R values are reference levels calculated from the pattern geometry. They should not be treated as financial advice, trading instructions, or guaranteed outcomes.
The indicator is intended for chart analysis, education, and visual pattern review. Indikator

Multiday VWAP by ByblloMultiday VWAP by Bybllo
OVERVIEW
This indicator plots up to 5 independent rolling Volume Weighted Average Price (VWAP) lines, each anchored a different number of calendar days back from the present bar (default: 2, 3, 4, 5, and 6 days back). Unlike a standard session VWAP that resets every day, each line here accumulates price*volume continuously from its own anchor day up to the current bar, giving traders a set of rolling reference levels for recent multi-day price/volume balance.
I built this for my own trading because I couldn't find an existing community script that did exactly this — a set of independent, multi-day rolling VWAP lines in one indicator — so I'm sharing it in case it's useful to others too.
KEY FEATURES
- 5 independently configurable rolling VWAP lines — toggle visibility, set the lookback in calendar days, and pick a color for each line individually.
- Lookback days are entered as calendar days (weekends included), so "6 days back" always lands on the same relative session regardless of where in the week you are.
- Real-price calculation — prices are pulled via request.security() against the plain ticker, so the VWAP values are identical whether your chart is displaying candlesticks, Heikin Ashi, Renko, or any other non-standard chart type. Volume is unaffected by chart type and is used as-is.
- Robust new-day detection — instead of relying on the chart's own bar-by-bar progress to detect a new trading day (which can be unreliable right after the chart first loads), this script requests daily-resolution data directly. Daily data loads much faster than intraday data, so the VWAP anchors are detected reliably even immediately after opening the chart.
HOW TO USE
Open the indicator settings and, for each of the 5 lines, set how many calendar days back you want that VWAP to start accumulating from. Use the lines as dynamic support/resistance or fair-value reference levels, similar to how a session VWAP is used, but for multi-day accumulation periods.
NOTES
- This script requires volume data from your data provider. If no volume is available for the symbol, the VWAP values will not calculate correctly.
- "Rolling Days" counts calendar days, not trading/session days.
Feedback and suggestions are welcome. Indikator

Fractal Support & Resistance Zones invincible]Fractal Support & Resistance Zones
Fractal Support & Resistance Zones is an advanced market-structure and price-reaction framework designed to identify, evaluate, and dynamically manage support and resistance zones derived from confirmed fractal pivots.
Unlike traditional support and resistance indicators that simply draw horizontal levels at swing highs and lows, this indicator treats every zone as a dynamic market structure object. Each zone develops through its own lifecycle based on price interaction, independent retests, reaction strength, penetration, estimated buying and selling activity, structural confirmation, trend alignment, and eventual support/resistance role reversal.
The objective is not simply to show where price previously turned.
The objective is to evaluate which zones are still technically relevant, which have gained confirmation, which are weakening, and which may provide better structural trade locations.
---------------------------------------------------------------------------------------------
Fractal-Based Zone Detection
The indicator identifies two independent classes of fractal pivots:
Weak Fractals
Shorter-length pivots designed to capture local price reactions and minor structural turning points.
Major Fractals
Higher-strength pivots based on a larger fractal window. These represent more significant swing highs and swing lows and receive greater importance within the zone-quality model.
Fractal support zones are created from confirmed pivot lows, while fractal resistance zones are generated from confirmed pivot highs.
The detection timeframe can be independently selected, allowing zones from a higher timeframe to be displayed on a lower-timeframe chart.
Higher-timeframe fractal data is requested with lookahead disabled to prevent future data from being intentionally introduced into the pivot calculation.
---------------------------------------------------------------------------------------------
Dynamic Support and Resistance Zones
The indicator creates price zones rather than single horizontal lines.
Markets rarely react from one exact price. Orders, liquidity, and previous positioning are often distributed across a price range. The zone model therefore attempts to represent the broader reaction area surrounding a fractal pivot.
Three zone-width methods are available:
ATR
Zone width is calculated from Average True Range and automatically adapts to market volatility.
Pivot Candle
The structure of the original fractal candle is used to determine the zone width.
Hybrid Candle + ATR
Combines pivot-candle structure with an ATR-based volatility limit.
The hybrid method is designed to prevent unusually large pivot candles from creating excessively wide support or resistance areas.
A minimum tick-based width can also be configured for instruments with very small price movements.
---------------------------------------------------------------------------------------------
Fractal Zone Clustering
Markets frequently produce several nearby fractal pivots around the same price area.
Drawing every pivot independently can create overlapping boxes and unnecessary chart congestion.
The indicator therefore includes a fractal clustering engine.
Nearby same-side fractals may be merged into a common structural zone when:
* They are within the configured ATR merge distance.
* The resulting merged zone does not exceed the maximum permitted ATR width.
* The maximum cluster count has not been exceeded.
* Fresh major zones are not being merged into previously tested or damaged zones when protection is enabled.
The cluster count becomes one component of the zone-quality model.
A cluster does not automatically mean a zone is strong. It simply indicates that multiple independent fractal structures developed around a similar price area.
---------------------------------------------------------------------------------------------
Independent Retest Detection
A major feature of the indicator is the distinction between bars inside a zone and independent zone retests.
If price remains inside a support or resistance area for several candles, those candles are not counted as multiple tests.
A new test is counted only after price:
1. Interacts with the zone.
2. Moves sufficiently away from the zone.
3. Travels the configured ATR reset distance.
4. Returns to the zone again.
This creates a more realistic retest model and avoids artificially increasing the test count during sideways congestion.
The label displays the number of independent tests recorded for each selected zone.
---------------------------------------------------------------------------------------------
ATR-Based Reaction Measurement
After an independent zone retest, the indicator measures how strongly price reacts away from the zone.
Reaction strength is normalized using ATR.
For a support zone, the engine measures upward movement from the reaction anchor.
For a resistance zone, the engine measures downward movement from the reaction anchor.
The strongest reaction generated by the zone is stored as its **Best Reaction ATR**.
Two configurable reaction thresholds are used:
Verified Reaction
The zone has produced the minimum ATR reaction required for technical validation.
Proven Reaction
The zone has generated a stronger ATR reaction and has also accumulated sufficient independent testing.
This prevents a zone from receiving a high structural status simply because price briefly touched it.
The market must demonstrate an actual directional response.
---------------------------------------------------------------------------------------------
Dynamic Zone Status System
Every zone is continuously classified according to its current structural condition.
FRESH
A newly created major zone that has not yet received an independent retest.
Fresh zones may represent relatively untouched structural areas.
WEAK
A zone originating from the shorter weak-fractal detection model.
Weak zones can still produce valid reactions but receive a lower fractal-grade contribution in the quality model.
VERIFIED
A zone that has been tested and remains structurally active.
Reaction behaviour and zone validation contribute dynamically to its score.
PROVEN
A zone that has accumulated multiple independent tests and generated a reaction exceeding the configured Proven Reaction ATR threshold.
Proven zones represent areas with demonstrated historical reaction behaviour.
DAMAGED
Price has penetrated a configurable percentage of the zone.
A damaged zone has not necessarily broken, but deeper penetration reduces its quality score.
BROKEN
Price has invalidated the zone according to the selected break-confirmation method.
Break confirmation can use either:
* Close Beyond Zone
* Full Candle Beyond Zone
Broken zones may optionally remain visible for historical analysis.
FLIPPED SUPPORT / FLIPPED RESISTANCE
A previously broken zone has confirmed a structural role reversal.
Previous support may become resistance.
Previous resistance may become support.
The indicator does not immediately flip a zone when price crosses it. A separate role-reversal confirmation process is required.
---------------------------------------------------------------------------------------------
Zone Damage and Penetration Tracking
Zone quality is not binary.
A support or resistance area may gradually weaken before it completely breaks.
The indicator continuously measures the maximum percentage of zone penetration.
For support, penetration is measured downward through the support area.
For resistance, penetration is measured upward through the resistance area.
When penetration exceeds the configured damage threshold, the zone is classified as ** DAMAGED
Damage also applies a progressive penalty to the quality score.
This means a deeply penetrated zone may remain technically valid while receiving a lower structural ranking.
---------------------------------------------------------------------------------------------
Support and Resistance Role Reversal
The indicator contains a dedicated zone-flip engine.
After a support or resistance zone breaks, the engine monitors whether price moves sufficiently beyond the former zone.
The broken zone must first establish separation from price using a configurable ATR distance.
Price must then return to the previous structural area.
Depending on the selected confirmation mode, the indicator can require:
Zone Reclaim Only
The opposite-side retest itself is sufficient.
Close Away
Price must close a configurable ATR distance away from the zone.
Rejection or Engulfing
The retest can be confirmed through rejection behaviour, an engulfing candle, or a sufficiently strong close away from the zone.
Once confirmed:
* Broken support can become resistance.
* Broken resistance can become support.
The zone is then reset into a new lifecycle as a flipped structural area.
---------------------------------------------------------------------------------------------
Estimated Buy and Sell Activity
The indicator includes an estimated directional volume model.
Because standard TradingView volume does not directly provide true executed bid and ask volume for every market, buying and selling activity is estimated from candle position within the candle range.
A close nearer the candle high allocates a greater portion of volume to estimated buying activity.
A close nearer the candle low allocates a greater portion of volume to estimated selling activity.
The model can use:
* Pivot volume only.
* Pivot volume plus independent retest activity.
Selected zone labels display estimated activity as:
B 64% | S 36%
This should be interpreted as an estimated directional participation model rather than true exchange-level order-flow delta.
---------------------------------------------------------------------------------------------
Multi-Factor Zone Quality Model
Every zone receives a dynamic quality score from 0 to 10.
The score is not based on a single condition.
The model combines several structural factors.
Fractal Grade
Major fractals receive a stronger contribution than weak fractals.
Rejection Wick
The pivot candle's rejection wick is normalized against ATR.
Larger relative rejection can increase the origin score.
Independent Retests
The model evaluates how many genuinely independent zone tests have occurred.
Importantly, unlimited retests do not continuously improve quality.
Excessive testing can weaken a zone.
Reaction Strength
The strongest measured ATR reaction contributes to zone validation.
Estimated Volume Confirmation
Pivot volume participation and directional estimated activity contribute to the score.
Fractal Cluster
Multiple nearby fractals can increase structural confidence.
Freshness
Newer zones receive a greater freshness contribution.
As a zone ages, this component gradually decreases.
The weight of every major quality component can be adjusted by the user.
---------------------------------------------------------------------------------------------
Origin Score and Validation Score
Internally, the quality engine separates zone evaluation into two conceptual stages.
Origin Quality
Evaluates how the zone was created.
This includes:
* Fractal grade.
* Pivot rejection wick.
* Pivot volume participation.
* Fractal clustering.
* Zone freshness.
Validation Quality
Evaluates what price did after the zone was created.
This includes:
* Independent retests.
* Reaction strength.
* Directional estimated activity.
Fresh zones are influenced more heavily by origin quality.
As price begins interacting with a zone, validation behaviour receives greater influence.
This allows the quality score to evolve with market behaviour rather than remaining permanently fixed at zone creation.
---------------------------------------------------------------------------------------------
Retest Exhaustion Penalty
A common assumption is that more support or resistance tests always make a zone stronger.
This indicator does not use that assumption.
Repeated interaction may gradually consume resting liquidity around a price area.
After the configured number of retests, the indicator begins applying an excess retest penalty.
The penalty increases with each additional independent test.
As a result, a heavily tested zone may receive a lower quality score even if it has not formally broken.
---------------------------------------------------------------------------------------------
Congestion Penalty
Price remaining inside a zone for an extended period may indicate balance, absorption, or structural deterioration.
The indicator tracks consecutive bars interacting with each zone.
After the configured congestion threshold, a progressive quality penalty is applied.
This helps distinguish a clean rejection from prolonged price acceptance inside the area.
---------------------------------------------------------------------------------------------
Trend Regime Alignment
An optional EMA-based trend regime is included in the quality model.
Support zones located in an unfavourable bearish regime can receive a counter-trend penalty.
Resistance zones located in an unfavourable bullish regime can also receive a penalty.
The trend filter does not automatically delete zones.
Instead, it modifies their relative quality.
This allows historically valid support and resistance areas to remain visible while acknowledging the current directional regime.
---------------------------------------------------------------------------------------------
Market Structure Break Detection
The indicator includes an independent Market Structure Break, or **MSB**, engine.
Confirmed swing highs and swing lows are detected using a configurable pivot length.
A bullish MSB occurs when price closes above the latest eligible structural high with sufficient momentum confirmation.
A bearish MSB occurs when price closes below the latest eligible structural low with sufficient negative momentum confirmation.
Momentum is normalized using a Z-score calculated from recent price changes.
This reduces the number of minor structural crossings classified as meaningful breaks.
Each structural pivot can generate only one MSB event, preventing repeated labels from appearing after the same swing has already been broken.
---------------------------------------------------------------------------------------------
Zone-to-Structure Confirmation
Market Structure Breaks can also validate previously tested zones.
When a bullish MSB occurs, the indicator searches for a recently touched support zone.
When a bearish MSB occurs, it searches for a recently touched resistance zone.
The most recent eligible zone can receive structural confirmation.
A configurable quality bonus is then applied.
This creates a basic structural sequence:
Zone interaction → Price reaction → Market Structure Break
The intention is to distinguish zones that merely produced a temporary bounce from zones followed by a measurable structural shift.
---------------------------------------------------------------------------------------------
Premium and Discount Trade Location
The indicator uses the latest structural swing high and swing low to estimate the current swing midpoint.
The midpoint represents the 50% equilibrium level of the structural range.
When Premium/Discount grading is enabled:
* Support zones are favoured when positioned in the discount portion of the swing.
* Resistance zones are favoured when positioned in the premium portion of the swing.
This condition contributes to the displayed Trade Grade.
It does not remove zones from the chart.
---------------------------------------------------------------------------------------------
Trade Grade System
Selected zones receive a simplified structural trade grade.
Grade A+
Reserved for high-quality zones with strong alignment between:
* Zone quality.
* Trend regime.
* Premium/discount location.
* Low structural damage.
* Limited retest exhaustion.
Grade A
Strong-quality zones with favourable trend alignment and low damage.
Grade B
Moderate-to-strong structural zones that are not classified as weak fractals.
Grade C
Lower-quality but still technically visible zones.
Grade D
Zones with poor overall structural quality.
The Trade Grade is a contextual ranking system.
It is not an automatic buy or sell signal.
---------------------------------------------------------------------------------------------
Star-Based Quality Display
To make the detailed labels easier to read, the numerical quality model is represented using stars.
★★★★★ = Quality 8.0 or higher
★★★★ = Quality 6.0 to 7.99
★★★ = Quality 4.0 to 5.99
★★ = Quality 2.0 to 3.99
★ = Quality below 2.0
The stars provide a quick visual representation of the underlying 0–10 quality score.
---------------------------------------------------------------------------------------------
Compact Detailed Labels
Selected zones can display compact one-line labels such as:
VERIFIED SUP | B 64% | S 36% | ★★★★ | Tests: 2 | Grade A
The label contains:
* Current zone status.
* Support or resistance classification.
* Estimated buying activity.
* Estimated selling activity.
* Quality stars.
* Independent retest count.
* Structural Trade Grade.
Because displaying a detailed label on every zone can create significant chart congestion, two label modes are available.
Nearest + Strongest
Prioritizes the nearest support, nearest resistance, and the highest-quality remaining zones.
All Visible Zones
Displays labels for every currently visible zone.
The maximum number of detailed labels can also be controlled.
---------------------------------------------------------------------------------------------
Nearest Zone Highlighting
The indicator continuously identifies:
* The nearest active support below price.
* The nearest active resistance above price.
These zones can receive stronger border highlighting.
This makes the most immediately relevant structural areas easier to identify without removing historical zones from the chart.
---------------------------------------------------------------------------------------------
Structural Equilibrium Zone
The latest confirmed structural swing high and swing low are used to calculate a 50% equilibrium area.
The indicator plots:
* Swing origin.
* Swing destination.
* 50% midpoint.
* Configurable equilibrium zone thickness.
Before price interacts with the equilibrium area, the zone is displayed as the current structural midpoint.
After price touches the area, the indicator changes its state to:
Equilibrium touched · wait for structure
This is intended to remind the trader that equilibrium interaction alone is not necessarily directional confirmation.
Additional market structure may be required.
---------------------------------------------------------------------------------------------
Alert Conditions
The indicator provides alert conditions for important zone and market-structure events:
* New fractal support zone.
* New fractal resistance zone.
* Independent zone retest.
* Zone verified by ATR reaction.
* Zone reaching Proven status.
* Zone becoming Damaged.
* Zone break.
* Support/resistance role reversal.
* Bullish Market Structure Break.
* Bearish Market Structure Break.
These alerts can be used to monitor structural changes without continuously watching the chart.
---------------------------------------------------------------------------------------------
Suggested Interpretation
This indicator is designed as a market context and structural analysis tool.
A possible analytical workflow is:
1. Identify the nearest active support and resistance.
2. Review the zone's current status.
3. Check estimated buy/sell activity.
4. Evaluate the quality stars.
5. Review the independent test count.
6. Check whether the zone is fresh, validated, damaged, or exhausted.
7. Evaluate trend alignment.
8. Check premium or discount location.
9. Observe whether price produces a structural break after the zone reaction.
10. Use the Trade Grade as an additional contextual ranking.
No single factor should be interpreted independently.
A five-star zone can still break.
A damaged zone can still generate a reaction.
A weak fractal can still become structurally relevant.
The purpose of the model is to organize multiple price-action variables into a consistent framework.
---------------------------------------------------------------------------------------------
Important Volume Note
The Buy and Sell percentages displayed by this indicator are estimated directional volume statistics.
They are calculated by allocating candle volume according to the closing position within the candle's high-low range.
They do not represent true bid/ask volume, footprint delta, or exchange-level aggressive buying and selling.
The values should therefore be used as a relative activity estimate only.
---------------------------------------------------------------------------------------------
Non-Repainting Considerations
Fractal pivots require confirmation bars.
A zone is created only after the corresponding pivot has been confirmed by the selected fractal length.
Higher-timeframe fractal calculations use `lookahead_off`.
Therefore, historical zones should be interpreted from the point at which the fractal became technically confirmed rather than assuming the pivot was known at the exact swing candle in real time.
Market Structure Break conditions are also evaluated using confirmed price and momentum conditions.
---------------------------------------------------------------------------------------------
Final Note
Fractal Support & Resistance Zones is designed for traders who prefer **dynamic structural zones instead of static support and resistance lines**.
The indicator combines fractal structure, volatility-normalized zone construction, independent retests, reaction measurement, damage analysis, estimated directional activity, structural breaks, trend regime, premium/discount location, and role reversal into a unified zone lifecycle model.
It is intended to help answer three practical questions:
Where is the important price structure?
How has price behaved around that structure?
Is the zone gaining validation, remaining fresh, or gradually losing structural quality?
This indicator is intended for technical analysis and research purposes only. It does not constitute financial advice. Traders should independently evaluate market conditions and apply appropriate risk management.
Indikator

Market Zone [Jannu]1. Description
Markets do not move in straight lines. Price frequently departs from equilibrium through gaps, rapid displacement, or impulsive expansion from compressed bases. These departures leave behind areas of unresolved imbalance; zones where the auction process was incomplete. Market Zone is the foundational Imbalance component of the ET Massif Framework research suite. It identifies three distinct forms of such imbalance and renders them as dynamic, self-managing zones on the chart.
2. Features
The indicator combines three detection methods:
Fair Value Gaps (FVGs)
Three-candle imbalances where a qualifying middle candle displaces price fast enough that the gap between the outer candles remains unfilled. Detection requires ATR expansion, minimum gap size, VWAP position relative to the gap, volume, and candle body proportion.
Session Gaps
Price discontinuities between consecutive session closes and opens, filtered by ATR magnitude.
Points of Interest (POI)
The consolidation base that preceded a significant impulsive move. Once an impulse exceeding a defined ATR multiple is confirmed, the indicator locates the tight-range candle immediately before the expansion and uses its high/low as the zone boundary.
3. Detection Logic
A. Fair Value Gaps (FVG)
Detected using a qualified three-candle imbalance structure.
Criteria:
Low > High (Bullish) or High < Low (Bearish)
Middle candle range > 1.1× ATR
Gap size > 1.0× ATR
Middle candle VWAP above High (Bullish) or below Low (Bearish)
Volume > 1.2× 180-bar average volume
Candle body > 65% of total range
Qualifying FVGs display a diamond marker at the middle candle VWAP. Diamond size scales with relative volume. Boxes extend forward with each new bar and contract as candle bodies close into the zone. Zones are removed once fully covered.
B. Session Gaps (FVG)
Detects price discontinuities between the current open and the prior close.
Criteria:
Absolute gap > 1.5× ATR
Gap boxes are drawn between the prior close and the current open, extend forward, and contract as candle bodies close into them. Zones are removed once fully covered.
C. Points of Interest (POI)
Identifies the consolidation base preceding a significant directional expansion.
Criteria:
An impulsive move within the previous 5 bars exceeding 2.0× ATR
Majority of bars within the move are directional
Once an impulse is confirmed, the indicator searches the preceding bars for the first candle whose range is below 0.5× ATR. That candle's high and low define the POI zone. A 20-bar cooldown prevents overlapping detections. Zones are invalidated when a candle body closes through the zone boundary. Invalidated zones remain on the chart in grey. All criteria are configurable via settings. Use stricter rules for lower timeframes or volatile assets.
4 . Use
Jannu is a structural reference tool. The zones mark where price departed from equilibrium; Determining which outcome is unfolding requires the broader analytical context in which the indicator is used.
The same zone type can carry different interpretations depending on context. On the CRWD daily chart in early 2026, a cluster of large bearish FVGs formed during a sharp sell-off, yet price reversed immediately and never returned to those zones. The imbalance was not evidence of sellers in control; it was the mechanism through which aggressive selling exhausted supply before buyers drove price upward. Contrast this with the series of bearish FVGs that formed during ADBE's long decline from late 2024. Same structure, different character. The indicator marks the zone; contextual analysis is required.
日本語概要 (Japanese Summary)
Jannuは、価格が均衡から乖離した領域を可視化するリファレンス指標であり、ET Massifインジケーターフレームワークの一部として開発されました。セッションギャップ、フェアバリューギャップ(FVG)、ポイント・オブ・インタレスト(POI)の3種類の価格不均衡を検出し、動的なゾーンとしてチャート上に表示します。これらのゾーンは、ローソク足の実体が内部に進入するにつれて縮小し、完全に埋まった時点で自動的に削除されます。市場構造の参照フレームワークとして機能します。
中文概要(Chinese Summary)
Jannu 是一款將價格偏離均衡的區域進行視覺化呈現的參考指標,作為 ET Massif 指標框架的一部分所開發。本指標可偵測三種價格失衡類型:開盤缺口(Session Gap)、合理價值 gap(FVG)以及關注區域(POI),並將其作為動態區間顯示於圖表上。這些區間會隨著 K 線實體進入而縮減,並在完全填補時自動刪除。本指標作為市場結構的參考框架使用。
Disclaimer:
This script is a research tool for market structure analysis and educational purposes only. It does not constitute financial advice. Trading involves risk. Indikator

AlgoZ Pro Price ActionAlgoZ Pro Price Action is a clean price action based forex indicator built to help traders identify potential Buy, Sell, and Exit areas using a combination of market structure, trend filtering, volatility logic, and dynamic trade management.
This indicator is designed around the idea that not every trade needs to have a high win rate to be useful. Instead of only looking for quick scalp targets, AlgoZ Pro Price Action is built to manage trades with a runner-style approach. The goal is to cut weak trades faster, protect trades that start moving in the right direction, and allow stronger moves to continue when momentum is present.
The default settings are best suited for 1-minute EUR/USD forex trading. Other forex pairs and timeframes may work differently and should be tested before use.
The indicator uses market structure breaks to identify possible directional shifts. When price breaks key internal support or resistance levels, the script checks multiple filters before plotting a signal. These filters are designed to reduce low-quality signals during chop, weak momentum, or overextended conditions.
AlgoZ Pro Price Action includes Buy, Sell, and Exit labels directly on the chart. Buy signals are shown in teal, Sell signals are shown in pink, and Exit signals are shown in a neutral color. The bars can also be colored based on the active signal direction so it is easier to visually track the current market bias.
One of the main parts of this indicator is the trend lock system. The trend lock helps prevent the indicator from flipping back and forth too quickly during noisy market conditions. It uses EMA trend structure, slope behavior, and confirmation bars to decide whether the market is currently favoring Buy-side or Sell-side continuation. Countertrend signals must be stronger before they are allowed through, which helps reduce random reversal signals during an active move.
The indicator also includes automatic forex pair adjustment. It detects whether the chart is a JPY pair or a non-JPY forex pair and automatically adjusts pip size calculations. This helps prevent issues where a stop or exit calculation is too tight or too wide because of the symbol’s price format. The script also includes auto volatility tuning, which uses ATR-based logic to scale stop size, runner triggers, trailing stop distance, dead-trade protection, and cooldown behavior based on the current pair’s movement.
Trade management is handled through a dynamic exit engine. Instead of using only fixed take profit levels, the indicator uses runner logic. Once a trade moves far enough in profit, the trade can enter runner mode. From there, the script can move the stop, protect profit, and trail the trade if the move continues. This allows stronger trades to breathe while still giving the indicator a way to exit when momentum fades.
AlgoZ Pro Price Action also includes dead-trade protection. If a trade has been open for a certain number of bars and has failed to make meaningful progress, the script can plot an Exit signal. This is designed to help remove weak trades that are not moving enough to justify staying in them.
The indicator includes several optional filters and controls, including EMA trend filtering, ADX strength filtering, chop filtering, candle body quality filtering, minimum EMA separation, price distance from the slow EMA, overextension protection, post-exit cooldown, and emergency protection logic.
Main features include:
• Buy, Sell, and Exit labels
• Teal and pink AlgoZ Pro visual theme
• Price action and market structure based signals
• Internal support and resistance break logic
• Optional BOS / CHoCH structure markings
• EMA trend filtering
• ADX trend strength filter
• Chop and range filter
• Candle quality filter
• Trend lock system
• Countertrend signal protection
• Auto pip size detection
• Auto adjustment for JPY and non-JPY forex pairs
• ATR-based auto pair tuning
• Dynamic stop logic
• Runner-style trade management
• Breakeven / profit lock logic
• Trailing stop logic for stronger moves
• Dead-trade exit protection
• Optional bar coloring
• Optional entry and stop lines
• Optional status table
Recommended default use:
1-minute EUR/USD forex chart.
Other forex pairs and timeframes may require adjustment depending on spread, volatility, session, and market conditions. Indikator

HTF Support/Resistance Multi-TapThe HTF Multi-Tap S/R Zones is an advanced structural indicator designed for lower timeframe traders who need higher timeframe confluence without cluttering their charts.
Instead of drawing infinite lines everywhere, this indicator tracks historical pivot points from a Higher Timeframe (HTF) of your choice and dynamically builds highly-validated "Zones of Interest" directly onto your current chart. It is specifically engineered to find areas where price has repeatedly struggled to break through.
Core Features:
Dynamic Wick Absorption (Zones): When price wicks into the same general area, the script doesn't just plot a single static line. It dynamically expands the top and bottom borders of a "Zone" to encompass the full range of the historical wicks, giving you a literal block of rejection to trade against.
Zone Merging: If two adjacent zones expand enough to touch each other, the indicator will seamlessly merge them into one massive, highly significant structural block.
Volume & Tap Tracking: Every time price taps a zone, the script records the touch and pulls the exact volume that occurred on that HTF candle. The zone's label clearly displays the total accumulated volume and the number of taps it took to build it.
Automated Volume Grading: The indicator continuously scans the active zones on your chart and automatically tags the zone with the absolute highest historical volume with a (⭐ Max Vol) label, instantly showing you the strongest defensive wall on the board.
Clean & Focused: By default, it only displays the 3 closest Support zones and the 3 closest Resistance zones to the current price, keeping your chart clean and focused strictly on the levels that matter right now.
How to Use (Confluence):
This is not a standalone entry signal; it is a confluence tool.
If you are trading on a 1-minute or 5-minute chart, set the indicator's HTF to 15m or 1H. Use these projected zones as high-probability areas to look for your lower timeframe entry models (like break of structure, fair value gaps, or engulfing candles). The (⭐ Max Vol) zones are prime locations for strong reversals or major breakout continuations.
Settings:
Higher Timeframe: Choose which timeframe to pull structural pivots from.
Proximity Threshold %: Adjust how close price needs to come to an existing zone to be considered a "Tap" and expand the box. Increase this slightly for highly volatile assets to absorb larger wicks.
Minimum Taps: Determine how many times a level must be tested before it is considered valid and plotted on your screen.
Indikator