Indikator

Flag Breakout Forecasts [AlgoAlpha]🟠 OVERVIEW
This indicator detects converging price channels — commonly called flags or wedges — directly on the chart using a zigzag-based pivot detection algorithm. It identifies three collinear pivot points on both the highs and the lows to confirm a valid channel, then monitors the channel in real time for a breakout.
Beyond just drawing the channel, the script assigns probabilistic forecasts to each active pattern. It uses the historical distribution of past breakout durations and directions to estimate the likelihood of an imminent breakout, whether that breakout will be bullish or bearish, and adjusts those estimates using live volume data accumulated inside the pattern.
A supplemental volume table and a net-volume gauge render alongside each detected pattern, giving traders a second lens into the supply-and-demand balance before a move resolves.
🟠 CONCEPTS
Zigzag — A filtered sequence of alternating swing highs and swing lows. Pivots are confirmed only after a user defined bars on each side, so shorter user defined values capture minor swings and larger values require more significant price moves.
Collinearity check — Given three pivot points, the script projects a straight line from the first to the third and measures how far the middle pivot deviates from it, expressed as a percentage of price. If the deviation falls below the tolerance threshold, the three pivots are treated as lying on the same trendline.
Converging channel — A pair of trendlines (one through swing highs, one through swing lows) where the gap between them narrows from left to right. This geometry distinguishes flags and symmetric wedges from parallel channels.
Early detection — When one trendline is confirmed but the other lacks a third pivot, the script uses the current running extreme (an unconfirmed potential pivot) as a temporary third point. The resulting line is drawn dashed and upgrades to solid when the pivot is confirmed.
Breakout confirmation — A break is logged after the close exits the projected channel boundary for two consecutive bars, or immediately when the breakout candle body extends well beyond the boundary and its body size is at least 3 standard deviations above the 20-bar mean body length.
Normal CDF approximation — Breakout duration probabilities are derived using the Abramowitz and Stegun rational approximation to the standard normal cumulative distribution function, applied to z-scores computed from the historical distribution of past breakout durations.
Net volume ratio — Bullish volume (up-close bars) minus bearish volume (down-close bars), divided by total volume, mapped to a −100 to +100 scale. Used to tilt the directional probability estimate away from the purely historical base rate.
🟠 FEATURES
Automatic channel detection — Channels are drawn the moment three collinear pivots are confirmed on each side with matching alignment and convergence.
• Solid lines for fully confirmed channels.
• Dashed lines for the side that is still waiting on a third confirmed pivot.
Probabilistic overlay label — Displayed above each active channel.
• P(break): probability that a breakout will occur soon, based on how the current pattern duration compares to historical durations.
• P(bull) / P(bear): directional probabilities derived from historical breakout directions and blended with live net volume.
Net volume gauge — A color-gradient vertical bar drawn to the right of the last candle, with a pointer showing whether up-close or down-close volume dominates the current pattern.
Volume statistics table — Shows bullish volume, bearish volume, net volume, total volume, ATR, and pattern duration for the most recent active pattern. Cell background intensity scales with volume magnitude.
Breakout signals — Arrow labels mark the breakout bar with the direction, total volume absorbed, and the number of bars the pattern lasted.
Background highlight — A subtle background color appears on the bar when a new pattern is first detected. To help users know the exact time the pattern was detected
🟠 HOW TO USE
Adjust len to match the swings you trade — lower values (3–5) for intraday patterns, higher values (10–20) for swing or position setups.
Tighten collinearity tolerance to 0.1–0.2% if you want only very clean trendline alignments; loosen it toward 1% if you want the indicator to catch more approximate formations.
Watch the dashed channel side — it signals an early, unconfirmed pattern. Treat it as a warning rather than a confirmed setup, and wait for it to turn solid before acting.
Check P(break) in the label — a reading above 70% means the current pattern has already lasted longer than most historical patterns, suggesting a resolution is statistically overdue.
Use P(bull) and P(bear) alongside the volume gauge — when P(bull) is elevated and the gauge leans bullish, the two signals agree on direction. Disagreement between them calls for extra caution.
Reference the volume table's net row — persistently positive net volume during a bearish-looking wedge can indicate absorption of selling pressure and a possible upside resolution.
Set alerts for "Pattern formed," "Bullish breakout," "Bearish breakout," and the strong-break variants to monitor multiple instruments without watching the chart continuously.
🟠 CONCLUSION
Flag Breakout Forecasts detects converging price channels using zigzag pivot collinearity and geometric validation, then layers on probabilistic duration and direction estimates derived from each instrument's own historical breakout data. The result is a self-calibrating pattern tool that combines structural chart analysis, volume profiling, and statistical inference in a single overlay. Indikator

Indikator

Indikator

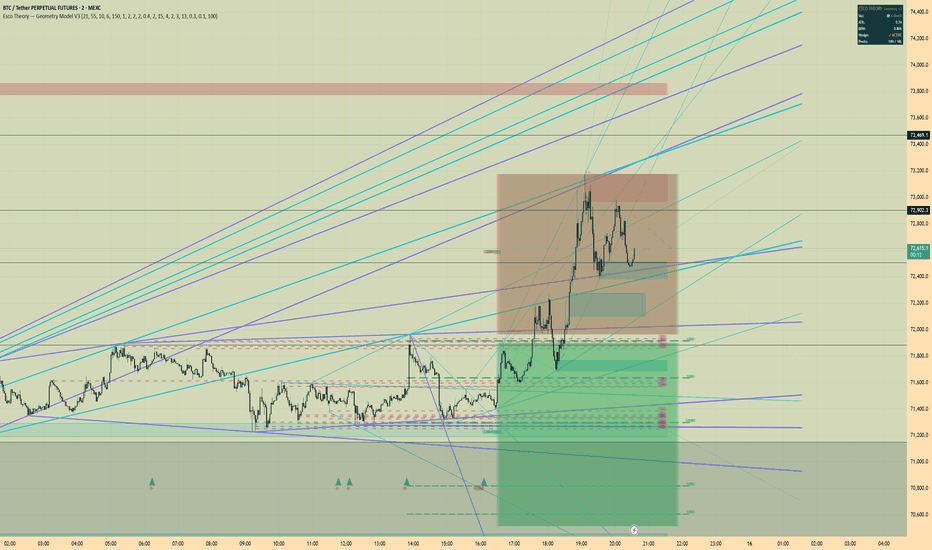
Esco Theory V3.1Esco Theory Geometry Model V3 is a structural analysis overlay that maps market geometry, supply and demand, liquidity, fair value gaps, and volatility compression in one framework.
The tool combines market structure, liquidity mapping, supply and demand zones, fair value gaps, and volatility squeeze detection into a single structural system.
It does not generate buy or sell signals. It shows the structural conditions that often precede large moves so traders can plan trades around them.
Built for discretionary traders who read price action and structure.
Originally developed for crypto futures but it works on any liquid market.
Every feature can be toggled on or off. Every color, lookback period, tolerance, and threshold is adjustable. You can run only rails and support resistance or the full system. It adapts to your trading style and timeframe.
WHAT IT SHOWS
V3 draws the structural architecture of price directly on the chart.
Geometric rails and trend channels from swing pivots
Horizontal support and resistance from clustered pivot levels
Supply and demand zones validated by displacement
Fair value gaps from three candle imbalances
Inverse fair value gaps from filled imbalances
Equal highs and equal lows that often act as liquidity targets
Confluence zones where multiple levels overlap
Volatility compression detection with squeeze and expansion signals
Each component is independent. Turn on what you use. Turn off what you do not.
GEOMETRIC RAILS
The indicator connects significant swing highs and lows with diagonal trendlines and projects them forward.
Minor rails track recent structure.
Major rails map the larger cycle.
Cross rails connect highs to lows for diagonal support and resistance.
Cycle fans project from cycle extremes through opposing pivots.
These rails form structural corridors that price often travels inside.
When a rail aligns with a horizontal level or a supply demand zone the reaction tends to be stronger.
Rail color, width, extension distance, and cross rail count are adjustable.
SUPPORT AND RESISTANCE
Nearby pivot points are clustered into horizontal levels.
Each level includes a touch count so you can see how many times price has reacted there.
More touches usually means a stronger level.
Levels automatically flip between support and resistance depending on where price trades relative to the level.
You control minimum touch count and clustering tolerance so detection can be tuned for your timeframe or market.
SUPPLY AND DEMAND ZONES
Zones are detected at pivots where price displaced strongly away from the origin candle.
A valid zone requires clear displacement.
Supply zones represent potential distribution areas.
Demand zones represent potential accumulation areas.
Zones are removed when price closes through them.
New in V3 zones track retests.
Each time price revisits a zone the color fades slightly and the label updates with the retest count.
A fresh zone with zero retests is strongest.
A zone labeled S x3 has been tested three times and is weaker.
Zone count, pivot lookback, mitigation behavior, fade behavior, and colors are configurable.
FAIR VALUE GAPS
V3 detects fair value gaps using three consecutive candles where a price gap forms around the middle candle.
Bullish FVG occurs when candle one high does not overlap with candle three low.
Bearish FVG is the inverse.
Fair value gaps represent price inefficiency where the market moved too quickly.
These areas often get revisited as price rebalances.
Minimum gap size, lifespan, and automatic removal after midpoint fill can be configured.
INVERSE FAIR VALUE GAPS
When a fair value gap is fully mitigated it becomes an inverse fair value gap.
A filled bullish FVG becomes resistance.
A filled bearish FVG becomes support.
The zone remains on the chart with a different color until price closes through it again.
This captures the common behavior where filled imbalance zones flip direction.
CONFLUENCE
The indicator scans all detected levels and highlights areas where several structures cluster together.
When rails, horizontals, and supply demand overlap the probability of a reaction increases.
Confluence zones show how many levels overlap in the same area.
Cluster width and minimum level count can be adjusted.
COMPRESSION AND SQUEEZE
Volatility compression is detected using ATR ratio, Bollinger Band width, and Keltner Channel containment.
When volatility contracts the chart highlights compression.
This means price is coiling and energy is building.
Optional wedge detection shows converging pivot structure during compression.
Compression thresholds and pivot lengths can be tuned.
SQUEEZE AND FIRE
The squeeze system identifies when Bollinger Bands sit inside Keltner Channels.
Red diamonds mark squeeze bars.
Volatility is compressed and a move is building.
This does not predict direction.
Green triangles mark the fire bar where compression releases and volatility expands.
Expansion often appears as breakouts or displacement candles.
LIQUIDITY
The indicator detects equal highs and equal lows.
These areas often act as liquidity pools where stops accumulate.
Price frequently moves toward these levels before reversing or continuing.
Tolerance for equal highs and lows can be adjusted.
HOW TO USE IT
Strong setups occur when several tools agree.
Typical workflow.
Read the rails and understand the direction of structure.
Identify key levels from support resistance, supply demand, and fair value gaps.
Look for confluence where several levels overlap.
Watch compression. Squeeze near a key level means energy is building.
Wait for fire. Expansion from a confluence area often produces the move.
Confluence matters more than any single signal.
The indicator is meant to be tuned to your style and timeframe. The default settings are a starting point.
MARKETS
Originally built for Bitcoin and crypto perpetual futures.
It works well on other liquid markets including Ethereum, forex majors, index futures, and high volume equities.
Default settings are tuned for crypto on 5 minute to 4 hour charts.
Adjust swing lookback and pivot length when switching markets or timeframes.
ESCO THEORY
Markets move through repeating cycles.
Compression
Liquidity grab
Expansion
Most traders only see the breakout.
Structural traders map the conditions that lead to it.
Esco Theory focuses on identifying those structural conditions.
Geometry Model V3 visualizes them on the chart.
DISCLAIMER
This indicator is for market structure analysis only.
It does not provide financial advice or automated trade signals.
Always use proper risk management.
Trade safe.
Esco Indikator
Dynamic Median Momentum Oscillator [AlgoAlpha]🟠 OVERVIEW
This script provides a momentum oscillator that uses a median-based approach rather than traditional averages to find the center of price action. By calculating the distance between the current price and a rolling median (HLC3), it identifies how far the market has stretched from its historical equilibrium. The indicator is designed to filter out the noise typical of standard momentum tools, using a standardized range calculation to provide fixed overbought and oversold zones. It helps traders identify trend strength, potential exhaustion, and mean reversion opportunities across different market conditions.
🟠 CONCEPTS
The core of this tool is the Dynamic Median basis, which uses a rolling median of the HLC3 price to establish a "fair value" line. Unlike a simple moving average, the median is less sensitive to extreme price spikes, making the resulting oscillator more robust against outliers. To ensure the oscillator remains readable across different assets, the raw difference between price and median is standardized by the average candle range (EMA of High-Low). This normalization allows for the use of fixed thresholds (e.g., +/- 200, 250, 300) regardless of the asset's price. The median sets the context for the baseline, while the smoothed MCD and its signal line provide the timing for entries and exits.
🟠 FEATURES
Standardization feature to enable fixed overbought/oversold levels across any asset
Multi-component display: Fast (histogram), Slow (lines), and Super Slow (filled zones)
Reversion markers (triangles) indicating price returning from extreme levels
🟠 USAGE
Setup : Add the script to your chart and choose your preferred Display Mode. Use "All" to see the full picture or "Slow" for a cleaner view of trend direction. Ensure "Standardize" is checked if you want to use the built-in overbought/oversold bands effectively.
Read the chart : Look for the Smooth MCD (white line) crossing the Signal (orange line) for momentum shifts. Values above 0 indicate bullish momentum, while values below 0 indicate bearish momentum. Triangles appear at the top or bottom of the oscillator when price reaches extreme levels (300/-300) and begins to revert to the mean.
Settings that matter : The Basis Length determines how much historical data defines the "center" of the market; longer lengths are better for higher timeframes. Smoothing Length controls the reactivity of the main white line—increase this if you find the oscillator is giving too many false signals in choppy markets.
Indikator

15M Candle Overlay v215M Candle Overlay v2 — Enhanced
Overlay your 15-minute candles directly onto any lower timeframe chart (1m, 3m, 5m, etc.) without switching tabs. The candle group renders to the right of the current bar, keeping it clean and separate from live price action.
What it shows:
Up to 6 closed 15m candles + the forming candle, drawn as real candlesticks with wicks and color-coded bodies
Volume bars scaled proportionally beneath each candle — the highest-volume candle is highlighted with a gold border
A colored trend line connecting consecutive 15m closes (green = rising, red = falling)
Dashed Support/Resistance lines marking the high and low of the visible 15m group
An info panel anchored to the right of the group showing: current pattern, strength, multi-candle pattern, bias, O/C, H/L, and time remaining in the current 15m candle — panel background tints green/red based on overall bias
Pattern Detection:
15+ single-candle patterns: Doji variants, Hammer, Shooting Star, Marubozu, Belt Hold, Spinning Top and more
20+ multi-candle patterns: Engulfing, Harami, Morning/Evening Star, 3 White Soldiers, 3 Black Crows, Kicker, Tweezer, Piercing Line, Rising/Falling 3 Methods and more
Each pattern labeled with name, strength rating (Strong/Moderate/Weak), and body percentage
All features are individually toggleable in the settings panel. Customizable colors, gap spacing, candle width, and pattern detection sensitivity thresholds. Indikator

VisualStructureToolsLibrary "VisualStructureTools"
MTF-safe drawing library (Unix-Time). Designed for high visual discrimination and efficient debugging of complex logic without cluttering the main script.
Optimized for Pine Script® v6 to prevent runtime errors in multi-timeframe environments.
setLine(price, startTime, labelText, labelPos, is_extend, l_width, l_col, l_style)
Draws a horizontal level or a segment with an optional label.
Parameters:
price (float) : Price level for the line.
startTime (int) : UNIX timestamp (ms) for the starting point.
labelText (string) : Text to display on the label. Use "none" to hide.
labelPos (string) : Position of the label relative to the price ('above' or 'below', 'none').
is_extend (bool) : If true, the line extends infinitely (extend.both).
l_width (int) : Width of the line in pixels.
l_col (color) : Color for the line and label text.
l_style (string) : Style of the line ('solid', 'dashed', 'dotted').
setBox(top, bottom, startTime, endTime, boxText, b_col, b_width, b_style, b_transp)
Draws a filled box with an optional synchronized text label.
Parameters:
top (float) : Price of the upper boundary.
bottom (float) : Price of the lower boundary.
startTime (int) : UNIX timestamp (ms) for the left side of the box.
endTime (int) : UNIX timestamp (ms) for the right side (defaults to current 'time').
boxText (string) : Optional text label for the box. Use "" to hide.
b_col (color) : Border and fill color.
b_width (int) : Border width.
b_style (string) : Border style ('solid', 'dashed', 'dotted').
b_transp (int) : Transparency for the background fill (0-100). Perpustakaan

Indikator

Indikator

Indikator

Indikator

Premium Price Action [Alpha Extract]A sophisticated trend-following rail system that combines dual-lookback price averaging with adaptive ATR-based trailing levels for clean trend identification and momentum-sensitive visual feedback. Utilizing staircase rail logic with dynamic ribbon visualization and strength-modulated transparency, this indicator delivers institutional-grade trend detection with minimal whipsaw through intelligent rail adaptation. The system's multi-lookback baseline construction combined with ATR-scaled distance creates robust trend rails that only flip on genuine structural changes while maintaining visual clarity through glow effects and regime-based background coloring.
🔶 Advanced Dual-Lookback Baseline Framework
Implements sophisticated baseline calculation using two configurable lookback periods to sample recent price history at different intervals, averaging results and applying dual smoothing for stable trend reference. The system retrieves close prices from first lookback (default 12 bars) and second lookback (default 27 bars), calculates their average, applies SMA smoothing, then EMA smoothing for ultra-clean baseline resistant to short-term noise while maintaining responsiveness to genuine trend shifts.
// Dual-Lookback Baseline Construction
Close_1 = close
Close_2 = close
Close_Avg = (Close_1 + Close_2) / 2.0
Baseline_Raw = ta.sma(Close_Avg, SMA_Length)
Baseline = ta.ema(Baseline_Raw, Smooth_Length)
🔶 Adaptive Trailing Rail Architecture
Features intelligent rail calculation that trails price using ATR-scaled distance from baseline with ratcheting logic preventing premature reversals. The system calculates upper rail (baseline + ATR × multiplier) and lower rail (baseline - ATR × multiplier), implements adaptive trailing where bullish rail only rises or holds while bearish rail only falls or holds, and transitions rails only when price violates opposite rail creating clean staircase pattern.
// Adaptive Rail Logic
Upper_Rail = Baseline + ATR * Rail_Multiplier
Lower_Rail = Baseline - ATR * Rail_Multiplier
// Ratcheting Behavior
Bull_Rail = close > Bull_Rail ? max(Lower_Rail, Bull_Rail ) : Lower_Rail
Bear_Rail = close < Bear_Rail ? min(Upper_Rail, Bear_Rail ) : Upper_Rail
// Trend Determination
Trend = close < Bull_Rail ? -1 : close > Bear_Rail ? 1 : Trend
🔶 Staircase Step-Line Visualization
Implements stepline plot style creating distinctive staircase appearance that visually emphasizes trend persistence and makes rail level changes instantly recognizable. The system uses plot.style_stepline rendering that draws horizontal segments at each rail level with vertical connections only at transition points, producing clean geometric pattern that distinguishes this rail system from curved moving averages or bands.
🔶 Dynamic Strength-Based Transparency
Provides sophisticated transparency modulation where background and ribbon opacity adjust based on momentum strength relative to ATR volatility. The system calculates momentum as price distance from baseline, normalizes by ATR to produce 0-1 strength score, and reduces transparency (increases intensity) as strength increases, creating visual feedback where strong trends display vivid colors and weak trends show muted tones.
🔶 Multi-Layer Glow Effect System
Features triple-layer rail rendering with progressively wider and more transparent outer layers creating luminous glow effect emphasizing trend rail. The system plots core rail at specified width with full color intensity, adds inner glow layer at +2 width with moderate transparency, and outer glow at +4 width with higher transparency, producing visual depth and making rail instantly recognizable without cluttering chart space.
🔶 Adaptive Ribbon Visualization
Creates ATR-scaled ribbon extending below bullish rail or above bearish rail with width proportional to current volatility and transparency modulated by trend strength. The system calculates ribbon size using ATR × ribbon multiplier, positions ribbon adjacent to active rail, and applies dynamic transparency that intensifies during strong momentum creating intuitive visual representation of trend conviction and volatility context.
🔶 Regime Background Highlighting
Implements subtle background wash using trend color with strength-adjusted transparency providing full-chart regime awareness without obscuring price action. The system applies bullish or bearish background color with base transparency that decreases (color intensifies) as momentum strength increases, creating gradient effect where powerful trends display more prominent backgrounds while weak trends maintain subtle presence.
🔶 Intelligent Flip Detection Logic
Generates trend reversal signals only when price violates opposite rail with confirmation, preventing false signals during normal retracements. The system detects bullish flip when previous trend bearish and close crosses above bearish rail, detects bearish flip when previous trend bullish and close crosses below bullish rail, and places compact BULL/BEAR labels at ribbon edges marking exact reversal bars for clear visual confirmation.
🔶 Comprehensive Visual Integration
Provides multi-dimensional trend visualization through colored rail with glow effects, ATR-scaled ribbons, regime backgrounds, trend-synchronized candle plotting, and optional chart candle coloring. The system enables selective display toggling for each visual component while maintaining consistent color scheme and strength-based intensity across all elements, allowing customization from minimal (rail only) to comprehensive (all features) presentation.
🔶 Baseline Reference System
Includes optional baseline plot showing underlying smoothed dual-lookback average serving as neutral reference level and trend bias indicator. The system displays baseline with neutral color at reduced opacity, enabling traders to assess whether price trades above baseline (inherent bullish bias) or below baseline (inherent bearish bias) independent of current rail trend state for confluence analysis.
🔶 Performance Optimization Framework
Employs efficient calculation methods with optimized rail ratcheting logic, streamlined strength calculations, and intelligent plot rendering that only processes active visual elements. The system includes smart state tracking for trend persistence, minimal recalculation overhead through nz() functions and conditional logic, and smooth visual updates maintaining consistent performance across extended historical periods.
🔶 Why Choose Premium Price Action ?
This indicator delivers sophisticated trend-following analysis through adaptive rail methodology with dual-lookback baseline construction and ATR-scaled distance. Unlike traditional moving average systems prone to whipsaw during choppy conditions, the ratcheting rail logic with opposite-rail violation requirements creates definitive trend states that persist through normal retracements. The system's staircase visualization instantly communicates trend persistence, strength-modulated transparency provides conviction feedback, and comprehensive visual integration enables complete trend assessment without switching between multiple indicators. Perfect for swing traders and position managers seeking clear trend identification with minimal false signals across cryptocurrency, forex, and equity markets where the adaptive rails naturally adjust to varying volatility regimes while maintaining consistent signal quality. Indikator

Indikator
Indikator

Liquidity Confluence TerminalZero-Lag Liquidity Confluence System is a multi-timeframe trend alignment and execution planning indicator designed to highlight high-probability trade opportunities when higher timeframe structure agrees. The script evaluates Daily, Weekly, and Monthly candle bias to determine full directional confluence, only allowing signals when all three timeframes are aligned. A zero-lag EMA model provides responsive trend detection while minimizing delay, acting as the primary trigger mechanism. In addition, the system dynamically identifies volume-backed liquidity breakouts to establish adaptive supply and demand levels, which are then used for intelligent stop placement. When confluence and trigger conditions align, the indicator automatically generates a structured trade plan, including entry, stop loss, and take profit levels based on a configurable risk-to-reward ratio. A real-time dashboard displays higher timeframe bias, while visual glow and background cues emphasize alignment states. This tool is built for traders who prioritize structure, confirmation, and disciplined risk management over reactive signal chasing. Indikator

HTF Volume Liquidity Profile [AlgoAlpha]🟠 OVERVIEW
This tool projects a volume profile from a higher timeframe directly onto your current chart. By breaking down historical price action into vertical intervals, it creates a heatmap of where volume was concentrated during that larger period. It maps out areas of high liquidity, showing exactly where buyers and sellers were most active, and displays a detailed breakdown of bullish versus bearish volume at specific price levels within that higher timeframe block.
🟠 CONCEPTS
This script takes that concept and applies it to a higher timeframe, meaning you can look at a 5-minute chart and see the volume distribution for the entire day overlaid as a single block. It calculates the highest and lowest prices of the chosen timeframe and divides that range into smaller segments based on your resolution setting. It then tallies the volume of every lower timeframe candle that falls into each segment. It also splits this volume into positive and negative flows based on whether the individual candles closed green or red. This gives you a clear picture of net directional pressure at each price level, acting like a lightweight footprint chart.
🟠 FEATURES
Higher timeframe volume heatmap overlaid directly on the current lower timeframe chart.
Inner mini-boxes showing the exact proportion of bullish (green) vs bearish (red) volume at each specific price level.
Summary label displaying total up volume, down volume, volume delta, and overall sentiment for the entire interval.
🟠 USAGE
Setup : Add the script to your chart. Choose a higher timeframe that makes sense for your trading style (for example, use 1D if you are trading on a 5-minute or 15-minute chart). Adjust the resolution depending on how granular you want the price levels to be.
Read the chart : Darker, more opaque background boxes mean a high amount of total volume was traded at that price level (High Volume Nodes). The inner mini-boxes show the tug-of-war at that level; a longer green inner box means buyers dominated that specific price, while a longer red one means sellers dominated. The label at the bottom of each block summarizes the total volume delta so you instantly know who won the overall period.
Settings that matter : The Higher TimeFrame input dictates the width and duration of each volume profile block. The Profile Resolution input controls how many vertical slices the price range is divided into; increasing this adds finer detail but can visually clutter the chart if set too high.
Indikator

Indikator

Indikator

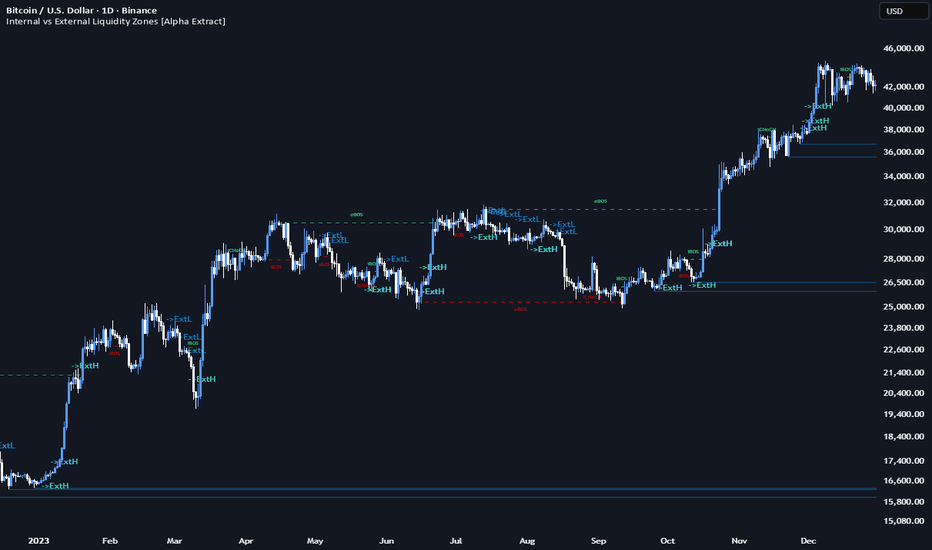
Internal vs External Liquidity Zones [Alpha Extract]A sophisticated dual-timeframe market structure visualization system that identifies and maps internal (short-term) and external (long-term) liquidity levels with comprehensive Break of Structure (BOS) and Change of Character (CHoCH) detection across both timeframes. Utilizing pivot-based zone creation with ATR-scaled heights and sweep classification, this indicator delivers institutional-grade liquidity mapping distinguishing between major swing liquidity (external) and minor retracement liquidity (internal) for multi-dimensional market structure analysis. The system's hierarchical structure framework combined with objective arrow projection and state-based zone coloring provides complete smart money concept implementation for advanced order flow trading.
🔶 Understanding Internal vs External Structure
External Structure represents major swing points using longer pivot lengths (default 10 bars), identifying significant highs and lows that define the broader market range and trend direction. These are the key levels where large institutional positions likely exist, stop losses cluster, and major trend reversals may occur. External structure breaks (eBOS/eCHoCH) signal significant shifts in market sentiment and often precede sustained directional moves.
Internal Structure captures minor swing points within the external range using shorter pivot lengths (default 3 bars), revealing short-term liquidity pools formed during retracements, consolidations, and minor corrections. These represent areas where smaller participants' stops accumulate and where price often reacts before continuing toward external objectives. Internal structure breaks (iBOS/iCHoCH) provide early warning signals and tactical entry opportunities within the broader external trend context.
The relationship between internal and external structure creates a hierarchical framework: external zones define the "what" (overall bias and major objectives), while internal zones reveal the "how" (tactical path and entry models). When internal structure breaks bullish while within an external bearish range, it signals potential reversal setup. When internal breaks align with external direction, it confirms trend strength.
🔶 Advanced Dual-Pivot Detection Framework
Implements separate pivot calculation systems for external and internal structure with configurable lookback periods optimizing for different swing magnitudes. The system identifies external pivots using extended length capturing major swing extremes, detects internal pivots using compressed length for minor retracement highs/lows, and optionally requires internal pivots occur within current external range boundaries ensuring hierarchical structure coherence.
// Dual Structure Detection
External_Pivot_High = ta.pivothigh(high, External_Length, External_Length)
External_Pivot_Low = ta.pivotlow(low, External_Length, External_Length)
Internal_Pivot_High = ta.pivothigh(high, Internal_Length, Internal_Length)
Internal_Pivot_Low = ta.pivotlow(low, Internal_Length, Internal_Length)
// Optional Range Requirement
Valid_Internal = requireInside ? (pivot within ) : true
🔶 BOS and CHoCH Detection System
Break of Structure (BOS) occurs when price breaks a recent structure point in the direction of the current trend, confirming trend continuation. The system identifies BOS when:
Price breaks above previous high while trend remains bullish (bullish BOS)
Price breaks below previous low while trend remains bearish (bearish BOS)
Previous structure point hasn't been violated yet
Change of Character (CHoCH) signals potential trend reversal when price breaks structure counter to the established trend direction. The system detects CHoCH when:
Price breaks above previous high while trend was bearish (bullish CHoCH - reversal signal)
Price breaks below previous low while trend was bullish (bearish CHoCH - reversal signal)
Both external (e-prefix) and internal (i-prefix) structures generate independent BOS/CHoCH labels, enabling multi-timeframe structure analysis where eCHoCH may signal major reversal while iBOS confirms minor trend within that reversal.
🔶 Intelligent Zone Creation Architecture
Features ATR-based or tick-based zone height calculation with separate sizing for internal and external liquidity levels, creating visual boxes centered on pivot points. The system calculates zone dimensions using configurable ATR multiples (default 0.40x) or fixed tick counts, positions zones symmetrically above/below pivot levels, and applies distinct color schemes distinguishing external highs (red), external lows (white), internal highs (cyan), and internal lows (blue).
🔶 Equal High/Low Detection Mode
Provides advanced internal zone mode that only creates zones when consecutive internal pivots form equal highs or equal lows within ATR-based tolerance, filtering noise and highlighting significant accumulation/distribution patterns. The system tracks previous internal pivots, compares new pivots against tolerance threshold, creates averaged zone when equality detected, and ignores isolated pivots that don't form patterns, reducing visual clutter while emphasizing institutional liquidity clustering.
🔶 Comprehensive Sweep Classification System
Implements three sweep detection modes distinguishing between liquidity grabs and genuine breakouts with state-based zone coloring:
Wick Mode: Marks zone as swept when wick touches but close remains outside
Close Mode: Requires close through zone for sweep classification
Wick+Close Classify Mode: Distinguishes sweeps (S - wick touches, close outside) from breaks (B - close through zone)
The system transitions zones through three states: Active (0 - untouched), Swept (1 - liquidity grabbed), Broken (2 - fully breached), applying progressive transparency increases to visually distinguish state changes and enabling traders to identify false breakouts versus genuine structural violations.
🔶 Objective Arrow Projection Framework
Features intelligent objective labeling that triggers when internal zones are swept, projecting arrows pointing toward opposite external structure as probable targets. The system generates "->ExtH" labels when internal low swept (suggesting move toward external high) and "->ExtL" labels when internal high swept (suggesting move toward external low), providing smart money concept implementation where internal liquidity grabs often precede runs toward external objectives.
🔶 Dynamic Zone Management System
Maintains separate arrays for external and internal zones with configurable history modes and maximum zone limits. The system implements "Latest Only" mode (clears previous external zones of same side when new pivot detected) or "Keep History" mode (preserves all zones up to maximum limit), automatically expires oldest zones when limits reached, and optionally clears all internal zones when new external pivot forms, maintaining clean chart presentation while preserving relevant liquidity context.
🔶 Trend Momentum Scoring Engine
Calculates sophisticated trend state using dual-component analysis combining momentum (price change normalized by volatility) with strength (MA separation and slope alignment). The system generates TrendScore objects containing momentum value, strength percentage, direction (-1/0/+1), and confidence score (0-100), uses these scores to classify BOS versus CHoCH by comparing previous and current trend states, and provides objective structural classification beyond simple price level violations.
🔶 Adaptive Zone Extension Logic
Implements intelligent right-edge management where active zones extend to current bar but freeze at touch/sweep point when cut-on-touch enabled. The system continuously updates zone right boundaries during active state, locks boundary at bar of first violation, and maintains locked position through subsequent bars, creating visual history of when liquidity was accessed while preventing misleading forward projection of filled zones.
🔶 Multi-State Visual Feedback System
Provides comprehensive color and transparency modulation based on zone state with two visual style options. "Soft Fill" mode uses semi-transparent fills with subtle borders, while "Outline" mode displays only colored borders with transparent fills. The system applies progressive transparency increases: Active (light), Swept (medium), Broken (heavy), with independent control over fill and border transparency enabling customization from subtle hints to prominent highlighting.
🔶 Structure Line Visualization Architecture
Creates dashed horizontal lines connecting structure break points to current bar with BOS/CHoCH labels positioned at midpoint between break bar and detection bar. The system draws lines at exact structure level, applies color coding matching bullish (green) or bearish (red) classification, and uses compact labels (eBOS, eCHoCH, iBOS, iCHoCH) for instant structural event identification without cluttering chart with excessive text.
🔶 Performance Optimization Framework
Utilizes efficient array management with configurable maximum limits (default 120 zones each type), automatic cleanup of oldest elements, and optional hiding of filled zones reducing active object count. The system includes intelligent state tracking minimizing recalculation overhead, optimized sweep detection using simple comparison logic, and streamlined zone update loops processing only active zones for consistent performance across extended sessions.
🔶 Why Choose Internal vs External Liquidity Zones ?
This indicator delivers institutional-grade market structure analysis through hierarchical dual-timeframe liquidity mapping with comprehensive BOS/CHoCH detection. The distinction between external (major swing) and internal (minor retracement) structure provides complete smart money concept implementation where external zones define bias and targets while internal zones reveal tactical entries and stop hunts. The system's sweep classification distinguishes liquidity grabs from genuine breakouts, objective arrows project probable targets based on internal sweeps toward external levels, and comprehensive BOS/CHoCH labeling across both timeframes enables multi-dimensional structural analysis. Perfect for order flow traders implementing ICT concepts, liquidity-based strategies, or market maker models in cryptocurrency, forex, and futures markets where understanding the relationship between internal accumulation and external objectives is essential for high-probability trade location and proper risk management. Indikator
Indikator
Breakout Targets [AlgoAlpha]🟠 OVERVIEW
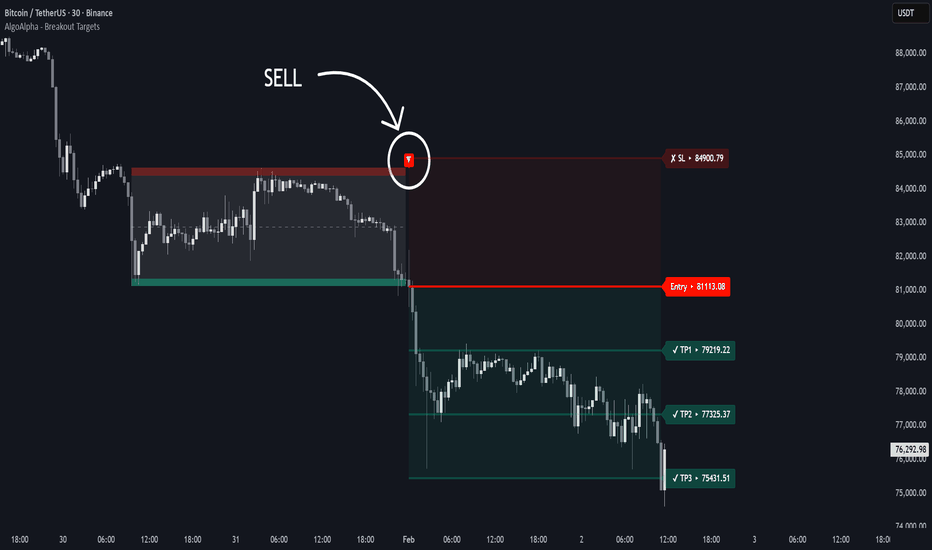
This script identifies consolidation zones and provides automated breakout targets with risk management levels. It focuses on finding periods where price action compresses and then tracks the subsequent breakout from these ranges. When a price breakout is confirmed, the script automatically projects three take-profit (TP) levels and a stop-loss (SL) based on current market volatility. This helps traders move from identifying a range to executing a trade with predefined exit points without manual calculation.
🟠 CONCEPTS
The script uses a relationship between Weighted Moving Averages (WMA) and Exponential Moving Averages (EMA) of price ranges to detect consolidation. When these moving averages cross, it triggers the detection of recent pivot highs and lows to draw a visual "box" or channel. This channel represents the current trading range. Once price closes outside this box, the script uses the Average True Range (ATR) to determine the volatility-adjusted distance for the stop loss. The take-profit levels are then calculated as multiples of this risk distance, ensuring a consistent reward-to-risk approach.
🟠 FEATURES
Dynamic box drawing that highlights potential supply and demand zones within the range.
Real-time breakout signals with bullish (green) and bearish (red) markers.
Automated trade projection including Entry, SL, and three TP levels.
Integrated alert system for breakouts and hits on any profit or loss target.
🟠 USAGE
Setup : Add the script to your chart and adjust the "Range Detection Period." A higher period will find larger, more significant ranges, while a lower period will find smaller, short-term consolidation zones.
Read the chart : Look for the grey boxes on your chart; these represent areas where the market is "coiling." A green arrow label indicates a bullish breakout from the top of the box, while a red arrow indicates a bearish breakout from the bottom. Once a breakout occurs, follow the projected horizontal levels for your trade management.
Settings that matter : The Stop Loss ATR Multiplier is the most critical setting for risk; increasing it will give the trade more room to breathe but will also push your TP levels further away. The Prevent Overlap toggle is useful for keeping the chart clean by ensuring the script doesn't draw new boxes until the current range has been resolved.
Indikator
Indikator