Trinity Reversal Pattern [AlgoAlpha]🟠 OVERVIEW
Trinity Reversal Pattern identifies three-candle reversal structures and marks the price extreme associated with each detected setup. It is designed to separate structured reversal patterns from isolated bullish or bearish candles.
Each valid pattern receives a strength score based on the signal candle's body relative to the largest candle body within a selected lookback. The resulting reversal level remains active until price returns to it or the level reaches its selected expiry. An optional EMA trend filter can restrict patterns to the current trend direction.
🟠 CONCEPTS
Bullish Trinity Reversal — A three-candle structure that begins with two bearish candles. The middle candle trades below the first candle's low while remaining below its high. The third candle closes bullish and extends above the first candle's high. The lowest price across the three candles becomes the bullish reversal level.
Bearish Trinity Reversal — The inverse structure. It begins with two bullish candles, with the middle candle trading above the first candle's high while remaining above its low. The third candle closes bearish and extends below the first candle's low. The highest price across the three candles becomes the bearish reversal level.
Signal Strength — The absolute body size of the signal candle divided by the largest candle body found within the selected Strength Lookback, expressed as a percentage. A value near 100% means the signal candle is close to the largest recent body. This measures relative candle-body strength, not reversal probability or historical win rate.
Reversal Level — The lowest point of a bullish three-candle pattern or the highest point of a bearish pattern. It marks the price extreme associated with the reversal structure and stays active until touched or expired.
EMA Trend Filter — An optional directional filter based on fast and slow EMAs. A fast EMA cross above the slow EMA establishes the bullish state, while a cross below establishes the bearish state. When enabled, bullish patterns are accepted only during the bullish state and bearish patterns only during the bearish state.
🟠 FEATURES
Trinity Reversal Signals — Bullish and bearish markers identify completed three-candle reversal structures directly on the chart.
Reversal Levels — Each detected setup creates a level at its three-candle price extreme. Active levels extend forward and become dotted after they are touched or expire.
Strength Labels — Active reversal levels can display their fixed signal strength percentage for quick comparison between setups.
EMA Trend Gradient — Optional fast and slow EMA lines display the active trend state with a gradient between them.
🟠 HOW TO USE
Watch for a bullish marker after a three-candle downside structure or a bearish marker after the corresponding upside structure.
Compare the strength labels between signals. Higher values mean the signal candle has a larger body relative to the recent candle bodies in the selected lookback.
Increase Minimum Signal Strength to remove patterns with weaker signal candles. Lower it to include a broader range of detected structures.
Treat an active reversal level as the price extreme linked to its original setup. A later wick reaching that price counts as a touch and stops the level from remaining active.
Adjust Level Expiry Bars to control how long untouched reversal levels remain active. Shorter values focus on recent setups, while longer values preserve levels for more bars.
Enable the EMA Trend Filter when you want signals aligned with the current EMA state. In a bullish EMA state, only bullish Trinity patterns are accepted. In a bearish EMA state, only bearish patterns are accepted.
Enable Confirm Signals on Close when you want a pattern to be confirmed only after its signal candle closes. Disabling it allows the current candle to produce a signal before the bar is complete, so the signal can change while the candle develops.
Use alerts to track bullish or bearish Trinity signals, touches of active reversal levels, level expirations, and EMA trend crosses without continuously watching the chart.
🟠 CONCLUSION
Trinity Reversal Pattern combines three-candle reversal structures, relative candle-body strength, persistent reversal levels, and an optional EMA trend filter. It gives traders a structured way to identify reversal setups, compare their relative strength, and track whether their associated price extremes remain active or are revisited.
Indikator

Adaptive Opening Range Context EngineOVERVIEW
Adaptive Opening Range Context Engine is a session-based market structure tool designed to analyze how price behaves around a defined opening range.
Instead of treating every move beyond an opening range as an immediate breakout signal, the engine follows the development of the range through a structured lifecycle. It evaluates range size relative to volatility, participation conditions, price acceptance or rejection outside the range, retests, expansion behavior, and the distribution of activity formed during the opening-range period.
The objective is to provide contextual information about the opening auction rather than predict future price direction.
CORE METHODOLOGY
The engine follows the following analytical sequence:
Opening Range Formation → Range Lock → Range Quality → Break Attempt → Acceptance / Rejection → Retest → Expansion / Failure
The default opening range is calculated from the 09:30–10:00 America/New_York session and can be adjusted from the settings.
The range can be constructed using either High/Low or Close-based boundaries.
RANGE QUALITY
Once the opening range is complete, its width is normalized against ATR.
This produces a relative Range/ATR measurement used to classify the opening environment as:
Compressed
Balanced
Expanded
This normalization helps distinguish a relatively narrow opening range from one that already represents substantial movement relative to recent volatility.
These classifications describe the observed range environment and are not probability estimates.
BREAKOUT LIFECYCLE
Price moving beyond an opening-range boundary does not automatically qualify as sustained acceptance.
The engine distinguishes between:
Upper Break Attempt
Lower Break Attempt
Upper Acceptance
Lower Acceptance
Upper Rejection / Failure
Lower Rejection / Failure
Retest
Expansion
Acceptance requires confirmed price behavior outside the relevant boundary rather than relying solely on an intrabar excursion.
This lifecycle approach is intended to separate a simple boundary test from a more developed structural response.
PARTICIPATION CONTEXT
The engine compares current volume with a rolling volume baseline and classifies participation as:
Light
Normal
Elevated
Volume is used as contextual information rather than as a standalone directional signal.
For instruments where the available volume represents tick volume or another feed-specific measure, the interpretation should be adjusted accordingly.
OPENING RANGE PARTICIPATION PROFILE
The script includes a native Opening Range Participation Profile.
During formation of the opening range, volume from each range bar is assigned to configurable price buckets using that bar's representative price. The resulting distribution is displayed horizontally inside the opening-range structure.
The largest concentration is identified as the OR POC.
This profile is intentionally described as a participation proxy. It is not an exchange order-book reconstruction and should not be interpreted as true transaction-level volume-at-price when the underlying chart data does not provide that information.
Its purpose is to visualize where activity was relatively concentrated during formation of the opening range.
VISUAL SYSTEM
The chart displays:
Opening Range High
Opening Range Low
Opening Range Equilibrium
Opening Range Participation Profile
OR POC
Upper and lower expansion references
Acceptance and rejection lifecycle events
Current opening-range context
Historical opening ranges with reduced visual emphasis
The current session remains visually dominant while completed sessions provide background structural context.
DASHBOARD
The dashboard summarizes the active opening-range environment through:
STATE — current lifecycle state
RANGE — volatility-normalized range classification
RANGE / ATR — opening-range width relative to ATR
VOLUME — current participation classification
MIDPOINT — opening-range equilibrium
CONTEXT — current upper, lower, or neutral structural context
PROFILE — participation-profile status
HOW TO USE
The indicator is designed primarily for intraday analysis.
First allow the configured opening range to form and lock. After the range is established, observe how price interacts with its boundaries.
A move outside the range can then be evaluated together with the engine's acceptance/rejection state, Range/ATR environment, participation context, OR POC, equilibrium, and subsequent retest behavior.
The tool is intended to provide structured context for discretionary analysis. No individual state, level, profile concentration, or lifecycle event should be interpreted independently as a trade instruction.
CONFIRMATION AND LIMITATIONS
The indicator operates from chart data and does not have access to hidden institutional orders or a complete market-wide order book.
Opening-range behavior can vary substantially between instruments and trading sessions.
Volume quality also depends on the underlying data source.
The Participation Profile is an internally constructed proxy based on the bars available during the opening range. It should not be interpreted as tick-by-tick exchange volume-at-price unless the underlying data itself provides that level of information.
ATR normalization describes the relative size of the opening range; it does not forecast the probability or magnitude of a future move.
Acceptance, rejection, retest, and expansion classifications describe observed price behavior and do not guarantee continuation or reversal.
The configured opening session and timezone should be adjusted when analyzing instruments whose primary trading session differs from the default configuration.
ORIGINALITY
Adaptive Opening Range Context Engine was independently developed around a state-based opening-range framework.
Its primary distinction is the integration of volatility-normalized range classification, participation context, confirmed breakout acceptance/rejection, retest and expansion lifecycle tracking, and an internally constructed Opening Range Participation Profile within one coordinated analytical workflow.
These components are designed to interact as parts of the same opening-range state model rather than operate as unrelated indicator modules.
The script is intended for educational and analytical use and does not attempt to reproduce the proprietary methodology of another indicator.
Release Notes — v1.1
Version 1.1
Introduced the native Opening Range Participation Profile and OR POC visualization.
Expanded the visual framework with clearer Opening Range High, Low and Equilibrium references, contextual expansion zones, current-session emphasis and subdued historical opening ranges.
Refined the dashboard to include participation-profile status while preserving the existing opening-range lifecycle, ATR-normalized range classification, volume context and acceptance/rejection framework.
Improved chart presentation and session-object lifecycle management for cleaner intraday analysis. Indikator

Real Fair Value Gaps [GBB]Real Fair Value Gaps
A fair value gap is a three-candle imbalance: the wicks of candle 1 and candle 3 do not overlap, leaving a price range that was never traded. This script finds those gaps on the chart timeframe and on one higher timeframe, tracks each one through its full life (fresh, touched, midpoint tapped, mitigated or inverted), and draws only the ones that matter right now.
What it does differently than other Fair Value Gap indicators
Consumed vs. remaining : As price trades into a gap, the drawn zone shrinks to the unfilled remainder. The consumed part is shown as a dashed fill from the entered edge to the deepest penetration, so you see how much of the gap is actually left, not a full box that price already went through.
Spotlight : Only the N active gaps closest to price carry the full glow (gradient bands, dotted midpoint, origin notch, price chip). Everything else is a thin outline. The chart stays readable with dozens of live gaps.
Freshness : Glow decays to half strength over a set number of bars and then holds. A gap from 300 bars ago looks different from one made ten bars ago.
Inversions : A close beyond the far edge flips the gap into an inverted FVG (IFVG) with the opposite bias instead of retiring it. This is an optional setting
Visibility window : Gaps farther than X ATR from price are tracked but not drawn, so far-away zones do not stretch your price scale.
Higher timeframe without repainting : HTF gaps are built only from completed HTF candles (values are read with a offset) and are anchored to the exact HTF candle times. Auto mode picks one step above your chart (1m→15m, 5m→1H, 15m→4H, 1H→D, 4H→W, D→W).
Everything on confirmed bars. Detection, state changes and alerts all fire on bar close.
Inputs
Detection
Min size (ATR ×) : ignore gaps smaller than a multiple of ATR(14) on the gap's own timeframe. 0 = off.
Auto threshold : keep a gap only if its height relative to price is above the running mean of all candidates seen so far. Overrides Min size.
Require displacement : candle 2 must close beyond candle 1's extreme.
Mitigation
Source : Wick or Close.
Point : Near edge, Midpoint or Far edge (fully filled).
Track inversions : on/off.
Higher timeframe
Enable, and the timeframe (empty = automatic).
Look
Palette : (GBB / Calm blue-amber / Custom), glow intensity, spotlight count, fade length, how long mitigated outlines stay, label mode, and the ATR visibility window.
Display
Info table : active gap counts, nearest gap above and below price, HTF status, and a running fill rate over the loaded bars.
Alerts
New bullish / bearish FVG (chart TF), new HTF bullish / bearish FVG, price entered a gap, midpoint tapped, gap mitigated, gap inverted. All on confirmed bars.
Data window
Active bull count, active bear count, mitigated count, HTF active count, and a last-event code (1 new bull, 2 new bear, 3 touch, 4 midpoint, 5 mitigated, 6 inverted) are exposed as hidden plots for use in your own scripts.
How to read it
The dotted midpoint line is the consequent encroachment level; it disappears once price has consumed it. The small solid notch marks the birth candle. The chip on the right edge shows the midpoint price and tags the gap as HTF or IFVG. A mitigated gap collapses to a grey dashed outline frozen at the bar where it was filled, then drops off after the configured number of bars. Indikator

Wick HunterWick Hunter is an open-source price-action indicator designed to identify contextually significant rejection wicks while filtering out many of the smaller or lower-quality wicks that occur during normal market noise.
The purpose of the script is not simply to mark candles with long wicks. Wick size by itself can be misleading, especially during consolidation or strong directional moves. Wick Hunter evaluates the wick together with its size, candle structure, recent volatility, prevailing trend, and surrounding liquidity context before displaying a signal.
The indicator uses three related types of wick behavior:
TREND-CONTINUATION REJECTION
In a strong directional move, Wick Hunter looks for meaningful pullback wicks that reject back in the direction of the prevailing trend. This helps prevent the script from treating every countertrend wick as a reversal.
LIQUIDITY SWEEP/RECLAIM
The script can identify wicks that trade beyond a confirmed swing level and then reclaim that level. These signals represent rejection after liquidity has been taken rather than an isolated candle pattern.
EXTREME WICK EVENTS
Exceptionally large wicks relative to ATR and recent wick behavior can qualify as significant even when they do not fit a normal continuation setup. This is intended to capture unusually aggressive rejection or displacement. The script does not detect scheduled news events; it detects the resulting price behavior.
All three setup types serve the same purpose: determining whether a wick is significant enough to deserve attention. They are not separate indicators combined for additional features.
Wick Hunter also calculates an internal Wick Quality Score . The score considers actual wick size relative to ATR, wick size relative to recent wicks, how much of the candle is occupied by the wick, the quality of the rejection close, the candle’s size relative to recent price action, and the size of the opposing wick. Signals must meet the required quality threshold before appearing.
A moderate consolidation filter is also included. When price is trading inside a compressed range, Wick Hunter suppresses many middle-of-range wick signals while still allowing meaningful rejection near the edges of the range, confirmed liquidity sweeps, and unusually extreme wicks. This filter exists specifically to reduce low-value signals during sideways price action.
SIGNAL INTERPRETATION
A green upward marker indicates a significant lower-wick rejection.
A red downward marker indicates a significant upper-wick rejection.
The accompanying “Significant Wick” label identifies the qualifying candle. Nearby text labels may be suppressed to prevent visual overlap, but valid signal arrows remain visible.
Wick Hunter can display signals on all chart timeframes, but 15-minute and higher timeframes are recommended . The filtering logic was developed with intraday and higher-timeframe price action in mind, and lower timeframes may contain more noise and more frequent short-lived wick behavior. Users can adjust the thresholds to suit different markets and timeframes.
On live candles, Wick Hunter evaluates conditions as price develops and locks a signal once its criteria are satisfied. Historical candles are evaluated using their completed OHLC data, which can result in differences between intrabar behavior and a fully reloaded historical chart.
Wick Hunter includes alert conditions for bullish and bearish Significant Wick signals.
This indicator is intended as a price-action analysis tool and should not be treated as a complete trading system by itself. Market context, execution, risk management, and independent analysis remain important.
SOURCE VISIBILITY
Open-source. The Pine Script code is publicly available so users can inspect how the indicator works. Indikator

Gap Fill Engine [ES/NQ]A session-open gap tool for index futures. It measures the RTH opening gap against recent daily range, classifies it by size, projects the prior RTH close as the fill target, and keeps a running tally of how often each gap class actually fills on your own chart.
What it does
At the RTH open the script compares the session's opening price to the prior session's closing price. If the gap clears a minimum tick filter, it is measured as a ratio of gap size to daily ATR and sorted into one of four classes — tiny, small, medium, or large — each with its own color.
The script then draws:
A shaded zone spanning the open and the prior close, colored by gap class
A dashed target line at the prior RTH close, the level that defines a fill
A label carrying the gap class and the live fill rate for that class on this chart
An on-chart table of counts and fill percentages by class, plus a separate breakdown of gaps that opened inside the prior session's range versus outside it
Every completed session updates the table, so the statistics are built from the symbol and timeframe you are actually looking at rather than from numbers hard-coded by me.
Why the inside/outside split matters
A gap that opens within the previous session's high–low range has price memory immediately behind it and tends to behave differently from one that opens beyond the prior range, where there is no recent trade to lean on. The script tracks the two populations separately so you can see the difference on your own data instead of assuming it.
Inputs
RTH session window and timezone
Minimum gap size in ticks, to skip noise
ATR length and the three ratio thresholds that separate the gap classes
Toggles for the zone, target line, labels, and statistics table
Table position and size
How I use it
Treat the target line as a reference level, not a signal. A tiny gap with a high historical fill rate on your chart is context for expecting a rotation back toward the prior close; a large gap beyond the prior range is context for expecting continuation and treating the fill as unlikely intraday. The table is there so you can check whether that intuition holds on the contract you trade before you act on it.
Built for ES and NQ, but the logic is symbol-agnostic and will run on anything with a defined session.
Notes
Fill statistics are descriptive of past bars on the loaded chart and carry no predictive guarantee. Results shift with the ATR length, thresholds, and history depth you load. This script is for chart analysis and education only, and is not financial advice or a recommendation to trade. Indikator

Trendline X-RAY
TRENDLINE X-RAY — Multi-Timeframe Wedges & Channels
Most automatic trendline indicators answer a limited question:
“Which two pivots can be connected?”
TRENDLINE X-RAY asks a much more useful question:
"Which multi-timeframe structures are sufficiently well supported to deserve attention?”
Rather than placing arbitrary lines between isolated highs and lows, TRENDLINE X-RAY analyzes wedge and channel geometry across four structural timeframes simultaneously. It evaluates competing structures, scores their quality, and projects the strongest qualifying boundaries onto one chart.
The result is a systematic top-down view of the market’s structural landscape—without repeatedly switching between charts or manually drawing dozens of trendlines.
Why this is more powerful than random trendlines
Almost any two pivots can produce a trendline. That does not make the line meaningful.
A randomly selected trendline may:
Depend on one convenient pair of pivots
Ignore violations between its anchors
Represent only one side of the market
Lack balanced support from the opposite boundary
Be too narrow, too old, or structurally immature
Look convincing only because it was drawn after the move occurred
TRENDLINE X-RAY is designed to reduce that subjectivity.
Instead of treating every possible line equally, its structure engine evaluates complete bilateral formations. Upper and lower boundaries are considered together as a wedge or channel, then measured using several structural criteria:
Boundary touches
Touch spacing
Balance between upper and lower validation
Price violations
Structural span
Width relative to volatility
Anchor recency
Valid convergence and boundary ordering
The indicator compares eligible structures and displays the strongest qualifying geometry for each active timeframe.
This does not mean every projected boundary will hold. It means the displayed lines have passed a consistent structural evaluation instead of being selected arbitrarily.
Multi-timeframe structure on one chart
Markets rarely respond to only one timeframe.
A 5-minute chart may appear to be approaching resistance while the 1-hour chart is near support. A minor intraday breakout may be heading directly into a major 4-hour boundary. Two different timeframes may also identify nearly the same structural area, creating potential confluence.
TRENDLINE X-RAY makes those relationships visible by projecting four independently calculated timeframe structures onto the active chart.
Each slot has its own:
Timeframe
Color
Line width
Line style
Visibility control
Structure-quality reading
This allows traders to distinguish immediate price structure from the larger geometry surrounding it.
Purpose-built analysis modes
TRENDLINE X-RAY includes several top-down presets:
Swing
Weekly
Daily
4-hour
1-hour
Intraday
4-hour
1-hour
30-minute
15-minute
Day Trade
1-hour
30-minute
15-minute
5-minute
Scalp
30-minute
15-minute
5-minute
1-minute
Custom
Four independently selectable timeframes
Changing modes automatically updates the structural hierarchy. Individual slots can still be hidden when a cleaner chart is preferred.
The Structure Quality dashboard
The dashboard provides a compact summary of the active analysis:
Timeframe
Structure Quality
Structure Type
Selected Mode
Structure Quality measures how well the detected formation satisfies the indicator’s structural criteria. It is based on characteristics such as touch validation, balance, violations, span, width, and recency.
A higher score represents stronger structural validation within the model.
It is important to understand what the score does—and does not—mean:
It measures the quality of the detected geometry. It is not directional, and it is not a predicted win rate.
The dashboard can be positioned in nine locations:
Top left, center, or right
Middle left, center, or right
Bottom left, center, or right
Designed as a companion to Automatic Wedge & Channel Detector
TRENDLINE X-RAY was designed to work alongside my "Automatic Wedge & Channel Detector (AWCD)".
The two indicators serve related but different purposes.
Automatic Wedge & Channel Detector answers:
What is the primary wedge or channel governing the chart I am currently trading?
AWCD is the focused execution-chart tool. It identifies the active formation, highlights its boundaries, and helps distinguish actionable edges from the gray middle of the structure.
TRENDLINE X-RAY answers:
What important structures exist above and around my current chart timeframe?
TRENDLINE X-RAY is the top-down context tool. It projects multiple structural layers onto one chart so traders can see whether an AWCD boundary is isolated, supported by a higher-timeframe structure, or approaching conflicting geometry.
Together, they create a structure-first workflow:
TRENDLINE X-RAY identifies the larger structural landscape.
AWCD defines the active execution structure.
Multi-timeframe confluence highlights potentially important locations.
Price action determines whether the boundary holds, breaks, or accepts beyond it.
For example, a lower AWCD boundary becomes more noteworthy when it overlaps a rising 1-hour or 4-hour TRENDLINE X-RAY boundary. Likewise, an AWCD breakout deserves additional caution when it runs directly into higher-timeframe resistance.
TRENDLINE X-RAY is therefore not intended to replace AWCD. It expands AWCD’s structural context.
Practical applications
TRENDLINE X-RAY can be used to:
Conduct top-down analysis without changing charts
Identify higher-timeframe support and resistance
Find multi-timeframe boundary confluence
Recognize when price is trapped between conflicting structures
Avoid entries in structurally poor locations
Evaluate breakout destination and obstruction risk
Compare short-term setups with larger market geometry
Add structural context to opening-range breakouts
Separate execution structure from higher-timeframe context
The indicator is especially useful when asking:
Is price at the edge or in the middle of meaningful structure?
Does a lower-timeframe boundary agree with the higher timeframe?
Is this breakout moving into open space or another major line?
Which structural layer is most likely to matter next?
Is the current formation well validated or relatively weak?
Recommended workflow
TRENDLINE X-RAY is best used as a location and context tool—not as a standalone entry generator.
A practical process is:
Select the mode that matches the intended holding period.
Identify the nearest higher-timeframe boundaries.
Look for agreement between multiple structural layers.
Use AWCD to evaluate the active execution structure.
Wait for price to demonstrate rejection, acceptance, breakout, or retest behavior.
Manage risk independently using predefined invalidation levels.
The strongest use case is not simply:
“Price touched a line.”
It is:
“Price reached a systematically validated structural area, multiple timeframes agree, and price action confirmed the reaction.”
Important limitations
TRENDLINE X-RAY is an analytical tool, not a predictive system.
Trendlines and structural classifications can change as new pivots form.
A high-quality structure can still break.
Lower-timeframe formations are generally more sensitive to market noise.
Different timeframes may produce conflicting information.
Projected lines should not be interpreted as guaranteed reversal levels.
Quality scores do not represent probabilities or historical win rates.
The indicator does not replace risk management or independent analysis.
All calculations are based on historical price structure. Use the indicator to organize market geometry, identify potentially meaningful locations, and improve contextual awareness—not to assume certainty.
TRENDLINE X-RAY transforms trendline analysis from a collection of arbitrary lines into a structured, multi-timeframe decision framework.
AWCD shows the structure you are trading.
TRENDLINE X-RAY shows the structural world surrounding it.
Indikator

Adaptive Structural Liquidity MapDescription
Adaptive Structural Liquidity Map is a market-structure and liquidity visualization tool designed to organize confirmed liquidity references around price and show how those references are distributed above and below the current market.
Rather than treating every swing as equally important, the indicator maintains an adaptive map of active liquidity pools and presents them through a compact visual hierarchy.
How It Works
The indicator processes confirmed structural pivots and maintains qualifying liquidity references on both sides of price.
Each active pool is evaluated within the liquidity engine and displayed according to its relative classification:
HIGH LIQ — comparatively stronger liquidity concentration within the active map.
MED LIQ — intermediate liquidity concentration.
LOW LIQ — comparatively lighter liquidity concentration.
These classifications are relative analytical measurements within the indicator's current active sample. They are not probabilities or guarantees that price will interact with a level.
Liquidity Depth Map
Active liquidity references are displayed as horizontal depth structures extending from their respective price areas.
The visual width and emphasis help distinguish the relative liquidity structure without requiring every historical swing to remain on the chart.
Upper and lower liquidity use separate visual treatment so the distribution around current price can be interpreted quickly.
Liquidity Map Dashboard
The dashboard summarizes the current state of the active map through:
ACTIVE POOLS — number of liquidity references currently maintained by the engine.
BIAS — whether the active liquidity distribution is Upper-Heavy, Lower-Heavy, or Balanced.
NEAREST ↑ — nearest active liquidity reference above current price.
NEAREST ↓ — nearest active liquidity reference below current price.
“Bias” describes the distribution of identified liquidity pools. It is not a directional trade signal.
BOS and CHOCH Context
Confirmed structural breaks are annotated with compact BOS and CHOCH labels.
BOS identifies a confirmed break consistent with the incumbent structural direction, while CHOCH identifies the first confirmed structural break against that direction.
These annotations provide structural context to the liquidity map rather than functioning as standalone entry or exit signals.
Liquidity Sweeps
The indicator can also mark qualifying interactions where price trades through a structural liquidity reference and subsequently closes back through the relevant area.
Sweep markers are contextual events only and should not be interpreted as automatic reversal signals.
ATH and ATL Context
All-Time High and All-Time Low references are tracked independently and displayed with horizontal contextual guides when enabled.
Time-based positioning is used for these historical extremes so old ATH/ATL references can be maintained without relying on distant bar-index placement.
Originality and Intended Use
The indicator combines confirmed structural references, adaptive liquidity-pool maintenance, relative liquidity classification, upper/lower distribution analysis, structural break context, sweep detection, historical extremes, and a compact depth-map visualization into one interacting framework.
Its purpose is to answer a specific analytical question:
Where is the currently identified structural liquidity concentrated, and how is that liquidity distributed around price?
It is intended for market-structure research and contextual chart analysis across different symbols and timeframes.
Calculation Timing
Structural references use confirmed pivot information and therefore become available only after the required confirmation bars have elapsed.
BOS/CHOCH events use confirmed closes. This confirmation process intentionally introduces latency in exchange for avoiding premature structural classification.
Limitations
Liquidity levels represent algorithmically identified structural references, not verified exchange order-book liquidity.
HIGH, MED, and LOW classifications are relative to the indicator's methodology and active sample.
Historical liquidity concentration does not imply that price must revisit, reject, break, or reverse from a displayed level.
ATH/ATL, BOS/CHOCH, sweep markers, dashboard bias, and nearest liquidity references are descriptive analytical context rather than Buy/Sell signals.
The indicator does not provide probabilities, guaranteed outcomes, price targets, or expected returns. Indikator

Momentum Core [MasterTonyTA]# Momentum Core — Publish Description
---
## WHAT IT IS
Momentum Core is a composite momentum oscillator that blends four non-redundant momentum sources into a single normalized reading, then layers on a MACD-derived wave, a volatility/participation regime gate, and health zones that separate tradeable momentum from both chop and exhaustion.
Most momentum oscillators measure the same thing twice. MACD is essentially rate-of-change on EMAs. Stochastic and RSI both measure position within range. CCI overlaps normalized ROC. Stacking those gives you four confirmations of one idea and a false sense of confluence.
This indicator deliberately selects sources that measure **different** things: smoothed directional force, volatility-adjusted velocity, thrust acceleration, and participation. Each is z-scored against its own recent history before being weighted, so no single component can dominate simply because it has a larger raw scale.
---
## HOW TO READ IT
### The Momentum Line (main plot)
The line is the composite reading, squashed to a **-100 to +100** range. Its color encodes two things at once:
| Color | Meaning |
|---|---|
| **Solid green** | Momentum rising, above signal line — clean bullish impulse |
| **Faded green** | Momentum rising, below signal line — early turn, not yet confirmed |
| **Faded red** | Momentum falling, above signal line — exhaustion; the move is decaying while still reading positive |
| **Solid red** | Momentum falling, below signal line — clean bearish impulse |
| **Grey / dimmed** | Regime gate failed — ADX or relative volume too low to trust the reading |
The key read is the **faded states**. A faded red above the signal line is the earliest exit tell in the indicator: price may still be making highs, but the force behind it is already draining. A faded green below the signal is the mirror — the turn has started before the crossover confirms it.
Direction is set by the **slope** of momentum, not by its position. A deadzone input prevents flicker during flat patches — the last direction holds until slope decisively flips.
### The Signal Line (orange)
A 9-period EMA of the composite. It is not a trade trigger on its own; it defines conviction. The wider the gap between momentum and signal, the stronger the current state. Crossovers matter most when they happen **inside a good zone** rather than in chop.
### The Momentum Wave (area fill)
A MACD histogram, z-scored and squashed onto the same scale as the main line. This is the cycle-rhythm layer — it shows you the breathing pattern of impulses.
- **Green** above zero, **red** below zero — always, regardless of the main line's state
- **Transparency scales with magnitude** — solid means a strong impulse, faded means a decaying one
By default the wave carries **zero weight** in the composite, so it is purely visual. This is intentional: MACD overlaps TSI, and scoring both double-counts the same signal. The weight input exists if you want it, but keep it at or below 0.5.
The wave's most useful read is **disagreement with the main line**. When the line is green and the wave is fading toward zero, the impulse is losing its engine.
### The Zones
Four regions, defined by two boundaries per side:
- **Bull good zone (+15 to +60)** — shaded green. Momentum is meaningfully positive but not stretched. This is where trends actually run.
- **Bear good zone (-15 to -60)** — shaded red. Same logic, downside.
- **Chop zone (-15 to +15)** — shaded neutral. Momentum lacks conviction. Signals here have the worst expectancy in the entire indicator.
- **Overextended (beyond ±60)** — unshaded. Momentum is stretched; continuation still happens, but reward-to-risk on new entries is poor and mean reversion risk is elevated.
Treat zones as a filter, not a signal. A crossover in the good zone and the identical crossover in chop are not the same event.
### Divergence Labels
**D** labels mark divergence between the composite and price, detected on confirmed pivots. A bullish divergence prints when price makes a lower low while momentum makes a higher low; bearish is the inverse. Labels are offset back to the pivot bar, so they confirm with a lag equal to the right-pivot setting — this is by design, since unconfirmed pivots repaint.
---
## THE CALCULATIONS
### Step 1 — Component extraction
**TSI (True Strength Index)** — double-smoothed momentum, default 13/25. Chosen over MACD because the double smoothing removes most whipsaw while keeping the zero-line cross meaningful.
**ATR-Normalized ROC** — `(close - close ) / ATR(n)`. Dividing by ATR is what makes this portable: a 2% move in a quiet tape and a 2% move in a volatile one produce very different readings, which is correct. Raw ROC would treat them identically.
**RSI Velocity** — the *change* in RSI over a short window, not the RSI level itself. Level tells you where you are in the range; velocity tells you how hard you are moving through it. Velocity turns first.
**OBV Slope** — change in OBV over n bars, normalized by average volume so it scales across instruments. This is the participation check. Momentum without volume behind it is a fade waiting to happen.
### Step 2 — Normalization
Each component is converted to a **z-score** against its own trailing mean and standard deviation over the lookback window:
```
z = (value - SMA(value, len)) / STDEV(value, len)
```
This is the step that makes the blend legitimate. Without it, TSI (roughly ±100 scale) would swamp OBV slope (unbounded, instrument-dependent) regardless of the weights you set. After z-scoring, every component speaks the same language: standard deviations from its own normal.
### Step 3 — Weighted composite and squash
Z-scores are combined as a weighted average, then compressed through a logistic function:
```
raw = Σ(zᵢ × wᵢ) / Σ(wᵢ)
mom = 100 × (2 / (1 + e^(-raw × 0.9)) - 1)
```
The sigmoid squash bounds the output to ±100 while preserving resolution in the middle of the range, where most trading decisions actually happen. A hard clamp would flatten all extreme readings into an identical value and destroy the distinction between "strong" and "absurd." The sigmoid compresses the tails smoothly instead.
Default weights: TSI 1.2, ROC 1.0, RSI velocity 0.8, OBV slope 0.7, wave 0.0.
### Step 4 — Signal and acceleration
```
signal = EMA(mom, 9)
accel = EMA(Δmom, 3)
```
`accel` is the second derivative of momentum — the rate of change of the rate of change. It drives the line's directional coloring and the exhaustion alerts. This is the component most oscillators omit entirely, and it is what lets the indicator flag a decaying impulse before any crossover occurs.
### Step 5 — Regime gate
```
gateOK = ADX ≥ threshold AND relativeVolume ≥ threshold
```
When the gate fails, the momentum line dims to grey. Nothing is hidden or suppressed — you still see the full reading — but the visual weight drops, because momentum readings during low-ADX, low-participation conditions are mostly noise. Relative volume is current volume against its 20-period average.
---
## SETTINGS THAT MATTER MOST
**Z-Score Lookback (default 100)** — the single most impactful input. This is the window that defines "normal." For intraday and short-dated options work, drop it to **50**; the 100-bar window is too slow to adapt within a session. For daily and swing timeframes, leave at 100 or extend to 150.
**ROC Length (default 14)** — pair with the lookback. Intraday, drop to **7**.
**Slope Deadzone (default 0.15)** — raise toward 0.3 if the line flips color more often than you want. This trades responsiveness for stability.
**Wave Sensitivity** — the divisor in the wave transparency calculation. Lower it to 35 if the wave rarely reaches full opacity on your instrument; raise to 70 if everything saturates.
**Weights** — the defaults are a reasonable starting point, not a result of optimization. If you trade a volume-thin instrument, cut the OBV weight. If you trade something gappy, lean harder on the ATR-normalized ROC.
---
## ALERTS INCLUDED
- Momentum Flip Bull / Bear — zero cross with the regime gate passing
- Bull / Bear Exhaustion — momentum at an extreme while decelerating
- Bullish / Bearish Divergence
- Wave Flip Bull / Bear — momentum wave crossing zero
- Wave Stalling — wave rolling over without crossing
- Enter Bull Zone / Enter Bear Zone
- Overextended
---
## NOTES AND LIMITATIONS
Divergence labels confirm on a lag equal to the right-pivot setting. This is unavoidable in honest pivot detection — anything faster repaints.
The z-score normalization means readings are **relative to recent history**, not absolute. A +70 reading in a quiet regime and a +70 in a volatile one represent different raw moves. This is the intended behavior, but it means you should not port threshold settings between instruments without checking them.
This is an indicator, not a system. It has no position sizing, no stop logic, and no backtest attached. Zones and gates are filters that improve signal quality; they do not create an edge on their own.
---
*Author: MasterTonyTA* Indikator

Adaptive Candlestick Context ScannerOVERVIEW
Adaptive Candlestick Context Scanner is a contextual candlestick-pattern study designed to evaluate candle formations together with the market conditions in which they develop.
Rather than treating every matching candle shape equally, the scanner combines pattern geometry with prior trend, ATR-normalized measurements, and structural swing location.
The analytical workflow is:
Pattern Geometry → Prior Trend → Volatility Normalization → Structural Location → Context Quality → Confirmed Classification
The objective is to provide a structured way to study candlestick behavior while reducing some of the ambiguity associated with shape-only pattern recognition.
CORE METHODOLOGY
1. Pattern Geometry
The scanner evaluates candle bodies, upper and lower wicks, relative candle relationships, and multi-candle structures according to transparent pattern definitions.
STANDARD mode uses broader geometric requirements, while STRICT mode applies tighter qualifying conditions.
2. Prior Trend Context
Certain candlestick formations have different contextual meaning depending on the movement preceding them.
An adaptive trend component therefore evaluates the preceding price structure before contributing to a pattern's contextual assessment.
3. ATR Normalization
Fixed price-distance thresholds can behave inconsistently across instruments and volatility regimes.
ATR normalization allows relevant geometric and location measurements to scale with current market volatility.
4. Structural Location
The scanner evaluates whether a formation develops near recent swing extremes.
This provides an additional structural layer instead of evaluating the candle formation in isolation.
5. Context Quality
Qualified patterns receive a Context Quality measurement derived from pattern anatomy, prior-trend context, and structural location.
This value measures conformity to the scanner's internal contextual criteria.
Context Quality is not a probability, expected win rate, or forecast of future performance.
PATTERN COVERAGE
The scanner includes bullish, bearish, and neutral candlestick families, including single-candle and multi-candle structures.
Examples include:
Hammer and Inverted Hammer
Hanging Man and Shooting Star
Bullish and Bearish Engulfing
Bullish and Bearish Harami
Piercing Line and Dark Cloud Cover
Morning Star and Evening Star
Tweezer Bottom and Tweezer Top
Counter Attack formations
Sash formations
Separating Lines
Rising and Falling Windows
Rising Three and Falling Three
Three White Soldiers and Three Black Crows
Doji, High Wave, and Spinning Top
Bullish and Bearish Marubozu
PER-PATTERN CONTROL
Individual pattern families can be configured independently.
Available states include:
DEFAULT — follows the scanner's primary detection mode
OFF — disables the selected pattern
STANDARD — uses standard qualification criteria
STRICT — applies tighter qualification criteria
This allows the scanner to be adapted without requiring every candlestick family to use identical detection settings.
MULTIPLE-PATTERN RESOLUTION
More than one candlestick definition can occasionally qualify around the same price structure.
The scanner provides configurable resolution behavior, including:
Highest Quality — prioritizes the strongest contextual assessment
Highest Priority — follows the scanner's defined pattern hierarchy
All Qualified — allows qualified formations to be retained according to the selected display behavior
This helps control visual density while preserving analytical flexibility.
VISUAL SYSTEM
The scanner includes:
Premium bullish and bearish candle styling
Directional pattern markers
Full or compact pattern names
Context-quality labels
Controlled historical label retention
A compact real-time information dashboard
The dashboard displays the current detection mode, prior-trend context, most recently confirmed pattern, its Context Quality reading, and the selected resolution method.
ALERTS
Alert functionality is available for confirmed contextual pattern detections.
Directional alert categories support bullish, bearish, and neutral formations, while the scanner can also provide pattern-specific information through its dynamic alert workflow.
Alerts should be treated as notifications that a defined pattern condition has been detected, not as trade instructions.
HOW TO USE
The scanner can be used to study how candlestick formations interact with broader price context.
A pattern appearing near a relevant structural location with stronger contextual alignment may warrant different analytical attention than the same geometric formation appearing in an unrelated part of the price structure.
Users can adjust detection strictness, minimum Context Quality, pattern selection, and display behavior according to the instrument and timeframe being studied.
The scanner is designed as an analytical and educational tool and should be combined with broader market structure, risk management, and independent analysis where appropriate.
CONFIRMATION AND LIMITATIONS
Pattern labels are evaluated on confirmed bars.
Multi-candle formations require their defining candles to complete before classification.
Candlestick formations describe observed price structure; they do not guarantee subsequent market direction.
Context Quality represents conformity to the scanner's internal evidence criteria and must not be interpreted as probability, expected profitability, or future performance.
Different instruments, sessions, volatility regimes, and timeframes can produce materially different pattern behavior.
ORIGINALITY
Adaptive Candlestick Context Scanner uses an independently developed contextual framework that integrates transparent candlestick geometry with trend context, volatility normalization, structural location, contextual scoring, conflict resolution, and controlled visualization.
Its purpose is not to reproduce a proprietary candlestick methodology, but to provide an original framework for contextual pattern analysis.
Release Notes — v1.1
Adaptive Candlestick Context Scanner v1.1
This update expands the scanner's configuration and contextual-analysis framework.
Key improvements include per-pattern DEFAULT/OFF/STANDARD/STRICT controls, configurable multiple-pattern resolution, independent compact/full pattern naming, enhanced contextual quality assessment, expanded alert handling, and dashboard refinements.
The underlying objective remains unchanged: evaluate confirmed candlestick formations within market context rather than treating candle geometry as a standalone directional signal. Indikator

Mean-Reversion Half-Life [RC Tools]RC Tools — Mean-Reversion Half-Life
────────────────────────────────────────────────────────────────────
█ OVERVIEW
Knowing a market is "mean-reverting" isn't enough to trade it — a series that takes 5 bars to snap back and one that takes 50 bars to snap back are both technically mean-reverting, but call for completely different holding periods and expectations. This tool estimates that missing number directly: the half-life, in bars, of mean reversion, using the same Ornstein-Uhlenbeck-style regression approach used in quantitative statistical-arbitrage research.
█ WHAT IT DOES
Estimates mean-reversion speed via a rolling OLS regression and classifies each confirmed bar as Fast Mean-Reversion, Slow Mean-Reversion, or No Mean-Reversion based on the resulting half-life. Colours the chart background accordingly, plots the half-life (in bars, capped for readable scale) as a histogram against Fast and No-Reversion threshold lines, and shows a table with the current state, its estimated half-life, and historical base rates (average forward return and win rate) for each state.
█ THE THEORY BEHIND IT
This is a companion tool to RC Tools' Hurst Exponent Regime script, and answers the natural follow-up question it leaves open. The Hurst Exponent tells you whether a market's statistical character is trending, mean-reverting, or a random walk — but it doesn't say how fast a mean-reverting move actually closes. This tool fits a simple version of the Ornstein-Uhlenbeck model, a classical stochastic process used to describe a quantity that drifts back toward a long-run mean at a speed proportional to its current distance from that mean, and converts the fitted speed into a half-life: the number of bars it takes, on average, to close half the current deviation.
█ HOW IT IS CALCULATED
1. Take the log of price, and regress its bar-to-bar change against its own prior level (a one-lag OLS regression): Δy = α + β·y(prior), where y is log price.
2. A negative β implies mean reversion — the more negative, the faster the pull back toward the mean. A β at or above zero implies no reversion (the series is trending or behaving like a random walk).
3. Convert β into a half-life: -ln(2) / β, in bars.
4. Classify: half-life at or below the Fast threshold (default 10 bars) → Fast Mean-Reversion. Above that but at or below the No-Reversion threshold (default 60 bars) → Slow Mean-Reversion. Above the cap, or β non-negative → No Mean-Reversion (the series isn't reliably reverting, or the estimate is too unstable to trust).
β is smoothed before the half-life calculation (rather than smoothing half-life itself), because half-life is numerically unstable near a zero slope and can spike to extreme values that a direct smoothing pass wouldn't tame cleanly.
Classification occurs ONLY on confirmed bar close — the plotted half-life, the background colour and the table all update together, so nothing here can disagree mid-bar or flip back and forth as the current bar forms.
█ SETTINGS & CONFIGURATION
• Source (default close)
• Regression Window (default 50 bars) — longer windows give a more stable estimate but react slower to a genuine regime change
• Fast Mean-Reversion Threshold (default 10 bars) and No-Reversion Threshold (default 60 bars) — the half-life cutoffs between the three states
• Smoothing Length and Type (default 3-period EMA) — applied to the regression slope, not the half-life itself
• Forward Return Window (default 20 bars) — the horizon used for the base-rate table
• Table visibility, position and colours are fully configurable; the main-chart background painting can be toggled off if you only want the statistics pane
█ HOW TO USE IT
Use it to calibrate holding periods and expectations for a mean-reversion approach, not as a standalone entry signal. A Fast Mean-Reversion reading suggests a short-holding-period approach is appropriate; a Slow reading suggests patience is required and tight stops may cut off the reversion before it completes; a No Mean-Reversion reading suggests a mean-reversion approach isn't currently well-suited to this market at all. Pairs naturally with the Hurst Exponent Regime tool — Hurst tells you IF the market's character favours mean reversion, this tool tells you roughly HOW FAST.
Works on any asset and timeframe with sufficient history for the Regression Window.
█ LIMITATIONS
• This is a SIMPLE linear (OLS) estimate of mean-reversion speed, not a full maximum-likelihood Ornstein-Uhlenbeck fit. It is a practical approximation, not a research-grade estimator.
• Half-life describes an estimated SPEED, not a guarantee of reversion — a series classified as mean-reverting can still trend away for an extended period before, or instead of, reverting.
• Near a regression slope of zero, the raw half-life estimate is numerically unstable and can spike to very large values; display values are capped for readability.
• The regression window assumes the mean-reversion relationship is roughly stable across the window; a structural break partway through will distort the estimate until it fully rolls off.
• Shorter windows react faster but produce noisier, less reliable estimates; longer windows are more stable but slower to reflect a genuine change.
• Historical base-rate stats need a meaningful sample count (check N) before being trusted, especially for the less common states.
• This script does NOT repaint. All classification updates on confirmed bar close only.
█ DISCLAIMER
For educational and informational purposes only. Nothing here is financial advice. Past behaviour of any mean-reversion state does not indicate future results. Trade at your own risk.
Indikator

Daily Swing Trader PRO v3.2 # Daily Swing Trader PRO
**Daily Swing Trader PRO** is a rules-based swing-trading indicator designed primarily for traders who use the **daily chart** and want a simple way to combine trend, momentum, volume, volatility, entry quality, and risk management into one TradingView script.
The indicator is built around a **trend + pullback/breakout + confirmation** approach. Instead of relying on a single indicator, it combines several commonly used technical tools to identify higher-quality swing-trading setups.
## Main Features
Daily Swing Trader PRO includes:
* 10 EMA
* 21 EMA
* 50 SMA
* 200 SMA
* SuperTrend
* RSI
* Relative Volume (RVOL)
* ATR and ATR %
* Bullish pullback detection
* Bullish breakout detection
* Bearish breakdown detection
* Bearish failed-rally detection
* BUY signals
* STRONG BUY signals
* SELL signals
* STRONG SELL signals
* Automatic entry level
* Automatic stop-loss level
* Configurable reward/risk target
* TAKE PROFIT signals
* STOP LOSS signals
* Detailed TradingView alerts
* Daily Swing dashboard
* Signal notification panel
* Automatic light/dark chart theme support
## Trading Philosophy
The indicator follows a simple principle:
**Trend first → Price action second → Volume and momentum confirmation → Risk/reward → Trade**
Indicators are used as confirmation rather than as standalone reasons to enter a trade.
The goal is to avoid weak setups, avoid chasing extended stocks, and focus on trades where multiple technical factors are aligned.
# How to Use Daily Swing Trader PRO
## Recommended Timeframe
The indicator is designed primarily for the:
**1-Day / Daily chart**
The default settings are optimized around daily-chart swing trading.
## Bullish Trend Requirements
The script looks for a bullish environment when:
* Price is above the 50 SMA
* Price is above the 200 SMA
* Price is above the 21 EMA
* 10 EMA is above the 21 EMA
* 21 EMA is rising
* SuperTrend is bullish
* RSI is above 50
* Relative volume meets the selected minimum
* ATR volatility meets the minimum requirement
* Price is not excessively extended above the 21 EMA
These conditions help reduce signals that occur during weak or sideways trends.
## BUY Signal
A **BUY** signal can occur when the bullish trend requirements are satisfied and one of the following setups appears:
### Pullback Setup
Price pulls back toward the 10 EMA or 21 EMA and then shows bullish confirmation.
Typical confirmation includes:
* Price holding the EMA support area
* Bullish daily candle
* Close above the previous day's high
* Price closing back above the 10 EMA and 21 EMA
* Adequate relative volume
This setup attempts to enter an existing trend after a controlled pullback instead of chasing price.
### Breakout Setup
A breakout setup occurs when price closes above the highest price of the selected breakout lookback period.
The indicator also requires bullish trend, momentum, volume, and volatility conditions before generating the signal.
## STRONG BUY Signal
A **STRONG BUY** requires the normal BUY conditions plus stronger confirmation.
Default requirements include:
* Bullish trend
* Valid pullback or breakout
* RSI approximately 55–70
* RVOL of at least 1.20
* Strong bullish candle close
* Price not excessively extended
* Bullish SuperTrend
STRONG BUY is intended to identify the highest-quality bullish setups produced by the system.
## SELL Signal
SELL is the bearish counterpart to BUY.
The script looks for:
* Price below the 50 SMA
* Price below the 200 SMA
* Price below the 21 EMA
* 10 EMA below the 21 EMA
* Falling 21 EMA
* Bearish SuperTrend
* RSI below 50
* Adequate relative volume and volatility
A SELL signal may occur after either a bearish breakdown or a failed rally into resistance.
For traders who only trade long positions, SELL can also be used as a warning that bullish conditions have deteriorated.
## STRONG SELL Signal
A **STRONG SELL** requires additional bearish momentum and volume confirmation.
It is designed to identify the strongest bearish setups and may be useful for traders evaluating short positions or long-put option setups.
# Entry, Stop and Take Profit
When a new trade signal appears, the script automatically calculates:
**Entry:** Signal candle closing price
**Stop Loss:** Based on the recent swing high or swing low plus an ATR buffer
**Take Profit:** Based on the selected reward/risk multiple
The default target is:
**2R — approximately 2:1 reward/risk**
Example:
Entry: $100
Stop: $95
Risk: $5
2R Take Profit: $110
The reward/risk target can be adjusted in the indicator settings.
## Stop-Loss Logic
For long trades, the stop is placed below a recent swing low.
For bearish trades, the stop is placed above a recent swing high.
An ATR buffer is added to reduce the chance of being stopped out by normal price movement.
## Take-Profit Logic
When price reaches the calculated target, the indicator produces a:
**TAKE PROFIT**
signal.
The script also tracks STOP LOSS events.
Because a daily candle only provides open, high, low, and close information, if both the stop and profit target are touched on the same daily candle, the script uses the conservative assumption that the stop was reached first.
# Avoiding Extended Trades
One of the most important filters in Daily Swing Trader PRO is the **maximum extension from the 21 EMA**.
The default is:
**2 ATR**
If price becomes too extended above or below the 21 EMA, new entries are filtered out.
This is designed to reduce late entries after unusually large price moves.
# Relative Volume
Relative Volume compares current volume with average recent volume.
Default values:
Normal signal: **RVOL ≥ 1.00**
Strong signal: **RVOL ≥ 1.20**
Higher RVOL generally indicates stronger participation behind the move.
# RSI
RSI is used as a momentum filter rather than simply as an overbought/oversold indicator.
For bullish trades, the script generally looks for RSI above 50.
STRONG BUY signals typically require RSI in the stronger momentum zone of approximately:
**55–70**
Bearish signals use the opposite momentum structure.
# ATR
ATR is used for several purposes:
* Measuring volatility
* Preventing trades in stocks with insufficient movement
* Measuring price extension
* Calculating stop buffers
* Helping evaluate swing-trading opportunity
The dashboard displays both ATR and ATR as a percentage of price.
# Dashboard
The **Daily Swing Dashboard** appears in the top-right corner of the chart.
It displays information such as:
* Current trend
* Trade status
* Last signal
* Setup type
* RSI
* RVOL
* ATR
* ATR %
* Entry
* Stop
* Profit target
The **Signal Notification Panel** appears in the bottom-right corner and displays the most recent trading event.
# TradingView Alerts
The indicator includes individual alert conditions for:
* STRONG BUY
* BUY
* STRONG SELL
* SELL
* TAKE PROFIT
* STOP LOSS
Detailed alerts can include:
* Ticker
* Current price
* Entry
* Stop
* Take-profit target
* Reward/risk
* RSI
* RVOL
* ATR
* ATR %
For daily swing trading, alerts are best evaluated after the daily candle has closed so that the setup is confirmed.
# Suggested Workflow
A practical workflow is:
1. Start with stocks already showing a strong trend.
2. Use the daily chart.
3. Wait for BUY or STRONG BUY rather than chasing large candles.
4. Check nearby support and resistance.
5. Confirm that the profit target has enough room before major resistance.
6. Review earnings and major market-event risk.
7. Enter only if the chart still offers acceptable reward/risk.
8. Use the calculated stop rather than widening the stop after entering.
9. Take profit at the target or manage the position with your own trailing-stop rules.
For conservative use, traders may choose to treat:
**STRONG BUY / STRONG SELL = potential trade signals**
and
**BUY / SELL = watchlist or early-warning signals**
# Default Settings
The default settings are intended as a starting point:
10 EMA: 10
21 EMA: 21
50 SMA: 50
200 SMA: 200
SuperTrend ATR: 10
SuperTrend Factor: 3.0
RSI: 14
RVOL Lookback: 20
Normal RVOL: 1.00
Strong RVOL: 1.20
ATR: 14
Maximum Extension: 2 ATR
Swing Stop Lookback: 5 bars
Take Profit: 2R
Different securities and market conditions may require different settings.
# Important Notes
Daily Swing Trader PRO is not designed to predict the market.
No technical indicator can guarantee profitable trades. Signals should be combined with proper position sizing, risk management, market context, support and resistance, earnings awareness, and individual trading judgment.
Historical signals do not guarantee future performance.
This indicator is provided for educational and informational purposes only and should not be considered financial or investment advice.
Indikator

Liquidity Sweep Follow-Through GuardA wick through an obvious high or low is often called a liquidity sweep. The useful question is what price does after the level is reclaimed.
**Liquidity Sweep Follow-Through Guard** identifies a sweep of a prior lookback extreme, requires a close back inside that reference, and then evaluates the reversal through holding, extension and path efficiency. The swept level, extreme and ATR reference are frozen when the episode begins.
## Visual guide
- **S+** — a prior low was swept and reclaimed, opening a bullish observation.
- **S−** — a prior high was swept and reclaimed, opening a bearish observation.
- **Shaded zone** — the area between the reclaimed level and the sweep extreme.
- **Orange line** — the frozen reference that must remain reclaimed.
- **Blue line** — the minimum reversal extension.
- **F+ / F−** — efficient bullish or bearish follow-through was confirmed.
- **R** — a confirmed close lost the reclaimed reference.
- **X** — a confirmed close crossed the sweep extreme and fully failed the setup.
- **T** — the observation window expired without a terminal result.
The display is intentionally compact. It has no table and requires no companion indicator.
## Sweep detection
The reference is the highest high or lowest low of the previous 20 completed bars. The current candle must exceed that level by at least 0.10 previous-bar ATR, close back inside it, and devote at least 35% of its range to the rejection wick. References exclude the current bar and are never backdated.
If one exceptional candle sweeps both sides, the candle’s closing direction resolves which episode is tracked. Only one episode can be active at a time.
## Follow-through test
The default confirmation requires:
1. Two consecutive closes remain on the reclaimed side of the frozen reference.
2. Price travels at least 0.30 frozen ATR from the sweep candle close in the reversal direction.
3. Directional progress represents at least 45% of the cumulative close-to-close path after the sweep.
Path efficiency distinguishes direct follow-through from an equally large but noisy move. Repeated back-and-forth closes add traveled path without adding the same directional progress.
## Example
Suppose the lowest low of the prior 20 bars is 100 and frozen ATR is 4. Price trades down to 99.4, then closes at 101 with a qualifying lower wick. The orange reference remains 100 and the default extension target is 102.2. If two closes hold above 100, price reaches 102.2 and efficiency is at least 45%, **F+** is printed. A later close below 100 prints **R**. A close below 99.4 prints **X** and takes priority.
## Behavior and limitations
All state changes and markers occur on confirmed bars. The script uses no future bars, pivot backdating or lookahead requests. Wicks detect the initial sweep, while failure outcomes require confirmed closes.
A sweep is a price pattern, not proof of orders, stop placement or participant intent. Thresholds behave differently across symbols and timeframes. The indicator does not predict outcomes, place trades, size positions or model fees, slippage, liquidity and execution. Standard candles are recommended for interpreting its price-based rules.
BotTradeLab — Human judgment, AI-assisted analysis. Indikator

ICone buy and sell with smc# ICone v2.6 — Complete Trading System (Investment Circle)
ICone turns your chart into a full decision-making system: quality-filtered signals, automatic risk/reward visualization, smart money concepts, volume analysis and macro context — all in one tool, designed so that even beginners instantly understand what to do.
**🎯 One clear instruction — never guess again**
The engine trades three setup types: trend continuations (pullback-to-MA20 with momentum, volume and multi-timeframe confirmation), breakout-retest patterns from compression, and liquidity sweeps (confirmed false breakouts traded as reversals). Every setup is scored 0–100 and gated by the daily trend. The chart stays clean — you only see **ENTRY LONG / ENTRY SHORT** where a position is actually taken. When flat, a **WATCHING label** tells you exactly what the engine is waiting for.
**🟥🟩 Risk/Reward painted on the chart**
The moment a trade opens, the entire plan is drawn automatically: a **red zone** from entry to stop-loss (your risk) and **green stepped zones** up through TP1–TP4 (your reward) — like TradingView's position tool, but automatic on every signal. Lines carry R-multiples (−1R, +1R… +4.5R) and sell percentages ("TP1 – SELL 25%"). The stop moves to break-even after TP1 and trails after TP2. An optional **ADD-ON level** at −0.5R marks where to scale in. All graphics are cleaned up when the trade closes. Colors and opacity are fully customizable.
**💳 Trade Card in real money**
A compact card shows the trade in currency, not just percent: stake, risk to SL, potential at TP4, risk/reward ratio and live P/L — updating in real time. A gold **NEXT TARGET flag** points at the current objective and counts down the distance.
**🧭 Live Position Guide**
While in a trade, the guide reads the chart and escalates plain-language advice — *"Sell 25% now" → "Sell 75%" → "Close everything"* — with the reason (momentum fading, false breakout against you, macro turning). It patiently waits until TP1 is reached before advising exits, letting winners breathe.
**🌍 Gold Macro Score (−100 to +100)**
Fourteen weighted drivers — real yields, DXY, Fed liquidity, ETF flows, miners, silver, credit, VIX — compressed into one verdict from STRONG BULL to STRONG BEAR, vetoing trades that fight the macro tide.
**📊 Full smart-money context**
Market structure (HH/HL, BOS/CHoCH), buy/sell zones (order blocks), iFVG, PDH/PDL/PWH/PWL, session highs/lows, liquidity pools, yesterday's POC and a side volume profile with the highest-volume node highlighted.
**🖥️ Beginner-friendly dashboard**
A wide panel that opens with the answer everyone wants: **"WHAT TO DO RIGHT NOW"** — followed by market regime, signal strength, all timeframes in %, the macro score and a multi-asset overview. Every row explains itself on hover.
**⚙️ One-click profiles & alerts:** "Gold optimized" and "Index optimized" apply the full tested configuration instantly. A single alert covers entries, take-profits, warnings and advisor actions.
*Past performance never guarantees future results. Always forward-test on your own instrument and timeframe before trading live. Not financial advice.*
Strategi

5-Minute Bias + Level + Reaction Breakout Scalp5-Minute Reaction Breakout Scalp
A mechanical, single-timeframe trend-continuation tool: bias → key level → reaction candle → breakout entry, with a built-in daily trade cap.
Overview
This indicator automates a simple, rules-based day-trading approach: trade only in the direction of the current 5-minute structure, wait for price to react at the most recent key swing level, and enter on a confirmed breakout of that reaction candle with a fixed risk/reward target. It is intentionally minimal by design — one setup, one direction at a time, and a configurable cap on how many new trades it will flag per day.
It is built for fast intraday charts (5-minute is the intended timeframe, though it will run on any timeframe) and works on futures, forex, or any liquid instrument with clean intraday structure.
How It Works
1. Bias — The script tracks confirmed swing highs and swing lows. Bias flips to bullish when price closes above the most recent swing high, and to bearish when price closes below the most recent swing low. No trades are considered while bias is neutral.
2. Key Level — In an uptrend, the script watches the most recent swing low (support). In a downtrend, it watches the most recent swing high (resistance). This level is plotted directly on the chart.
3. Reaction — When price trades within a configurable ATR-based tolerance of the key level and prints a candle that closes back in the direction of the bias, the setup "arms." An optional filter can require a genuine rejection wick before a candle counts as a valid reaction.
4. Breakout Entry — Once armed, the script waits for price to break the high (long) or low (short) of that reaction candle. You can choose whether this triggers immediately on a wick, or only on a confirmed bar close.
5. Risk Management — A stop is placed beyond the reaction candle/key level (with a small ATR buffer), and a target is calculated as a configurable multiple of that risk (default 1.5R). The script tracks the trade to its stop or target and keeps a running daily win/loss count.
6. Daily Cap — A configurable maximum number of new trades per day (default: 1) keeps the tool aligned with a "one setup, done" mindset rather than encouraging overtrading.
Key Features
Automatic bias detection from swing structure
Dynamic key level plotted on the chart
Reaction-candle detection with optional wick-rejection filter
Configurable breakout confirmation (wick vs. close)
Auto-calculated stop and target lines drawn on the chart
Daily trade cap with live win/loss tracking
On-chart status dashboard (bias, setup status, active trade, trades today, wins/losses)
Alerts for both the reaction event (setup armed) and the confirmed breakout entry (BUY/SELL)
Inputs
Swing Pivot Length — sensitivity of the swing-high/low detection that drives bias and the key level
ATR Length / Level Proximity Tolerance — how close price must come to the key level to count as a reaction
Require Rejection Wick — optional stricter reaction filter
Breakout Confirmation — wick break (immediate) or close break (confirmed)
Max Bars to Wait for Breakout — how long an armed setup stays valid before being discarded
Reward Multiple (R) and Extra Stop Buffer — risk/reward configuration
Max New Trades per Day — daily trade cap
Full display controls for levels, reaction markers, trade lines, labels, and the dashboard
Alerts
Bullish Reaction at Support / Bearish Reaction at Resistance — fires the moment a setup arms, before any breakout
Any Reaction (Long or Short) — combined version of the above
Reaction Breakout BUY / Reaction Breakout SELL — fires only once the breakout is confirmed and a trade is actually signaled
How to Use It
Wait for the dashboard to show a clear bias. When a "Reaction" label appears at the plotted key level, the setup is armed — this is your cue to start paying attention, not an entry itself. An entry is only signaled once the breakout triangle/label appears, at which point the stop and target lines show the trade's risk/reward. Once the daily trade cap is reached, the script will not flag further entries until the next session.
Important Notes
This script is a mechanical translation of a discretionary trading concept into a fixed rule set. It does not predict the market, and past behavior of any rule-based system is not a guarantee of future results. Markets can chop, gap, or trend in ways that produce false signals, and no combination of settings eliminates that risk. This is provided for educational purposes only and is not financial advice — always test on a demo account or with a replay tool, and manage your own risk before trading live. Indikator

Impulse Candle Acceptance GuardA large candle is easy to spot. The harder question is whether the market accepts it.
Impulse Candle Acceptance Guard follows unusually forceful candles through a defined sequence: detection, continued holding, efficient extension, rejection, full reversal, or an unresolved timeout. It freezes the original candle’s range and ATR reference so later price action is judged against the event that started the observation.
VISUAL GUIDE
• I+ / I− — A bullish or bearish impulse candle entered observation.
• Teal or red zone — The frozen high-low range of the impulse candle.
• Orange line — The acceptance and rejection boundary inside the frozen range.
• Blue line — The minimum extension required beyond the impulse candle.
• A+ / A− — The move satisfied the hold, extension, and path-efficiency rules.
• R — A confirmed close crossed the acceptance line against the impulse.
• X — A confirmed close crossed the opposite edge of the entire impulse candle.
• T — The observation window ended without another terminal result.
The script is intentionally chart-first: it uses no table and has no dependency on another indicator.
1 — DETECT THE IMPULSE
The default setup requires the candle’s range to reach at least 1.5 times the ATR measured on the previous completed bar. Its real body must occupy at least 60% of the candle’s range, and the close must finish within the outer 20% in the direction of the move. Zero-range candles cannot qualify.
An optional volume filter requires current volume to exceed a configurable multiple of its moving average. It is disabled by default so the script also remains usable on symbols without meaningful volume data.
2 — FREEZE THE EVENT
At the confirmed close of a qualifying candle, the script freezes the impulse high, low and close; ATR from the bar immediately before the impulse; the acceptance line inside the impulse range; and the required extension beyond the impulse extreme. These levels remain fixed throughout the observation. Only one episode can be active at a time.
3 — MEASURE ACCEPTANCE
Acceptance requires all three default conditions:
1. Two consecutive closes remain beyond the orange acceptance line in the impulse direction.
2. Price reaches at least 0.25 frozen ATR beyond the impulse high or low.
3. Follow-through efficiency is at least 45%.
Follow-through efficiency compares directional progress from the impulse close with the cumulative close-to-close path traveled after it:
efficiency = max(0, directional progress) ÷ cumulative path × 100
A direct continuation produces a high value. Repeated back-and-forth movement increases the path without producing equal progress and lowers the value. The efficiency value is available in TradingView’s Data Window while an episode is active.
WORKED EXAMPLE
Assume a bullish impulse has a low of 100, a high of 110, a close of 109, and a frozen ATR of 4.
• Acceptance line: 100 + 50% × (110 − 100) = 105
• Required extension: 110 + 0.25 × 4 = 111
If the next two candles close above 105, price reaches 111, and directional progress represents at least 45% of the traveled path, A+ is printed. A close below 105 produces R. A close below 100 produces X and takes priority over the ordinary rejection label.
EVENT PRIORITY AND CONFIRMED-BAR BEHAVIOR
Full reversal has first priority, followed by acceptance-line rejection, acceptance, and timeout. An otherwise valid acceptance on the final permitted bar is recorded before timeout. Wicks alone do not reject or fully reverse an episode; those outcomes require confirmed closes.
Markers and state transitions update only after a candle closes. The script uses no future bars, pivot backdating, or lookahead requests.
USAGE AND LIMITATIONS
The mirrored rules operate on bullish and bearish candles across stocks, cryptocurrencies, futures, and forex. Use standard candles when interpreting the price-based rules. Thresholds describe a rule set rather than probabilities, and their meaning changes with symbol and timeframe.
Acceptance means that the specified conditions were observed; it does not guarantee continued movement or establish a profitable strategy. The indicator does not place trades, calculate position sizes, or model fees, slippage, gaps, liquidity, or execution. Historical results can change when settings, available history, or source data change.
BotTradeLab — Human judgment, AI-assisted analysis. Indikator

Indikator

Trend Target Ribbon [BOSWaves]Trend Target Ribbon - ALMA Conviction Trend Detection with Integrated Structure-Based Position Planning and R-Multiple Target Tracking
Overview
Trend Target Ribbon is an ALMA-based trend identification system that combines slope-normalized momentum confirmation with standard deviation band validation to determine trend state, and automatically generates a complete position planning framework on each trend flip including a structure-derived stop loss, up to four R-multiple take profit targets with proximity highlighting, and a risk zone visualization that tracks target hits and stop events throughout the position's active lifecycle.
Instead of simply marking trend direction, each trend flip immediately produces a fully structured trade plan anchored to the current bar's close as entry and the recent swing structure as stop loss. Risk is calculated dynamically from the swing extreme within the configured lookback, clamped between ATR-based minimum and maximum bounds, and used to project equally-spaced R-multiple targets that extend forward for the configured projection length. As price develops, targets glow brighter as price approaches them, mark with a checkmark when reached, and the entire position freezes with a historical record when the next trend flip occurs.
This creates a trend system that bridges signal generation and trade planning within a single indicator. The ALMA gradient ribbon communicates conviction intensity through its width and opacity, adapting continuously to the strength of the slope and the distance of price from the baseline. The candle gradient reinforces conviction on every bar. And the position framework provides an immediate, fully calculated trade structure from entry through all targets without requiring manual level calculation on each new trend signal.
Price is therefore evaluated not just for its directional trend state but for its position within a dynamically constructed risk-reward framework that updates automatically with each new trend confirmation.
Conceptual Framework
Trend Target Ribbon is founded on the principle that a trend system should do more than identify direction — it should translate each directional signal into a complete, immediately actionable trade framework where entry, risk, and target levels are derived from measurable market characteristics rather than arbitrary fixed distances.
Traditional trend indicators produce a signal that the trader must then manually convert into a trade plan by selecting entry price, calculating stop placement, and choosing target distances. This framework eliminates that gap by automating the complete transition from signal to trade plan on each flip, using swing structure for stop placement and the resulting risk distance as the universal unit for all target projections. Every parameter of the trade plan is therefore grounded in the instrument's actual price behavior rather than fixed indicator values.
Three core principles guide the design:
Trend confirmation should require simultaneous slope significance and price displacement beyond a standard deviation band, ensuring signals reflect genuine directional momentum rather than minor price oscillations around the ALMA baseline.
The gradient ribbon width and opacity should scale continuously with trend conviction derived from slope magnitude and distance from the ALMA, communicating the strength of the current trend visually rather than switching between binary active and inactive states.
Each trend flip should immediately generate a complete position framework with structure-derived stop loss, R-multiple targets, and active tracking of target proximity and hit status, translating the directional signal into a fully structured trade plan without manual intervention.
This shifts trend analysis from directional signal generation into an integrated signal-to-plan system where every trend confirmation produces both visual conviction context and a calculable trade framework simultaneously.
Theoretical Foundation
The indicator combines Arnaud Legoux Moving Average calculation for trend baseline, standard deviation band construction for displacement confirmation, ATR-normalized slope scoring for momentum significance, conviction scoring from slope and distance for gradient scaling, swing structure lookback for stop loss derivation with ATR clamping, and a multi-array position management system that tracks active and historical positions with target proximity gradients and hit state tracking.
The ALMA provides a low-lag weighted baseline with configurable offset and sigma parameters that control the balance between responsiveness and smoothness. Slope is measured as the ALMA change over the configured bar count normalized by ATR, producing a dimensionless score that reflects momentum strength independently of the instrument's price scale. The trend flip requires slope to exceed the minimum threshold in the signal direction while price simultaneously closes beyond the ALMA plus deviation band, ensuring both momentum and displacement conditions are satisfied. The conviction score combines double-weighted slope with distance-weighted separation, mapping to the gradient transparency of all ribbon fill layers simultaneously.
Four internal systems operate in tandem:
ALMA Trend Engine : Calculates the ALMA with configurable length, offset, and sigma, measures the normalized slope over the configured lookback, derives deviation bands for displacement confirmation, and flips trend state when both slope and displacement conditions are simultaneously satisfied.
Gradient Ribbon System : Constructs a four-layer ribbon between the ALMA and a deviation-scaled edge line, computing conviction from slope magnitude and price distance, and mapping that conviction to the transparency of each ribbon layer so width and brightness reflect trend momentum quality continuously.
Position Planning Engine : On each trend flip, derives stop price from swing structure within the lookback clamped by ATR multipliers, calculates risk distance, projects up to four equidistant R-multiple targets, and creates the complete set of glow-and-core dual-layer lines, risk box, target zones, inter-target bands, and R-multiple labels as a unified position framework.
Active Position Tracking System : Monitors each bar for target proximity to apply approach highlighting gradients, records target hit status when price reaches each level, detects stop events from bar extremes, freezes the position visually with historical styling on the next flip, and enforces the maximum visible position count by removing the oldest complete position objects.
This design ensures the trend ribbon communicates conviction quality continuously while the position planning and tracking layers translate each trend event into a fully managed trade framework with real-time progress monitoring.
How It Works
Trend Target Ribbon evaluates price through a sequence of confirmation and planning processes:
ALMA Calculation : The Arnaud Legoux Moving Average is calculated from the selected source over the configured length with the configured offset and sigma parameters, providing a smoothed low-lag baseline.
Slope Measurement : The ALMA change over the configured slope lookback bars is divided by ATR, producing a normalized slope score that measures directional momentum independently of price scale.
Deviation Band Construction : Standard deviation over the deviation length multiplied by the confirmation multiplier produces the upper and lower confirmation bands around the ALMA.
Trend Flip Detection : A bullish flip requires slope above the minimum threshold and close above the upper confirmation band simultaneously. A bearish flip requires slope below the negative threshold and close below the lower confirmation band. Flips are only registered when the new state differs from the current state.
Conviction Scoring : The conviction score combines doubled slope magnitude with distance-weighted separation between price and ALMA, normalized to a 0-1 range that drives ribbon transparency and candle gradient intensity.
Ribbon Rendering : Four ribbon layers render between the ALMA and the deviation-scaled edge, with glow, edge, mid, and ALMA plots filled at conviction-scaled transparencies and broken across flip bars to prevent visual carryover between trend states.
Position Freeze on Flip : When a flip occurs with an active position, all position objects are frozen at the flip bar with faded historical styling, preserving the completed position record on the chart.
Stop Loss Derivation : The swing low over the stop lookback for long positions and swing high for short positions provides the structural stop reference, with the raw risk distance clamped between ATR minimum and ATR maximum bounds.
Target Projection : Up to four targets are placed at equidistant R-multiples above entry for long positions and below for short positions, with inter-target band boxes filling the reward zones between consecutive levels.
Active Tracking : Each bar, target proximity gradients are computed from price distance relative to the approach radius, driving glow and zone transparency. Target hit status is set when price reaches each level and persists with checkmark label addition. Stop hits terminate the position with darkened stop styling.
Position Count Management : When the visible position limit is exceeded on a new flip, the oldest complete position's lines, boxes, and labels are removed from all storage arrays and deleted before the new position objects are created.
Together, these elements form a continuously updating trend conviction visualization with an integrated automated trade planning and tracking system that maintains a rolling history of the most recent positions.
Interpretation
Trend Target Ribbon should be interpreted as a conviction-weighted trend system with an attached automated position management overlay:
Bullish Trend State (Green) : Active when slope exceeds the minimum threshold upward and close is above the upper deviation band, with the gradient ribbon rendering below the ALMA and candles coloring green with intensity proportional to conviction.
Bearish Trend State (Red/Pink) : Active when slope exceeds the minimum threshold downward and close is below the lower deviation band, with the gradient ribbon rendering above the ALMA and candles coloring in the bearish color with conviction-scaled intensity.
Gradient Ribbon : The filled zone between the ALMA and the deviation-scaled edge communicates conviction through its visual depth. Strong slope and distant price produce a wide, opaque ribbon. Weakening slope or price compressing toward the ALMA produces a narrower, more transparent ribbon.
Candle Gradient : Price candles color from a muted version of the trend color at low conviction to full saturation at high conviction, providing a bar-level momentum intensity reading directly on the chart.
Entry Line : White core line with trend-colored glow at the flip bar close marks the position entry level, extending forward for the configured projection length.
Stop Loss Line : Red glow and core lines below entry for longs and above for shorts mark the structure-derived stop level. The risk box fills the zone between entry and stop.
Target Lines (T1 to T4) : Green glow and core lines at successive R-multiples from entry mark the sequential take profit levels. Labels display the target number and R multiple.
Target Approach Highlighting : As price approaches each target within the configured approach radius, the glow and zone transparency increases progressively, creating a visual brightening effect that draws attention as price nears each level.
Target Hit Markers : When price reaches a target level, the line brightens fully, the zone shading intensifies, and the label gains a checkmark suffix, providing a persistent record of which targets were reached during the position.
Stop Hit Styling : When price reaches the stop level, the position freezes with stop-specific styling and the stop label receives a checkmark, indicating the position was closed at the stop.
Historical Positions : Frozen completed positions remain on the chart with faded styling for the configured number of past positions, providing a visual history of recent trend-triggered trade setups and their outcomes.
Ribbon conviction width, candle gradient, and target hit progression collectively communicate more trend and trade plan context than any element in isolation.
Signal Logic & Visual Cues
Trend Target Ribbon presents two primary trend transition signals that simultaneously trigger complete position framework generation:
Bullish Trend Signal (◆) : Green diamond below the bar when both slope and displacement conditions flip bullish, triggering a long position framework with structure-derived stop below entry and up to four equidistant R-multiple targets above.
Bearish Trend Signal (◆) : Red diamond above the bar when both slope and displacement conditions flip bearish, triggering a short position framework with structure-derived stop above entry and up to four equidistant R-multiple targets below.
Target proximity highlighting and hit tracking provide continuous secondary context throughout the active position lifecycle, with approach brightening identifying when price is near each target and checkmarks confirming reached levels.
Alert generation covers bullish and bearish trend flip events for systematic monitoring workflows.
Strategy Integration
Trend Target Ribbon fits within ALMA momentum-confirmed trend-following and integrated position management approaches:
Conviction-Filtered Entries : Use the ribbon width and candle gradient at the flip bar as a conviction filter. Flips accompanied by a wide, opaque ribbon and bright candles indicate strong slope and displacement conditions. Flips producing a thin, subtle ribbon suggest borderline confirmation warranting greater caution.
R-Multiple Target Sequencing : Use the automatically generated target sequence as a staged exit framework, planning partial position reductions at each successive target rather than holding for a single fixed level, allowing systematic profit capture while maintaining exposure to larger directional moves.
Structure Stop Awareness : Monitor the stop distance relative to ATR on each new position. Positions where the structural stop requires maximum ATR clamping carry greater uncertainty about the structural validity of the stop level than positions where the structural stop falls naturally within the ATR bounds.
Target Proximity Trading : Use the approach highlighting as a real-time proximity alert for active management decisions, using the brightening glow as a visual cue to prepare for partial exit or tightened stop management as price approaches each target level.
Historical Position Review : Use the retained historical positions as a visual record of the indicator's recent signal behavior on the current instrument and timeframe, assessing whether the configured parameters are producing appropriately sized stops and reachable targets in recent market conditions.
Multi-Timeframe Conviction Alignment : Apply higher-timeframe trend state as a directional bias filter, engaging with lower-timeframe flip signals only when they align with the established higher-timeframe ALMA direction and ribbon state.
Technical Implementation Details
Trend Engine : ALMA with configurable length, offset, and sigma; ATR-normalized slope over configurable lookback; standard deviation band displacement confirmation
Conviction System : Composite score from doubled slope magnitude and distance-weighted price separation mapped to multi-layer ribbon transparency and candle gradient
Position Engine : Swing structure stop derivation with ATR minimum and maximum clamping; equidistant R-multiple target projection; dual-layer glow-and-core line and zone construction
Tracking System : Per-bar target proximity gradient computation; hit state persistence with checkmark labels; stop detection from bar extremes; flip-triggered position freeze with historical styling
History Management : Three independent arrays for lines, boxes, and labels with configurable maximum position count enforced by oldest-first bulk removal
Visualization : Four-layer gradient ribbon with fill and plot combination; conviction-scaled candle gradient; signal diamonds at flip bars
Performance Profile : Real-time execution with object extension and state updates on every bar for the active position, position creation and freeze on flip bars, and bulk cleanup on position count overflow
Optimal Application Parameters
Timeframe Guidance:
1 - 5 min : Intraday trend position planning for scalping with shorter ALMA length and tighter slope minimum for faster trend confirmation and responsive stop placement
15 - 60 min : Session-level trend-following with balanced ALMA length and moderate deviation confirmation for meaningful trend state separation across typical session moves
4H - Daily : Swing-level trend position management with longer ALMA length and higher slope minimum for sustained trend confirmation before position frameworks are generated
Suggested Baseline Configuration:
ALMA Length : 34
Trend Confirmation : 0.65
Minimum Slope : 0.08
Stop Structure Lookback : 12
Minimum Stop ATR : 0.75
Maximum Stop ATR : 3.0
Profit Targets : 4
Positions On Chart : 4
Show Trend Gradient : Enabled
Color Candles : Enabled (requires disabling original chart candles in chart settings)
Show Position Labels : Enabled
These suggested parameters should be used as a baseline; their effectiveness depends on the instrument's volatility characteristics, swing structure frequency, and preferred signal sensitivity, so fine-tuning is expected for optimal performance.
Parameter Calibration Notes
Use the following adjustments to refine behavior without altering the core logic:
Too many trend flips : Increase Minimum Slope to demand stronger directional momentum before a flip registers, or increase Trend Confirmation to require greater price displacement beyond the ALMA before the signal fires.
Trend flips too infrequent : Decrease Minimum Slope toward 0.02 for more inclusive momentum qualification, or decrease Trend Confirmation toward 0.2 to allow trend flips on smaller deviations from the ALMA.
Stop loss too tight : Increase Minimum Stop ATR to enforce a larger minimum risk distance regardless of structural stop location, providing more breathing room around the entry price.
Stop loss too wide : Decrease Maximum Stop ATR to cap the risk distance at a tighter ATR multiple, preventing the structural stop from placing the position at an impractical risk size.
Targets too close together : The target spacing is determined by the risk distance. A wider stop produces more widely spaced targets. Reduce Minimum Stop ATR to produce tighter stops and therefore closer-spaced targets on instruments with small typical ranges.
Ribbon too wide or narrow : The ribbon width is driven by conviction from slope and distance. On instruments with consistently strong slope the ribbon may appear uniformly wide. Increase Minimum Slope to restrict confirmation to only the strongest momentum conditions, producing more variable ribbon widths.
ALMA too laggy or reactive : Increase ALMA Sigma toward 15 for a smoother less reactive baseline, or decrease toward 1 for a more reactive baseline. Adjust ALMA Offset toward 1.0 for greater recent-price weighting or toward 0.0 for more uniform weighting across the length.
Adjustments should be incremental and evaluated across multiple session types rather than isolated market conditions.
Performance Characteristics
High Effectiveness:
Trending markets where ALMA slope sustains above the minimum threshold for extended periods, producing well-spaced flip signals with wide conviction ribbons and providing sufficient price extension to reach multiple R-multiple targets
Instruments with consistent swing structure where the lookback-derived stop lands at structurally meaningful levels within the ATR bounds rather than being clamped to the minimum or maximum
Systematic position management approaches that benefit from automatically generated, consistently structured trade plans rather than manual level calculation on each signal
Historical analysis workflows where the retained position history provides a visual record of the indicator's recent signal behavior and target achievement rate on the current instrument
Reduced Effectiveness:
Choppy, range-bound markets where slope and displacement conditions flip frequently in alternating directions, generating position frameworks that are immediately frozen by the next flip before targets can be approached
Instruments with highly irregular swing structure where the stop lookback consistently finds extremes that place the stop at the ATR maximum, indicating structural stop placement is not meaningful on the instrument
Very low volatility environments where the ATR minimum stop dominates, producing artificially tight stops that bear no relationship to actual structural support or resistance levels
News-driven or gap-heavy instruments where instantaneous price movements trigger trend flips before the ALMA has developed sufficient slope, producing borderline-conviction signals with thin ribbons
Mean-reversion dominant conditions where sustained ALMA slope is rare and the slope requirement suppresses signal frequency to a level that makes the position history sparse and statistically insufficient for pattern assessment
Integration Guidelines
Confluence : Combine with BOSWaves structural tools, order flow analysis, or volume indicators to validate trend flip signals and assess whether the position framework aligns with broader market context before managing positions to the automated targets
Conviction Assessment : Evaluate ribbon width and candle gradient at each flip bar before committing to the generated position framework. Thin ribbons on borderline signals warrant reduced position sizing relative to the standard risk distance.
Stop Clamping Awareness : Note whether the stop loss is at the structural level or at an ATR boundary. ATR-clamped stops indicate the structural extreme was outside the acceptable range and the stop may be placed at a less meaningful price, warranting additional monitoring.
Target Achievement Review : Periodically review the historical position records retained on the chart to assess whether the configured target count and projection length are realistic for the instrument and timeframe, adjusting target count or extending projection bars if targets consistently remain unreached within the position lifecycle.
State Discipline : Maintain directional bias aligned with the current trend state until the next confirmed flip. Ribbon narrowing and candle gradient dimming within an established trend suggest conviction is weakening but do not constitute a flip signal until both slope and displacement conditions simultaneously satisfy the opposing direction requirements.
Disclaimer
Trend Target Ribbon is a professional-grade ALMA trend conviction visualization and integrated position planning tool. It uses slope-normalized momentum confirmation with structure-derived risk management but does not predict future price movements. Results depend on market conditions, instrument trend characteristics, parameter selection, and disciplined execution. BOSWaves recommends deploying this indicator within a broader analytical framework that incorporates order flow context, structural analysis, and comprehensive risk management. Indikator

HTF 3-Candle System (Zeiierman)█ Overview
HTF 3-Candle System (Zeiierman) is a higher-timeframe market structure indicator designed to analyze the relationship between three consecutive HTF candles and identify the price pattern that currently best describes the developing structure.
Instead of looking for a single fixed candlestick formation, the indicator evaluates multiple bullish and bearish three-candle structures simultaneously. Each pattern receives a dynamic quality score based on factors such as candle direction, range, body strength, liquidity sweeps, displacement, imbalance, compression, expansion, and the developing behavior of the live third candle.
The three higher-timeframe candles are defined as:
• C1 = the completed HTF candle two periods back
• C2 = the previous completed HTF candle
• C3 = the current live HTF candle
C3 updates continuously while the higher-timeframe candle is forming, allowing the pattern ranking and projected levels to evolve with current price action.
The System evaluates 12 three-candle structures:
• Bullish Sweep Reversal
• Bearish Sweep Reversal
• Bullish FVG Displacement
• Bearish FVG Displacement
• Bullish PO3 Sequence
• Bearish PO3 Sequence
• Bullish Expansion
• Bearish Expansion
• Bullish Compression Break
• Bearish Compression Break
• Morning Star Reversal
• Evening Star Reversal
The three highest-ranked structures are displayed in the 3-CANDLE SYSTEM table together with their current scores. The highest-ranked pattern also controls the live state message and the projected structural levels.
█ How It Works
⚪ 3-Candle HTF Structure
The indicator analyzes three candles from the selected higher timeframe:
• C1 = two HTF candles back
• C2 = previous HTF candle
• C3 = current live HTF candle
C1 = HTF
C2 = HTF
C3 = current HTF
C1 and C2 are completed candles, while C3 updates live until the current higher-timeframe candle closes.
⚪ Pattern Quality Scoring
The System evaluates 12 bullish and bearish three-candle structures and assigns each one a quality score.
The score combines structural conditions with softer proximity measurements, so a setup can begin ranking before every condition is fully completed.
Factors include liquidity sweeps, candle direction, body strength, range, displacement, FVGs, compression, expansion, and recovery or rejection around key levels.
score = structure + proximity + candle strength
⚪ Top 3 Pattern Ranking
All pattern scores are ranked from highest to lowest.
The strongest structure becomes the active pattern, while the second and third highest scores remain visible for additional context.
patterns.sort(order.descending, sort_field="qualityScore")
⚪ Live Pattern State
The top-ranked structure also shows its current stage, such as:
• sweep or reclaim developing
• FVG live
• breakout or breakdown developing
• compression
• PO3 distribution
• reversal developing
⚪ Projected Pattern Levels
The active pattern projects the levels most relevant to that structure, including sweep levels, breakout levels, FVG boundaries, CE 50%, equilibrium, recovery levels, and invalidation.
Nearby levels can automatically merge to reduce visual clutter.
⚪ Projected HTF Candles
C1, C2 and C3 are reconstructed to the right of price using their actual higher-timeframe OHLC values. C3 updates live as the current HTF candle develops.
⚪ HTF Mapping
The System can map C1, C2 and C3 directly over the lower-timeframe candles that formed them.
High and low dots identify the exact lower-timeframe candles that created each HTF extreme. Completed C1 and C2 levels can also change from Active to Mitigated after being traded through.
█ How to Use
The examples below show how the System behaves across different three-candle structures. The table identifies the highest-ranked pattern, while the bottom row shows the pattern's current live state.
⚪ Bearish Expansion
Here, Bearish Expansion is the highest-ranked pattern at 85.0%, and the state reads BEARISH EXPANSION LIVE.
C1, C2, and C3 progressively shift lower, with C3 extending strongly through the previous structure. The projected levels identify the Breakdown, the level price should Hold Below, and the Invalidation level above.
⚪ Bearish FVG Displacement
In this example, Bearish FVG Displacement reaches a 100.0% score and the state reads BEARISH FVG LIVE.
The strong downside movement leaves C3 separated below C1, creating the bearish imbalance. The System projects the FVG Upper, CE 50%, C3 High, and Invalidation levels around the active structure.
⚪ Bearish FVG With Merged Levels
This is another Bearish FVG Displacement, ranked at 98.1%.
Here, the FVG Upper and CE 50% are close enough to be merged into a single projected level. This demonstrates how the System combines nearby structural references when they overlap.
⚪ Bullish FVG Displacement
This example shows a Bullish FVG Displacement with a 100.0% score and BULLISH FVG LIVE state.
Strong upside displacement leaves the C3 low above the earlier C1 structure. The projected FVG Lower, CE 50%, C3 Low, and Invalidation levels define the active bullish imbalance.
⚪ Bearish Compression Setup
Here, Bearish Compression Break ranks first at 91.2%, but the state still reads COMPRESSION - WATCH RANGE LOW.
This is important because the bearish break has not yet confirmed. C2 is contained within the C1 range and C3 is pressing toward the lower boundary. The Range Low / Breakdown level shows where bearish confirmation would occur, while Equilibrium and Range High define the rest of the compression structure.
⚪ Bullish Power of 3
In this example, Bullish PO3 Sequence ranks first at 85.0%, with the state PO3 DISTRIBUTION LIVE.
The sequence shows a downside manipulation followed by a strong bullish C3 expansion. The System highlights the Manipulation Low, the Distribution level above, and the structural Invalidation level.
⚪ Bearish Sweep Reversal
Here, Bearish Sweep Reversal is ranked first, but the state reads HIGH SWEPT - NEED RECLAIM.
Price has already swept above the C1 high, but the reversal is not yet fully confirmed. The next requirement is for C3 to move back below the projected C3 Close < level. The swept high and invalidation have merged into one structural level.
⚪ Bullish Sweep Reversal
This example shows Bullish Sweep Reversal ranked first at 82.0%, but the state is still WATCHING C1 LOW.
This is an earlier-stage setup. The System is identifying the bullish sweep structure as the best current match, but the C1 low has not yet been swept. The projected Sweep Low + Invalidation level shows the liquidity area being watched, while C3 Close > marks the bullish confirmation level.
⚪ Evening Star Reversal
Here, Evening Star Reversal ranks first at 80.6%, with the state AWAITING REJECTION BELOW C1 MID.
The reversal structure is developing, but C3 has not yet moved far enough below the C1 midpoint to confirm stronger rejection. The projected levels show 50% Rejection, Full Rejection, and Invalidation.
⚪ Bullish Compression Setup
In the final example, Bullish Compression Break ranks first at 84.3%, while the live state reads COMPRESSION - WATCH RANGE HIGH.
C2 remains compressed inside the C1 structure and C3 is moving toward the upper boundary. The bullish breakout is not confirmed until price pushes through the projected Range High / Breakout level. Equilibrium and Range Low provide the remaining structural references.
█ Settings
Higher Timeframe: Selects the higher timeframe used to construct C1, C2 and live C3. The selected timeframe must be higher than the chart timeframe.
Strong Match Threshold: Sets the minimum quality score required for the highest-ranked pattern to be treated as a strong match.
Show Projected HTF Candles: Shows or hides the reconstructed C1, C2 and C3 candles to the right of current price.
Offset: Controls how far the projected candle structure appears from current price.
Candle Spacing: Controls the horizontal spacing between projected C1, C2 and C3.
Merge: Controls how close two projected levels can be before they are combined.
Spacing: Controls horizontal spacing between pattern level labels.
-----------------
Disclaimer
The content provided in my scripts, indicators, ideas, algorithms, and systems is for educational and informational purposes only. It does not constitute financial advice, investment recommendations, or a solicitation to buy or sell any financial instruments. I will not accept liability for any loss or damage, including without limitation any loss of profit, which may arise directly or indirectly from the use of or reliance on such information.
All investments involve risk, and the past performance of a security, industry, sector, market, financial product, trading strategy, backtest, or individual's trading does not guarantee future results or returns. Investors are fully responsible for any investment decisions they make. Such decisions should be based solely on an evaluation of their financial circumstances, investment objectives, risk tolerance, and liquidity needs.
Indikator

Sessions, Opening Levels and Day Separators=====================================================================
⚠️⚠️ PLEASE READ BEFORE USING ⚠️⚠️
⚠️ This is an EDUCATIONAL AND ANALYTICAL tool. It is not financial
advice, it is not a trading system, and it is not a signal service.
It produces no buy or sell signals of any kind.
⚠️ Every number and level this script draws is a HISTORICAL
MEASUREMENT of where price has already been. None of it is a
probability, a forecast, a prediction, or an expectation. A line at
yesterday's high tells you where yesterday's high was. It tells you
nothing whatsoever about whether price will reach it, respect it, or
reverse at it.
⚠️ Past market behaviour does not guarantee, imply or suggest future
market behaviour. Levels that held ten times can fail on the eleventh.
⚠️ You are solely responsible for every trading decision you make and
for every loss you incur. Trading leveraged instruments carries a real
risk of losing more than your deposit. If you are unsure, seek advice
from a licensed professional. Nothing here is a recommendation to buy
or sell anything.
---------------------------------------------------------------------
WHAT THIS IS
Most intraday traders end up running four or five separate indicators
just to answer four simple questions: where does today start, which
session are we in, where was yesterday's high and low, and where did
this week open? Each of those scripts adds its own indicator slot, its
own settings panel, and its own idea of when a "day" begins.
This is those four tools in one script. It draws vertical lines where
each trading day and week begins, shades the four major trading
sessions, marks the high and low of previous days, weeks and months,
and draws horizontal lines at reference opening prices. It does not
interpret any of that for you. It draws context and stops.
It is open source. Every calculation below is in the code, and you are
encouraged to read it.
---------------------------------------------------------------------
WHAT IT DRAWS
1. DAY AND WEEK VERTICAL LINES
A thin vertical line where each trading day begins and a thicker one
where each trading week begins. Where a week line is drawn, the day
line for that same moment is left out, so the two never sit on top of
each other. The weekday name is written at the TOP of the pane,
positioned midway between two consecutive day lines rather than beside
one, so it labels the day rather than the boundary. There is an
alternative "Background" mode that tints the whole bar instead of
drawing a line.
2. SESSIONS
Four shaded boxes: Asia, London, New York AM and New York PM. Each box
opens when its session opens and then grows, bar by bar, to contain
every high and low the session has made so far. The box you see is the
literal price range of that session up to that point. A large letter
is written faintly inside each box so you can tell them apart at a
glance. Default times, in New York time, are Asia 20:00-02:00, London
02:00-08:30, NY AM 08:30-11:30, NY PM 13:30-16:00. All four are fully
editable.
3. PREVIOUS HIGHS AND LOWS
Two horizontal lines per period, at the highest and lowest price
reached during a previous COMPLETED day, week or month. The line is
anchored at the start of the period it measures and extends to the
right. You can show more than one previous period, and older ones can
be faded so the most recent stands out.
4. OPENING LEVELS
Horizontal lines at reference opening prices, each with a short text
label written at the right-hand end: the 00:00 open, the 10:00 open,
today's open, this week's open, this month's open, this year's open,
and the all-time high. When two or more of these land on exactly the
same price, their labels merge into one line of text instead of
printing on top of each other.
5. WARNING BANNER
A small amber note in the bottom-right corner when something is
switched on but not being drawn. It exists because this script has
twelve independent timeframe filters, and "why is my chart empty?" is
by far the most likely thing to go wrong. Each note names the cause and
what to change. It can be switched off under General once you no longer
need it. Nothing is drawn at all when there is nothing to report.
---------------------------------------------------------------------
HOW IT IS CALCULATED
Nothing here is hidden. This is the actual method.
DAY BOUNDARY — five modes
A "trading day" is not midnight for most instruments. CME futures roll
over at 17:00 Chicago. Stocks start at the opening bell. Crypto starts
at midnight UTC. Rather than guess this from the asset type, which
gets stocks, Euronext, CBOT grains, ICE, VIX and CFD indices wrong,
the script reads it from TradingView's own session data for the
symbol.
Auto (exchange session)
timeframe.change("D") — fires exactly where TradingView starts a
new daily bar for this symbol.
Market open only
session.ismarket and (not session.ismarket or timeframe.change("D"))
then kept only on the FIRST such bar of each calendar day.
That is the transition out of the pre-market where the chart
carries one, and the trading day's own boundary where it does not.
The once-per-day rule matters: on an extended-hours chart the two
halves of that test do not always land on the same bar, and it also
stops a lunch-break reopen counting as a second trading day.
See limitation 2 below — on most symbols this mode legitimately
produces the same lines as Auto.
Midnight (exchange time) / Midnight (New York) / Custom time
For each bar, build the target instant for THAT BAR'S OWN
calendar date:
timestamp(tz, year(time,tz), month(time,tz),
dayofmonth(time,tz), HH, MM)
and fire when all three of these are true:
time >= that instant
time < that instant
time - that instant < (chart timeframe in seconds x 1000)
timestamp() is timezone- and daylight-saving-aware, so the
boundary does not slide by an hour on the two DST changeover
days each year. The third condition — the boundary must fall
INSIDE the bar that just opened — is what stops the Sunday
evening double-line: CME reopens Sunday 18:00 New York, and the
weekend gap technically straddles Sunday midnight, so without it
you would get both an 18:00 line and a midnight line the same
night.
WEEK BOUNDARY — three modes
Exchange Week timeframe.change("W")
Specific Day a day boundary whose session weekday matches the
day you choose
Follow Day Start the script watches for timeframe.change("W"),
records WHICH weekday the exchange's week opens
on, then fires on the day boundary that lands on
that weekday
The session weekday is taken from the MIDPOINT of the daily bar:
mid = time("D") + (time_close("D") - time("D")) / 2
dow = dayofweek(mid, exchange timezone)
The midpoint always falls inside the session, so a CME Wednesday
session that opens on Tuesday evening correctly counts as Wednesday.
All three modes are then de-duplicated against time("W"), so you get
at most one week line per exchange week even when a day boundary and a
daily-bar boundary disagree.
DAY NAME POSITION
The name goes midway between the separator that opens its day and the
one that closes it. The closing separator has not happened yet when the
name must be plotted, so the midpoint is predicted, and the prediction
differs by mode.
Auto mode — the separators ARE the daily-bar edges, so the daily bar
hands over both ends:
sessionMid = time("D") + (time_close("D") - time("D")) / 2
name drawn on the first bar of the day where
time + chart timeframe > sessionMid
Both values come from the session schedule, carry no lookahead, and read
the same on every bar inside the day. Written as one comparison rather
than a pair so that a midpoint landing in a gap — a lunch break, or the
hours a holiday session sits closed — is claimed by the first bar after
the gap instead of by no bar at all; a latch, reset at each day boundary,
keeps the rest of the day from claiming it too.
Every other mode — the boundary is a clock time or the opening bell, not
a daily-bar edge, so there is no end to read and the day is measured:
barsPerDay = bar_index(this separator) - bar_index(previous one)
name drawn where bar_index - lastSeparator == floor(barsPerDay / 2)
floor() rather than a plain division: an odd bar count would land on x.5
and match no bar at all, silently dropping that day's name. This estimate
still mis-centres the day after an unusually long or short one, but those
modes are immune to the merged-session case that motivated the Auto-mode
anchor, because a clock boundary falls inside a merged session and splits
it into two named days anyway.
On an ordinary day the two anchors pick the SAME bar — a 23-hour CME
session at 1 hour puts both on bar 11, a 6.5-hour equity session at 15
minutes puts both on bar 13 — so the change is visible only on the
irregular days it exists for.
SESSIONS
inSession = not na(time(chart timeframe, "HHMM-HHMM", timezone))
isNew = inSession and not inSession
On isNew, create a box with top = high, bottom = low. On every later
bar in the session:
top = max(top, high)
bottom = min(bottom, low)
right = current bar
PREVIOUS HIGHS AND LOWS
= request.security(symbol, "D" / "W" / "M",
,
lookahead = barmerge.lookahead_on)
periodChanged = t != t
When a period changes, the line pair belonging to the period that just
ENDED is given its length and its final price, taken from h and
l — the settled values of the period that has now closed. The new
period's own line pair is created zero-length, which makes it
invisible, and stays that way until that period in turn closes.
ON LOOKAHEAD, STATED PLAINLY: this script does use
barmerge.lookahead_on with a plain high and low. On historical bars
that returns the containing period's FINISHED value, which is
information from that period's own future. Nothing is ever drawn
from it. Every visible line takes its price from the offset
above, which is settled history by the time it is read, and no line
becomes visible before its period has closed. The Data Window values
use the same settled offsets. If you would rather verify this than
take my word for it, the code is open — look for the block commented
"LOOKAHEAD, stated plainly".
The consequence you WILL see: because a period's line is anchored at
the START of the period it measures, on historical bars the line
runs back across the period it summarises. That is intentional and
is how period range lines are conventionally drawn. It is not a
prediction, and the line did not exist on your chart while that
period was still forming.
FADE
color.from_gradient(i, 0, n-1, fully transparent, fully opaque)
where i is the line's position in the history, so the oldest is the
faintest.
OPENING LEVELS
00:00 level time("1", "0000-0001", timezone) becomes non-na
-> level = that bar's open
10:00 level time("1", "1000-1001", timezone) becomes non-na
-> level = that bar's open
Daily timeframe.change("D") -> open
Weekly timeframe.change("W") -> open
Monthly timeframe.change("M") -> open
Yearly timeframe.change("12M") -> open
ALL-TIME HIGH
Tracked incrementally as a running maximum of the chart's own highs,
never by scanning backwards through history. One additional request
(with lookahead OFF) runs the same running maximum on the daily
timeframe, purely to catch a peak that occurred before the chart's
loaded history begins. If that beats the chart-native high, the peak
is off screen to the left and the line simply starts as far left as
TradingView allows a drawing to anchor.
LABEL MERGE
Levels are held in a fixed array whose ORDER is the merge priority.
Every level compares its price against every lower-priority level; on
an exact match the higher-priority label absorbs the lower one's text
("00:00 + W.O") and the lower one renders an empty label. Its line is
still there, at the identical price.
---------------------------------------------------------------------
HOW IT COMPARES TO THE CLOSEST ALTERNATIVE
The closest well-known free alternative is ICT Killzones + Pivots,
which covers the same broad ground: session boxes, previous
day/week/month levels, opening prices and separators. TradingView also
ships a built-in "Session breaks" option in Chart Settings that draws
vertical session dividers for free, without using an indicator slot.
WHERE THIS SCRIPT GOES FURTHER
1. THE DAY BOUNDARY IS A REAL SETTING, NOT AN ASSUMPTION.
Five modes: the exchange's own session, the market open only,
midnight in exchange time, midnight in New York, or any clock time
in any of eleven timezones. Most session tools fix the separator to
the exchange session or to a single hardcoded hour.
2. THE WEEK LINE CAN FOLLOW THE DAY LINE.
If you set your day to start at midnight New York on a CME symbol,
most tools still put the week line at the Sunday 18:00 exchange
open, leaving it stranded between two of your day lines. "Follow
Day Start" learns which weekday opens the exchange's week and puts
the week line on the day boundary that lands on it.
3. TWELVE INDEPENDENT TIMEFRAME FILTERS, NOT ONE.
Each element has its own "Apply Below" cutoff. You can have week
lines on the 4-hour, previous-day levels down to the 12-hour,
session boxes only at 15 minutes and below, and the 00:00 level
only at 45 minutes and below — all in one saved profile, with no
switching. Comparable tools use a single global cutoff that hides
everything at once.
4. DAY NAMES ARE CENTRED ON THE DAY, NOT PINNED TO A CLOCK.
In Auto mode the position comes from the session's own midpoint, so
it is right on a half day, and right on a holiday that TradingView
folds into the neighbouring session and prints as one trading day —
the 47-hour block gets its name in the middle of 47 hours, and the
day after it is unaffected. The other modes measure the previous
day's width in bars, which is what spacing on screen actually is.
5. IT TELLS YOU WHY YOUR CHART IS EMPTY.
With twelve filters, an empty chart is the most likely failure. A
note appears bottom-right naming the cause.
6. IT HAS AN ALL-TIME HIGH LEVEL, tracked without a backward scan.
7. IT REPORTS NO STATISTICS, DELIBERATELY.
See the next section — this is a genuine trade-off, not only a
feature.
WHERE THE ALTERNATIVE IS BETTER, OR THIS ONE IS WEAKER
Read this section as carefully as the one above. If any of these
matter to you, use the other tool.
1. NO SESSION HIGH AND LOW LEVELS. ICT Killzones + Pivots stores each
session's high and low as horizontal lines and extends them
forward until price trades through them. That is the single most
used feature of that script and this one has no equivalent at all.
Here the box is the whole record, and it stops at the session end.
2. NO ALERTS. None. The alternative can alert you on session highs and
lows and on daily, weekly and monthly levels. If you need to be
notified rather than to watch, this script cannot do it.
3. ONLY TWO FIXED CLOCK LEVELS. You get 00:00 and 10:00 and you cannot
move them or add a third. The alternative lets you type in eight or
more opening times at any hour you like, with your own labels and
colours.
4. ONLY FOUR SESSIONS. Asia, London, NY AM, NY PM, and you cannot add
a fifth. The alternative has five or six configurable slots
including London Close and a regular-trading-hours slot.
5. NO STANDARD DEVIATION OR RANGE PROJECTION LEVELS. The alternative
can plot levels at multiples of a session's average, median or
standard deviation range. This script has nothing comparable.
6. NO STATISTICS TABLE AND NO HIT RATES. The alternative shows how
often each level was reached, with sample sizes. That is
information this script deliberately does not give you. I left it
out because a hit rate presented on a chart reads as a probability
and it is not one — but if you specifically want measured
historical frequencies, this script cannot provide them and the
alternative can.
7. NO SESSION MIDPOINTS.
8. CAPPED HISTORY. Previous-level counts are limited to 50 each, and
day and week separators are capped at 250 with the oldest dropped.
The alternative offers an unlimited history mode.
9. IF ALL YOU WANT IS SEPARATORS, YOU DO NOT NEED THIS SCRIPT.
TradingView's built-in "Session breaks" setting is free, uses no
indicator slot, and costs no computation. This script is only worth
a slot if you want two or more of its four modules.
---------------------------------------------------------------------
HOW TO USE IT
None of the following are recommendations, and none of them are
strategies. They are simply the ways context tools of this kind are
commonly read. Test anything you take from here yourself.
TREND AND CONTINUATION
The previous day's high and low, and the week's opening price, are the
levels most often referenced when describing whether a market is
extending or retracing. A market trading and holding above the prior
day's high is described differently from one that reached it and fell
back. Watch what happens AT the level, not the fact that price arrived
there. Suggested setup: previous day and week levels on, sessions off,
day and week lines on, on the 1-hour or 4-hour.
RANGE AND MEAN REVERSION
The session boxes give you a visible container. When the London box
and the NY AM box overlap heavily in price, the market has not gone
anywhere, and the box edges are the boundaries other participants can
see too. The 00:00 open and the daily open are frequently used as the
"middle" that a rangebound day oscillates around. Suggested setup:
all four sessions on, 00:00 and daily open on, previous-day levels on,
on the 15-minute.
SCALPING
Use the session boxes as a filter on WHEN rather than as a signal on
what. The boundary between one session box ending and the next
beginning is where participation changes hands, and thin periods
between boxes are visibly thin. Turn the day and week vertical lines
off — at 1 to 5 minutes they add clutter without adding information.
Suggested setup: sessions on, previous day on, everything else off,
on the 1-, 2- or 5-minute.
SWING
Switch to the weekly and monthly side. Previous week and previous
month highs and lows, plus the monthly and yearly opens and the
all-time high, give you the small set of levels that a multi-week
position is measured against. Set Previous Week and Previous Month
counts to 3 or 4 and turn on "Fade Older Lines" so the most recent
reads clearly. Suggested setup: previous week and month on, weekly,
monthly and yearly opens on, sessions off, on the 4-hour or daily.
MULTI-TIMEFRAME WORKFLOW
Because every element has its own "Apply Below" cutoff, you can set
this up once so that scrolling from a daily chart down to a 1-minute
chart progressively reveals more detail without you touching a
setting. That is what the twelve filters are for.
---------------------------------------------------------------------
KNOWN BEHAVIOURS AND LIMITATIONS
These are expected. They are listed so they do not look like bugs.
1. "MARKET OPEN ONLY" MATCHES "AUTO" ON MOST SYMBOLS. This mode exists to
skip the pre-market and post-market. All futures, all forex and all
crypto trade one continuous session and have neither, and a stock
chart has neither unless you switch Extended Hours on. Where there is
nothing to skip, the mode falls back to the trading day's own boundary
— which on a regular-hours stock chart is the opening bell anyway —
and a note bottom-right tells you that is what happened. To see the
mode do something different from Auto, put it on a US stock with
Extended Hours enabled: the line lands on the 09:30 open rather than
the 04:00 pre-market start.
2. THE 00:00 AND 10:00 LEVELS DO NOT APPEAR ON STOCKS. They need a
candle that OPENS at exactly that clock time, and that fails for
two separate reasons. First, the market may be shut then — every
stock is closed at midnight, so the 00:00 level can never be drawn
on one, whatever timeframe you use. These two levels are built for
markets that trade around the clock: futures, forex and crypto.
Second, the market may be open but the timeframe's bar grid steps
over the exact minute, which happens on 45-minute and 3-hour charts.
The bottom-right note distinguishes the two, because only the second
one is fixed by changing timeframe.
3. PREVIOUS-PERIOD LINES RUN BACK ACROSS THEIR OWN PERIOD. A line is
anchored at the start of the day, week or month whose high or low
it marks. On historical bars this means the line crosses the period
it summarises. It is not a prediction: the line was invisible while
that period was still forming, and only gained its length and its
final price when the period closed.
4. THE CURRENT PERIOD HAS NO LINE. Today's high and low are not drawn
until today ends. That is the point of the tool.
5. LOOKAHEAD IS USED. See the calculation section above. It is used
for period detection and for reading settled values; nothing
visible is derived from unsettled future data.
6. SATURDAY AND SUNDAY NAMES APPEAR ONLY ON CRYPTO SYMBOLS. On
weekday markets a Sunday evening reopen belongs to Monday's trading
session, so labelling it "Sunday" would be wrong. On crypto every
day is a real day and all seven names appear.
7. THE FIRST DAY ON THE CHART GETS NO NAME. Both anchors only speak for
a day whose opening separator was actually seen, and the chart's
first day is usually a partial one that began before the data did.
8. A LARGE GAP CAN SWALLOW A DAY BOUNDARY. If a holiday or weekend gap
contains the boundary instant entirely, no day line is drawn for
that day. This is deliberate: the alternative is a line at an
arbitrary point inside the gap.
9. BACKGROUND MODE IGNORES YOUR TRANSPARENCY. In "Background" draw
mode the colour swatch supplies the hue but the transparency is
forced to a fixed value. A swatch tuned to look right on a
1-pixel line renders almost opaque when it fills a whole bar.
10. DRAWINGS ARE CAPPED. TradingView allows a script 500 lines, 500
boxes and 500 labels. Day and week separators are capped at 250,
oldest dropped first, so they cannot starve the level lines. If you
request more previous levels than the remaining budget allows, a
note appears and the oldest are dropped.
11. VERY DEEP HISTORY IS TRIMMED. A drawing anchored to a bar index
can only reach about 10,000 bars back. A month is roughly 28,000
bars on a 1-minute chart, so the oldest levels are clamped rather
than allowed to throw an error, and a note says so.
12. SESSION BOXES DISAPPEAR ON VERY LONG CHARTS. TradingView deletes
the oldest box once 500 exist. On a 1-minute chart with four
sessions that is about 125 days.
13. NON-TIME-BASED CHARTS. On Renko, Range, Kagi, Point and Figure or
Line Break charts the "Apply Below" filters cannot work reliably,
because those chart types have no fixed bar duration. A note
appears. The script does not stop you.
14. DELAYED DATA. The script reads only bar data, so on a delayed feed
everything is drawn correctly but arrives late by the length of
the delay. Nothing recalculates differently and nothing breaks.
The only visible effect is that the currently-forming session box
lags real time.
15. THE SETTINGS PANEL USES INVISIBLE SPACING CHARACTERS to line the
dropdowns up into columns. This is purely cosmetic and affects
nothing the script calculates.
16. SOME LABELS USE NON-ASCII CHARACTERS by default: the yen, pound
and dollar signs on the session boxes, and bold letters on the
opening-level labels (D.O = daily open, W.O = weekly open, M.O =
monthly open, Y.O = yearly open, A.T.H = all-time high). If any
render as empty boxes on your system, type over them — every one
of those is a free-text field.
---------------------------------------------------------------------
SETTINGS REFERENCE
GENERAL
Timezone Used by the session times and the 00:00 and
10:00 levels. Handles daylight saving
automatically. Day and week lines read their own
timing from the market instead.
Show Warning The amber notes in the bottom-right corner. On by
Messages default. Turn them off once the behaviour is
familiar; turn them back on first if the chart
ever looks wrong.
DAY AND WEEK VERTICAL LINES
Enable Master switch for this section.
Apply Below Highest chart timeframe this section appears on.
Day Line On/off, plus line style, thickness and colour.
Week Line Same, for the week line. Where a week line is
drawn, that moment's day line is omitted.
Day Starts At Auto (exchange session) / Market open only /
Midnight - exchange time / Midnight - New York /
Custom time. Market open only skips the pre-market
and post-market; on markets that have neither it
matches Auto and says so on the chart.
Custom Time Hour and minute, used only in Custom time mode.
Custom Zone Which timezone that clock time is read in.
Week Starts Follow Day Start / Exchange Week / Specific Day,
plus the weekday for Specific Day.
Day Names Off / Short (Mon) / Full (Monday), plus text
colour and a manual horizontal nudge.
Draw As Lines, or Background tint of the whole bar.
SESSIONS
Enable Master switch.
Apply Below Highest chart timeframe this section appears on.
Asia / London / Each row: on/off, session times as HHMM-HHMM,
NY AM / NY PM box colour, and the letter written inside it.
Label Size Text size, and opacity of the letter (higher is
more visible).
PREVIOUS HIGHS & LOWS
Enable Master switch.
Extend Lines Right On/off, plus how many bars past the last bar.
Previous Day / Each row: on/off, colour, and how many previous
Week / Month periods to show (1 to 50).
Apply Below One per period type - three independent filters.
Line Style Style and thickness for every level here.
Fade Older Lines Older levels fade so the newest stands out.
OPENING LEVELS
Enable Master switch.
00:00 AM / 10:00 AM Each row: on/off, colour, the text written on
Daily / Weekly / the chart, and its own "apply below" timeframe.
Monthly / Yearly /
All-Time High
Line Style Style and thickness for every level here.
Text Colour Colour and size of all the labels.
Line Length How far past the last bar the lines and their
labels sit.
---------------------------------------------------------------------
ALERTS
This version has NO built-in alerts. That is a deliberate scope
decision, not an oversight: everything this script draws is context,
and context is not an event. An alert saying "a session started" fires
at a time you already knew in advance.
If you want to be notified when price reaches one of these levels, the
practical method today is a manual TradingView price alert:
1. Read the price off the level you care about - hover the line, or
open the Data Window (the icon on the right toolbar, or Alt+D on
Windows / Option+D on Mac) and read DH, DL, WH, WL, MH or ML.
2. Press Alt+A (Windows) or Option+A (Mac) to open the alert dialog.
3. In the first Condition dropdown, choose the SYMBOL, not the
indicator.
4. Set the second dropdown to Crossing.
5. Type the price you read in step 1.
6. Set Trigger to Only Once, choose your notification method, and
click Create.
This alert is on the price, not on the script, so it will not move
when the level moves. Re-create it each session.
Built-in alerts are the most requested thing this script does not
have, and they are the most likely addition to a future version.
---------------------------------------------------------------------
⚠️ FINAL REMINDER: this tool measures the past. It does not forecast
the future. Nothing it draws is a signal, a recommendation, or a
statement about what price will do next. Every trading decision, and
every consequence of it, is yours alone.
===================================================================== Indikator
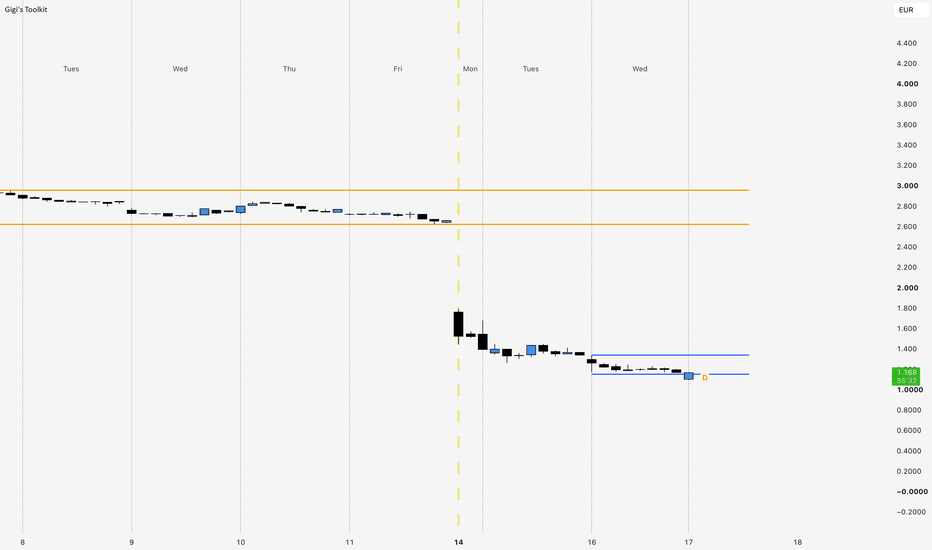
SMT Divergence ICT, Smart Money Technique & Correlation [LunqFX]Two instruments that normally move together stop agreeing. One makes a higher high, the other fails to. That disagreement is the SMT divergence — the Smart Money Technique — and it is one of the few reversal reads that comes from outside the chart you are trading rather than from the chart itself.
Every SMT divergence indicator marks the divergence and stops there. This one does two things they do not.
It draws the correlated symbol on your chart. Its path is rescaled into your own price range, so the moment the two structures part company is something you SEE rather than something a marker announces after the fact. And it measures the correlation between the two live, because an SMT divergence between instruments that are no longer moving together is not a signal at all — it is a coincidence, and by default those are not marked.
Included: automatic SMT detection at confirmed swing highs and lows, the correlated symbol drawn as a rescaled path, a live correlation reading with a warning state, a minimum-disagreement filter, swing-to-swing connectors, a dashboard and alerts.
❶ THE CORRELATED SYMBOL, DRAWN
The instrument yours is measured against is picked from the chart's own asset class — EURUSD against GBPUSD, ES against NQ, gold against silver, Bitcoin against Ethereum, SPX against NDX, a stock against SPY — or named by you, and its path appears on your chart as a grey line. The panel always shows which symbol is in use.
It is rescaled: the second symbol's range over a rolling window is mapped onto your chart's range over the same window, so the two can be compared by shape. The line therefore carries no price of its own. Reading a level off it would be meaningless; reading its STRUCTURE against yours is the entire point.
This is what makes an SMT divergence visible instead of asserted. When your chart pushes to a new high and the grey line rolls over beneath it, you are looking at the divergence itself rather than at a label telling you one occurred.
❷ THE CORRELATION CHECK — the part that decides whether any of it means anything
SMT rests on an assumption nobody states out loud: that the two instruments are correlated. When they are not, they disagree constantly, and every disagreement would print as a divergence.
So the correlation is measured over a window you choose and shown as a number with a bar. Above your threshold the number is white and the panel reads "marks armed". Below it the number turns amber, the panel reads "marks held", and by default no new marks are placed — because a divergence between two instruments that have stopped tracking each other is noise wearing the costume of a signal. The panel also counts how many divergences were held back this way, so a quiet chart is explained rather than mysterious.
That switch can be turned off if you want to see them anyway. The panel keeps telling you what the reading is worth.
❸ HOW A DIVERGENCE IS DETECTED
Swing points come from confirmed pivots, so a pivot only exists once the bars on both sides of it have closed.
At each new pivot the script compares two directions: the way your symbol moved from its previous pivot, and the way the correlated symbol moved between those same two points. When the signs disagree — yours made a higher high, theirs did not, or the reverse — that is the divergence.
The correlated symbol's extreme is read over a three-bar window centred on your pivot rather than off one bar, because two instruments rarely put their swing on exactly the same candle. The window is placed so that its latest bar is always a closed one.
Inverse pairs are handled. EURUSD against the dollar index is a classic SMT pairing, and their swings are mirrored: your high lines up with their low. When the measured correlation is negative the script reads their lows at your highs and their highs at your lows, and asks whether they confirmed in the mirror. The dashboard says "inverse pair" next to the symbols when this is the mode in use, so the marks are never a surprise.
One more condition has to be met. The correlated symbol must have travelled far enough the other way to count, measured against its own average bar range. Without that floor a second symbol that barely moved registers as a divergence, and the chart fills with marks that mean nothing. The threshold is adjustable and it is the setting worth changing first.
A bearish SMT prints at highs, a bullish SMT at lows, each joined to the swing it diverged from by a dashed line. The connector has a maximum length: a divergence is always against the previous pivot, and when that pivot is far back the mark still prints but the line is left out, because a dashed line reaching months across a chart tells you nothing.
❹ THE DASHBOARD
The header is the most recent divergence — bearish or bullish — and how many bars ago it confirmed, so the state of the pair is read in one line. While the divergence is recent the header is lit in its colour; once it is more than a few swings old it dims and reads "last SMT", because a reversal cue from two hundred bars back is history rather than a state. Beneath it: the two symbols, whether the partner was picked automatically, and whether they are being read as a direct or an inverse pair, the correlation right now with a bar and whether marks are armed or held, the number of bearish and bullish divergences found on the chart, and the number held back by weak correlation. When the correlated symbol is the same as the chart's, the header says so rather than showing a flat line and zero results.
The correlation shown is the reading now. A mark already on the chart was placed when the correlation at that bar cleared the threshold; the reading may have dropped since, and that does not remove the mark.
HOW TO USE IT
1 — Check the correlated symbol first. The automatic choice is the classic partner for your asset class and suits most charts; if you trade a pair it does not know, switch automatic selection off and name the instrument yourself. Nothing below works until the partner genuinely tracks yours.
2 — Read the correlation before the divergences. Strong correlation makes an SMT meaningful. Weak correlation means the two have decoupled, which is itself worth knowing and is a reason to stand aside rather than to trade the marks.
3 — Trade the divergence as a reversal cue, not a trigger. The instrument that failed to confirm is the one showing weakness. Combine it with your own entry model — SMT tells you the structures disagree, not where to enter.
4 — Watch the grey line as the swing forms. The divergence is visible before the pivot confirms; the mark simply makes it official. Traders who use SMT live are watching the second symbol fail, not waiting for a label.
5 — Raise the swing length on higher timeframes. At eight bars on a 5-minute chart you get many small divergences; at twenty on an hourly you get the ones that matter to a swing.
HOW IT WORKS
The partner symbol is chosen from the chart's ticker and asset type when automatic selection is on, otherwise taken from the input. Its high, low and close are requested on the chart's own timeframe with lookahead off. Correlation is the standard rolling coefficient between the two closes over your window; its sign decides whether the pair is read directly or in the mirror. The rescaled path maps the second symbol's close from its own rolling high-low range into your chart's, which preserves shape and discards level. Pivots come from the standard confirmed pivot functions. At each pivot the script stores your extreme and the correlated symbol's extreme over a three-bar window centred on that bar, together with the mode in use, and compares the direction of both moves at the next pivot. A divergence is registered when the directions disagree, the correlated move clears the minimum against its own average range, and — unless you switch the gate off — the correlation is above your threshold. If the correlation changes sign between two pivots, the stored pivot is discarded rather than compared across the change.
Works on any pair of instruments and any timeframe. It is most used on forex majors, index futures and the metals, where reliable correlated pairs exist.
LIMITATIONS — read before relying on it
▸ The automatic partner is a convention, not knowledge. It is chosen from the chart's asset class — forex, crypto, index, futures, metals, stocks — and a chart outside those, or one where a different partner is the right one, needs the symbol set by hand. A wrong partner is the fastest way to make this indicator produce nonsense, and the correlation reading is there to catch it.
▸ The rescaled path is shape, not price. It is fitted to a rolling window, so it moves when the window moves. Do not read levels, support or targets off it.
▸ Correlation is measured, not guaranteed. Two instruments can be strongly correlated over the window and uncorrelated during the hours you actually trade. The number describes the window you set and nothing else.
▸ Both directions of disagreement count. Yours making a higher high while theirs does not, and theirs making a higher high while yours does not, are both SMT. They read differently to a trader, and the script marks both.
▸ A pair whose correlation flips sign is unstable, and the script treats it that way: a stored pivot from one mode is never compared against a new pivot from the other. The first pivot after a sign change therefore produces no mark. If you see the panel alternating between direct and inverse, the pair is not one to trade SMT on.
▸ Marks arrive at the pivot's confirmation, not at the swing. That is the cost of not repainting: the swing must have bars closed on both sides of it before it exists. Lower the swing length for earlier marks and more of them.
▸ Different instruments keep different sessions and holidays. A gap in one and not the other can produce a divergence that is a data artefact rather than a market event. Comparing instruments from the same venue and asset class avoids most of this.
▸ On a very long chart the counts and the drawings drift apart. TradingView caps a script at five hundred lines and five hundred labels, and once past that the oldest marks are dropped while the dashboard keeps counting everything it found. Scroll far enough back and the marks stop before the numbers do.
▸ A divergence is a fact about two charts. What price does afterwards is not, and no count in the dashboard should be read as a success rate.
WHY IT IS ORIGINAL
The detection rule itself is the standard one — SMT is a published concept and there would be no point disguising it. What is not published is an SMT tool that draws the second symbol so the divergence can be seen, and that measures whether the two instruments are still correlated before it is willing to call a disagreement a signal.
The three parts need each other. The rescaled path without the correlation reading is a picture with no test behind it. The correlation without the path is a number with nothing to look at. The detection without either is what every other SMT script already is: a marker that asks you to trust its assumption.
SETTINGS
▸ The pair being compared — automatic partner selection or a manual correlated symbol, swing length, minimum disagreement.
▸ Correlation check — window, warning threshold, and whether marks are gated by it.
▸ Visuals — five candle palettes plus off, the correlated path with its rescaling window and line width, swing connectors and their maximum length, mark size, dashboard and its position.
ALERTS — bearish SMT divergence, bullish SMT divergence, and any SMT divergence. All fire on confirmed pivots.
NON-REPAINTING — divergences are built from confirmed pivots and the second symbol is requested on the chart's own timeframe with lookahead explicitly off. A mark that has printed never moves and never disappears.
This indicator is an educational market-analysis tool, not financial advice. It describes a disagreement between two instruments that has already happened and does not predict what either will do next. Always confirm with your own analysis and manage your risk. Indikator

Overnight Session StateOvernight Session State
Overnight drift is a well-known concept in equities and index futures. This indicator asks a narrower question. Does that drift depend on where price sat relative to the moving averages when the session began?
"If the close prints above the 1H EMA stack, does the night behave differently than if it prints below? Is a night that starts inside the stack a coin flip, or something else?"
That is the whole question this tool was built to answer. It reads where price sits against the EMA stack (20/50/100) at the 16:00 ET close, labels the night above, below or mixed, and draws what happened. The panel then keeps score for each label: average drift, win rate and average range.
🔶 USAGE
Load the indicator on a 1H chart. It was built and tested on index futures (MNQ, MES, NQ, ES), but it runs on anything with an overnight session — set the entry and exit hours to suit the market you're on.
Each overnight session is one shaded box, from the 16:00 ET entry bar to the 07:00 ET exit bar. The box height is the session high to low. The colour is the outcome: green if the 07:00 close finished above the 16:00 entry, red if below.
Inside each box, the solid line is the entry price and the dashed line is the exit price. The gap between them is the overnight drift.
The glyph on the top edge of each box is the state the night started in:
▲ ABOVE — price above all three EMAs at entry
▼ BELOW — price below all three EMAs at entry
• MIXED — price inside the stack at entry
Look at the ▼ nights and see if they look different from the ▲ nights. Then check the panel to see if you notice any trends.
The panel shows which state the current session is in, then a row for above, below and mixed with the number of nights, average drift in bp, win rate and average range in bp across the chart's loaded history. The last bar's time is written at the bottom so you know the numbers are current.
🔶 DETAILS
The state is set once, on the 16:00 bar, using the EMA values from the bar before. It doesn't change after that. The box colour updates as the night goes on and locks in at 07:00. Nothing repaints.
Drift is measured from the 16:00 open to the 07:00 close. Range is the high to low of the whole session. Both are in basis points (1 bp = 0.01%) so the numbers compare across contracts at different price levels.
Nights with no 07:00 bar within 16 hours (holidays, data gaps) are skipped. Sunday's entry is 18:00 ET. Session times are worked out in the session timezone, not the chart's, so the numbers don't change if you switch chart timezones, but the boxes will only line up with the time axis if the chart is set to New York.
🔶 SETTINGS
EMA Stack
EMA 1 / EMA 2 / EMA 3 — the three averages that set the state (20 / 50 / 100)
Show EMA stack — draw the three lines on the chart
EMA colours follow chart theme — lines pick a neutral colour to suit light or dark charts; untick to set your own
EMA 1 / 2 / 3 colour — used when the theme option is off
Session
Session timezone — America/New_York by default; the session hours below are read in this zone
Entry hour Mon–Thu — 16
Entry hour Sunday — 18
Exit bar hour — 7
Drop segment if no exit within (h) — nights with no exit bar inside this window are skipped
Style
Night paid — box and line colour when the exit closes above entry
Night lost — colour when it closes below
Box transparency — 80 by default
Show state glyph — the ▲ ▼ • marker on each box
Panel
Show panel
Corner — move the stats table if it overlaps something
🔶 SUMMARY
Most charts don't give you a clean look at the overnight session. This one does. Each night is labelled by where it started against the averages, boxed by what it did, and counted in the panel so you can see how each group has behaved over the history you've got loaded. What you make of it is up to you. Some people will see a pattern, some won't.
It's not a buy signal and it doesn't include commission or slippage. It's just a way to see how price moved during the overnight session.
Indikator

Adaptive Pivot Trend Levels [ChartPrime]⯁ OVERVIEW
The Adaptive Pivot Trend Levels indicator identifies market structure shifts by dynamically detecting swing pivots and converting them into adaptive support and resistance bands.
These levels update in real time and are removed once price violates them, allowing traders to clearly see which structural barriers remain respected during a trend.
The indicator builds a continuously adjusting trend line based on recent pivot averages and tracks how many levels remain intact vs. how many have been breached, offering a quantitative view of trend strength.
⯁ KEY FEATURES
Real-Time Pivot Detection
Automatically detects swing highs and lows using a user-defined pivot length.
Adaptive Trend Line
The average of recent pivots forms a dynamic trend line that shifts with market structure rather than price alone.
Active vs. Crossed Levels Tracking
Each pivot becomes a level that remains active until price breaks it.
When broken, the level is removed and counted as crossed, giving an objective measure of structural deterioration.
Trend Recalculation on Structure Shift
When trend direction changes, the indicator resets tracking, clearing outdated levels and starting a new structure phase.
Visual Level Management
• Active levels remain solid and labeled
• Crossed levels turn dotted and fade
• Cleared levels are deleted once irrelevant
Trend Classification
Trend direction is determined by the relationship between price and the adaptive trend line, providing uptrend, downtrend, or neutral states.
Compact Dashboard
A top-right table displays:
• Current trend direction
• Number of active levels
• Number of crossed levels
⯁ HOW TO USE
Evaluate Trend Strength:
A strong trend shows multiple active levels and few crossed ones, confirming structural respect.
Watch for Structural Breaks:
When several consecutive levels are crossed, the current trend is weakening and a reversal or consolidation may be forming.
Use as Context with S/R or Order Blocks:
Active levels frequently align with meaningful support/resistance and institutional reaction points.
Confirm Trend Shifts:
A reset in level tracking plus a change in trend line bias signals a fresh trend phase.
⯁ CONCLUSION
The Adaptive Pivot Trend Levels indicator provides a clean structural framework by tracking how price interacts with pivot-based levels.
Its adaptive trend line and real-time level management make it a powerful tool for assessing trend strength, identifying breakdowns in structure, and supporting confluence with other technical tools. Indikator

Adaptive Ehlers Filtered PercentileAdaptive Ehlers Filtered Percentile is a trend-regime indicator that combines a volatility-adaptive moving average, a displacement-weighted nonlinear filter, and percentile-based price-deviation bands.
The indicator is designed to separate three tasks: adapt the baseline response to changing price variability, further filter that baseline according to historical displacement, and derive regime thresholds from the observed distribution of price-to-trend deviations rather than from a fixed percentage or standard-deviation multiplier.
🟣How It Works
The first stage measures the standard deviation of one-bar price changes.
That volatility measurement is compared with a rolling reference range. The resulting position inside the range determines the effective moving-average period between the user-defined Minimum MA Period and Maximum MA Period.
Higher volatility favors the shorter period, while lower volatility favors the longer period.
The adaptive period is converted into a smoothing coefficient and applied recursively to produce the Adaptive MA.
🟣Displacement-Weighted Filter
The Adaptive MA is then processed through a nonlinear weighted filter.
For each observation in the filter window, the script compares the current Adaptive MA value with another Adaptive MA value separated by the Momentum Length.
The absolute displacement between those observations becomes the weighting coefficient.
Observations associated with larger displacement therefore contribute more heavily to the final filtered trend value, while observations with little displacement contribute less.
If valid weighting coefficients are unavailable, a simple moving average of the Adaptive MA is used as a fallback.
🟣Percentile Bands
The indicator measures the absolute distance between price and the filtered trend:
Absolute Deviation = |Price - Filtered Trend|
These deviations are ranked over the selected Percentile Length.
The chosen Percentile Level determines the historical deviation used as the base band distance.
Unlike standard-deviation bands, this approach does not assume a particular distribution of deviations. The band width instead comes directly from the ranked historical observations.
Separate upper and lower multipliers allow the two sides of the structure to be adjusted independently.
🟣Regime Logic
A bullish regime begins when the selected source moves above the upper percentile band.
A bearish regime begins when the selected source moves below the lower percentile band.
When price remains between the two bands, the previous regime is retained.
LONG and SHORT markers are therefore displayed only when the persistent regime changes rather than on every bar that remains outside a threshold.
🟣Main Settings
Minimum MA Period / Maximum MA Period define the response range of the volatility-adaptive moving average.
Volatility Period controls how much recent price-change history is used to determine the adaptive response.
Filter Length determines how many Adaptive MA observations contribute to the displacement-weighted filter.
Momentum Length determines the historical separation used when measuring displacement for the filter weights.
Percentile Length defines the sample of historical price-to-filter deviations.
Percentile Level determines which ranked deviation becomes the base band width. Higher percentiles generally create more selective thresholds.
Upper Band Multiplier / Lower Band Multiplier independently scale the bullish and bearish thresholds.
🟣Design Purpose
The indicator uses each component for a specific role:
Price-change volatility → Adaptive MA response
Adaptive-MA displacement → Nonlinear filtering weights
Historical absolute deviation → Percentile band width
Band breakout → Persistent market regime
The percentile stage is applied to the actual distance between price and the adaptive filtered baseline. This allows the threshold structure to adjust to the historical distribution of deviations rather than relying only on a fixed volatility multiplier.
The asymmetric upper and lower multipliers also allow the bullish and bearish breakout requirements to be configured independently.
🟣Limitations
This indicator is a trend-regime tool and not a complete trading system. LONG and SHORT labels identify changes in the indicator's internal regime; they do not imply guaranteed trade outcomes or future performance.
Percentile thresholds are based on historical observations within the selected lookback. A change in market behavior can therefore alter the band width as new deviations enter the sample.
The adaptive moving average and nonlinear filter are derived from current and historical price information and remain dependent on the selected parameters.
The script does not use higher-timeframe requests or lookahead logic. Indikator


