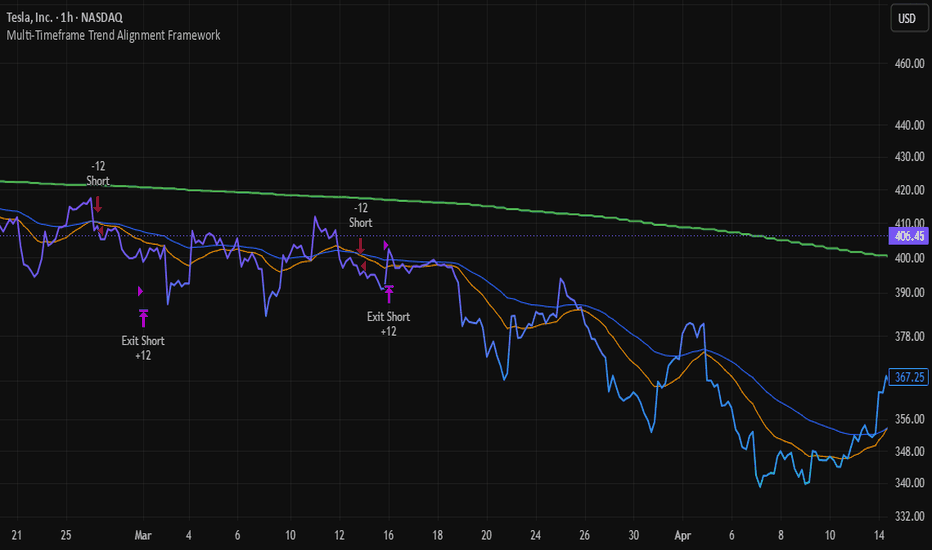
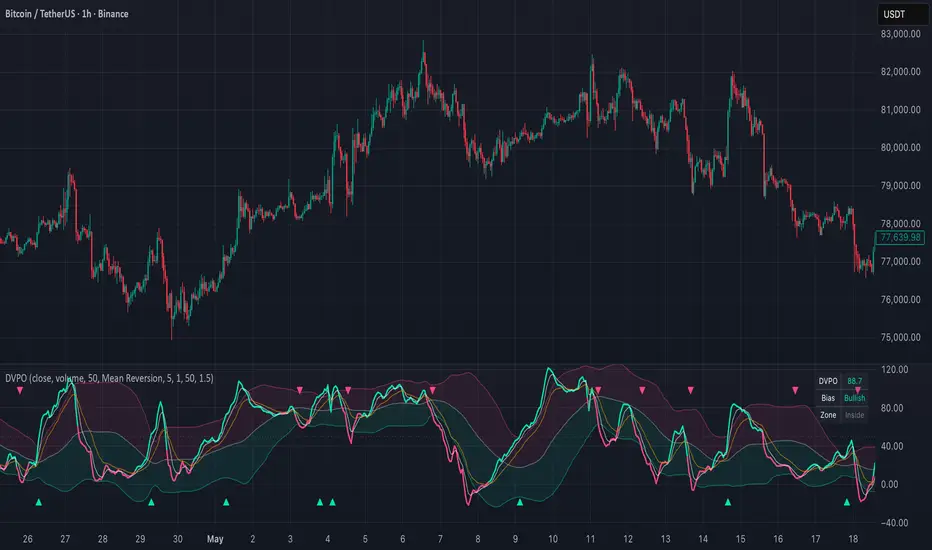
Daily VWAP Deviation MapDaily VWAP Deviation Map plots the current exchange day's VWAP and volume-weighted standard-deviation bands around it.
The purpose of this script is to show how far price is trading from the day's volume-weighted mean. Distance is displayed in price units, percent, and sigma distance. This is a context and visualization tool. It does not provide trade-action instructions and it is not a trading system.
What it shows
- Daily VWAP based on the selected source, default hlc3.
- Inner, outer, and optional tail deviation bands.
- Sigma distance from the current day's VWAP.
- A neutral state model that describes price location relative to VWAP.
- A compact dashboard with state, sigma distance, percent distance, VWAP, and volume mode.
- Optional non-arrow event markers for factual band-crossing events.
How it works
At the start of each exchange day, the calculation resets and begins accumulating volume-weighted sums from the current chart bars.
The script maintains:
- cumulative volume
- cumulative price times volume
- cumulative price squared times volume
- session bar count
From these values, it calculates:
VWAP = cumulative price times volume / cumulative volume
variance = cumulative price squared times volume / cumulative volume - VWAP squared
sigma = square root of variance, guarded against rounding noise
The script then calculates:
- raw distance from VWAP
- percent distance from VWAP
- sigma distance from VWAP
All calculations use current chart bars only. The script does not use request.security(), lookahead, or future data. Historical values are not recalculated with future information.
Daily anchoring
The daily reset follows the chart symbol's exchange day and timezone. This reset is used only to anchor the VWAP calculation to the current day. It is not a session highlighter and it does not shade Tokyo, London, New York, or other trading sessions.
Deviation states
The dashboard uses neutral descriptive states:
- Warming up
- Near VWAP
- Inner range
- One-sigma edge
- Two-sigma extension
- Outer tail
These states describe current price location. They do not imply future reversal or continuation.
Bands and multipliers
The inner, outer, and tail band multipliers are user-configurable. The active outer tier is kept above the active inner tier, and the active tail tier is kept above the outer tier. Event markers and alerts follow the active inner and outer band tiers so they remain aligned with the displayed bands when users customize the multipliers.
Volume handling
When usable volume is available, the calculation is volume-weighted. If volume is missing or not positive and fallback is enabled, the script uses an equal-weight fallback so the display can remain continuous. The dashboard discloses this clearly.
The dashboard volume mode can show:
- Volume-weighted
- Equal-weight fallback
- No usable volume
On some symbols, especially certain FX or CFD feeds, volume may represent tick volume or may not be available. This affects how VWAP and deviation bands should be interpreted.
Events and alerts
Event markers are small, neutral, non-arrow plotshape markers. They describe factual events only, such as:
- crossed above the upper inner band
- crossed below the lower inner band
- crossed above the upper outer band
- crossed below the lower outer band
- returned inside from an upper or lower extension
- crossed VWAP
Alerts use the same neutral event logic. The default setting evaluates events on confirmed bars only to reduce intrabar repainting.
Customization
Users can adjust the dashboard position, layout density, text size, plot colors, table colors, marker colors, and transparency settings.
The default dashboard position is Top right padded. It keeps the panel in the upper-right area while using subtle internal spacing to reduce clutter near the chart's right-side price-scale labels. Users can switch to standard Top right or any other available table anchor.
The default layout is Compact for a clean chart. Standard and Detailed layouts are available for users who want more information.
Intended use
This indicator is designed for intraday charts. On daily or higher timeframes, the script avoids showing misleading daily VWAP deviation bands and displays an intraday-use notice instead.
Limitations
This script is not financial advice and not a trading system.
Distance from VWAP does not guarantee reversal or continuation.
Default settings are starting points, not optimized settings.
Early-session VWAP and sigma readings can be sensitive because fewer bars have been accumulated.
Volume quality differs across markets and symbols.
Japanese notes
当日VWAPと出来高加重標準偏差バンドを使って、価格が当日の平均価格からどれだけ乖離しているかを表示します。状況把握用の可視化ツールであり、売買判断や将来の値動きを示すものではありません。出来高が使えない銘柄では等加重フォールバック、または No usable volume を表示します。イントラデイ向けです。 Indikator

Flipped Inverted Z-Score (Subpane)Flipped Inverted Z-Score (Subpane) Indicator
What It Does
This indicator measures how far an asset's current price deviates from its long-term average, expressed as a Z-Score — a statistical measure of standard deviations from the mean.
The description "flipped inverted" means the score rises when price is above its long-term average (bullish territory) and falls when price is below it (bearish territory), making it intuitive to read at a glance.
The indicator also highlights when an asset is overheated (orange) and when the asset has cooled off significantly (blue). Oftentimes when an asset is overheated investors are taking profit, and when an asset is oversold investors are accumulating. It's important though to note that an asset can be overbought or oversold for a long period of time (or may in fact never return to prior highs or lows). The z-score highlights bright green and bright red at extreme values, further enhancing these overbought and oversold areas.
The indicator occupies a separate subpane below your main chart, so it never clutters your price action.
Core Calculations
Three values drive everything:
1-Year Moving Average (MA) — the long-term baseline representing "fair value"
Standard Deviation Proxy MA — a shorter MA used to normalize the deviation, making the score comparable across different assets and price ranges
Flipped Z-Score — computed as -(1Y MA - Price) / Std Dev MA, so positive = price above fair value, negative = price below
The Z-Score is dimensionless and asset-agnostic, meaning it works equally well on Bitcoin at $100k or a stock at $15. This normalization is the key benefit over a plain moving average crossover indicator.
Visual Elements
Z-Score Line
The main line changes color dynamically:
🟢 Lime — Strongly above threshold (bullish momentum)
🟩 Green — Mildly positive (above zero, below threshold)
🟥 Maroon — Mildly negative (below zero, above threshold)
🔴 Red — Strongly below threshold (bearish momentum)
Slow & Fast Moving Averages of the Z-Score
Two smoothed MAs are overlaid on the Z-Score line itself, helping filter noise and identify trend direction within the indicator. Both turn green above zero and red below zero.
Background Highlighting (Hot/Cold Zones)
An optional orange or blue background appears when conditions align for potentially overbought or oversold readings:
🟠 Orange background — Z-Score is elevated, above both MAs, and exceeds the hot threshold → potential overbought/overheated zone
🔵 Blue background — Z-Score is depressed, below both MAs, and exceeds the cold threshold → potential oversold/undervalued zone
Crossover Dots (Optional Alerts)
Small colored dots mark moments when the Z-Score crosses above or below the Slow MA — useful as entry/exit signal triggers or for setting TradingView alerts.
Baseline Reference Line
A horizontal line at zero marks the dividing line between price being above or below long-term fair value. (Additional lines can be added to help as references. You may find that certain assets are less volatile, and therefore deviate less from the base reference line. This difference may also occur over time for example in the case of a new asset versus a more mature asset.)
User-Configurable Settings
Setting Default — What It Controls
Price Source (Close) — Which OHLCV value drives the calculation
1-Year MA Period (365 bars) — Long-term "fair value" baseline length
Std Dev Proxy Period (150 bars) — Normalization window, shorter = more sensitive
Z-Score Deviation Threshold (±SD) (0.50) — Where the line color flips from mild to strong
Background Hot Threshold (0.34) — Minimum Z-Score to trigger orange background
Background Cold Threshold (0.40) — Minimum Z-Score depth to trigger blue background
Enable Background Highlighting (On) — Toggle hot/cold background on or off
Show Horizontal Reference Lines (On) — Toggle the zero baseline line
Show Z-Score Moving Averages (On) — Toggle the slow and fast MA lines
Slow MA Period (50 bars) — Smoothing period for the trend-following MA
Fast MA Period (3 bars) — Smoothing period for the responsive MA
Show Crossover Dots (Off) — Toggle the MA crossover signal dots
Practical Use Cases
Macro cycle positioning — on daily/weekly charts with default 365-bar settings, the score gives a birds-eye view of where an asset sits in its broader cycle, useful for sizing positions larger or smaller
Overbought/oversold screening — orange and blue backgrounds highlight historically stretched conditions worth watching for reversals
Trend confirmation — when the Z-Score, Slow MA, and Fast MA are all aligned on the same side of zero, it confirms the broader trend direction
Cross-asset comparison — because the score is normalized, you can apply identical settings to BTC, ETH, SPY, or any stock and compare readings directly
Alert triggers — crossover dots (when enabled) give discrete signal events you can attach TradingView alerts to, removing the need to watch the chart constantly
Tips for Tuning
Shorter timeframes (1H, 4H): consider reducing the 1-Year MA period and Std Dev period proportionally, and uncomment the threshold lines in the source code for finer visual guidance
More sensitive signals: lower the Fast MA period toward 1–2 and tighten the deviation threshold
Reduce noise: raise the Slow MA period and increase the hot/cold thresholds so backgrounds only appear during truly extreme readings
Indikator

Indikator
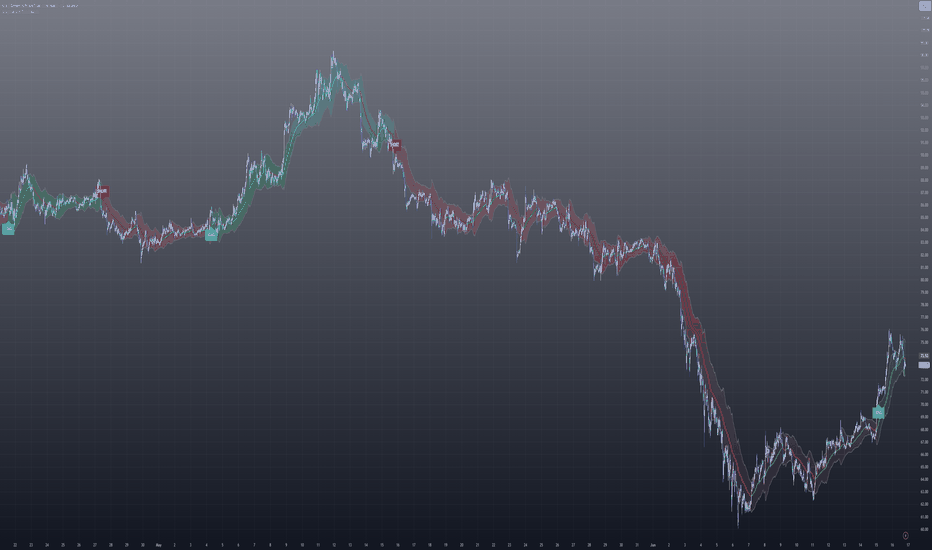
Power Bar Radar
1. Overview
Power Bar Radar is a visual candle-analysis indicator designed to highlight candles with unusually strong directional behavior.
The indicator uses only the current chart symbol's own data. It does not use any external benchmark, comparison symbol, or market index.
The purpose of the indicator is to help traders identify candles that may deserve extra attention because they show a statistically large move, strong close location, and range expansion.
This is an indicator, not a strategy. It does not place trades, does not execute orders, and does not produce TradingView Strategy Tester results.
2. Core Idea
Not every green candle is strong.
Not every red candle is important.
Power Bar Radar attempts to separate ordinary candles from candles that show unusual directional pressure.
A candle is marked as a Power Bar only when several conditions align on the same bar.
The indicator is designed to answer this question:
Is this candle normal, or is it showing unusually strong directional behavior?
3. Power Bar Conditions
A candle is classified as a Power Bar only when the following conditions are met:
1. Significant move
The candle's net move must be statistically large compared with recent bars.
The script uses a z-score style calculation to compare the current candle's net change with recent price changes.
2. Strong close location
A bullish Power Bar must close near the upper part of its candle range.
A bearish Power Bar must close near the lower part of its candle range.
This helps avoid marking candles that moved strongly during the bar but failed to hold that move into the close.
3. Range expansion
The candle range must be wider than the recent average range.
This helps filter out small or quiet candles that do not show meaningful expansion.
4. Optional volume confirmation
The script includes an optional volume filter.
When enabled, the candle must also have volume above its recent average by a selected factor.
This can help add an additional confirmation layer on markets with reliable volume data.
4. Bull Power Bar
A Bull Power Bar appears when the candle shows strong upward behavior.
The default bull power color is yellow.
A Bull Power Bar may indicate that buyers showed strong control during that candle.
However, a Bull Power Bar is not a buy signal by itself.
It should be treated as an alert that a strong bullish candle appeared and should be reviewed in context.
5. Bear Power Bar
A Bear Power Bar appears when the candle shows strong downward behavior.
The default bear power color is light blue.
A Bear Power Bar may indicate that sellers showed strong control during that candle.
However, a Bear Power Bar is not a sell signal by itself.
It should be treated as an alert that a strong bearish candle appeared and should be reviewed in context.
6. Important Usage Note
A Power Bar candle is not enough by itself to enter or exit a trade.
The candle only alerts the user that unusual directional strength appeared on the chart.
A strong candle can appear:
* Near the beginning of a move
* In the middle of a move
* Near the end of an extended move
* Around support or resistance
* During a breakout
* During a rejection
* During a volatile market reaction
Because of this, users should not treat Power Bars as automatic buy or sell signals.
The correct use is to combine them with broader analysis.
7. Best Way to Use the Indicator
The best way to use Power Bar Radar is as a confirmation and attention tool.
A practical workflow:
1. Identify the overall market direction.
2. Mark key support and resistance levels.
3. Watch for Power Bars near important areas.
4. Use Bull Power Bars to identify candles with unusually strong bullish behavior.
5. Use Bear Power Bars to identify candles with unusually strong bearish behavior.
6. Check whether the Power Bar appears during a breakout, breakdown, pullback, rejection, or continuation move.
7. Confirm with market structure, trend, volume, higher timeframe context, and risk management.
8. Avoid entering trades based only on the candle color.
9. Example Uses
Breakout confirmation
If price breaks above resistance and a Bull Power Bar appears, it may suggest that the breakout candle had unusually strong bullish behavior.
This does not guarantee continuation, but it can help the user identify a stronger breakout candle compared with normal candles.
Support reaction
If price reacts from a support area and a Bull Power Bar appears, it may suggest that buyers responded strongly at that area.
The user should still check trend, structure, and risk before making any decision.
Resistance rejection
If price reaches resistance and a Bear Power Bar appears, it may suggest that sellers showed strong pressure at that area.
This should be reviewed with structure and confirmation. It is not an automatic sell signal.
Breakdown confirmation
If price breaks below support and a Bear Power Bar appears, it may suggest that the breakdown candle had unusually strong bearish behavior.
This can be useful as a visual warning of strong downside pressure.
9. Optional Volume Filter
The volume filter is OFF by default.
This is intentional because not all markets have reliable volume data.
For stocks and some crypto markets, users may enable the volume filter to require above-average volume before a candle is marked as a Power Bar.
For forex, indices, or symbols with unreliable volume, users may prefer to keep the volume filter OFF.
10. Display Options
The indicator includes simple display options:
* Show or hide Power Bar markers
* Tint Power Bar candles
* Change Bull Power Bar color
* Change Bear Power Bar color
The default colors are designed to avoid confusion with standard green and red candles:
* Bull Power Bar: yellow
* Bear Power Bar: light blue
Users can change these colors from the settings.
11. Alerts
The script includes alert conditions for:
* Bull Power Bar
* Bear Power Bar
Alerts notify users when a bullish or bearish Power Bar appears.
Alerts are notifications only. They do not place trades, do not execute orders, and do not confirm broker execution.
12. Suggested Use Cases
Power Bar Radar can be useful for:
* Identifying unusually strong candles
* Breakout review
* Breakdown review
* Support and resistance reaction analysis
* Trend continuation review
* Rejection candle review
* Momentum candle detection
* Visual candle-strength filtering
* Reducing focus on ordinary candles
* Highlighting candles that deserve further analysis
13. What This Indicator Does Not Do
This indicator does not predict future price movement.
It does not guarantee continuation.
It does not guarantee reversal.
It does not provide buy or sell recommendations.
It does not replace a complete trading plan.
It does not manage risk.
It does not set stop losses or take profits.
It does not confirm that a trade should be taken.
It only highlights candles that meet the selected Power Bar conditions.
14. Limitations
Power Bars can appear late in a move.
Power Bars can appear during volatile market reactions.
A Bull Power Bar can appear before a pullback.
A Bear Power Bar can appear before a bounce.
Markets can reverse after strong candles.
The optional volume filter may not be useful on symbols with unreliable volume data.
Users should always analyze the broader chart context before making any decision.
15. Recommended Confirmation
For better use, consider combining Power Bar Radar with:
* Support and resistance
* Trend direction
* Market structure
* Volume analysis
* Higher timeframe analysis
* Moving averages
* Breakout or pullback setups
* Risk management rules
The Power Bar should be treated as a visual alert, not as a complete trading signal.
16. Originality and Purpose
Power Bar Radar combines statistical move detection, candle close-location analysis, range expansion, optional volume confirmation, and clean visual candle marking.
The purpose is to help traders identify candles that show unusual strength or pressure without adding unnecessary lines, oscillators, or external comparisons.
The indicator is designed to be simple, visual, and focused on candle behavior.
17. Educational Disclaimer
This script is for educational and chart-analysis purposes only. It is not financial advice, investment advice, or a recommendation to buy or sell any financial instrument. Users are responsible for their own analysis, risk management, and trading decisions.
Indikator

Barrier Option-Style Breakout Indicator [v1]The Barrier Option-Style Breakout Indicator is a path-dependent breakout tool inspired by barrier option logic.
In barrier options, the path of price matters. It is not enough to know where price ends. What matters is whether price touched, breached, activated, retested, or failed around a specific barrier level.
This indicator applies that same idea to breakout trading.
Instead of only asking whether price is above resistance or below support, the indicator asks:
• Has price reached the barrier?
• Has the barrier been confirmed?
• Did the breakout pass volatility and volume quality filters?
• Did price retest the barrier and hold?
• Did price fail back inside the range?
• Is the breakout active, weak, confirmed, or failed?
This is not a simple buy or sell signal indicator.
It is a breakout-quality and path-dependency framework designed to help traders evaluate whether a breakout has enough structure, confirmation, and follow-through.
The indicator can be used across FX, crypto, indices, commodities, futures, and liquid stocks.
WHAT THE INDICATOR DOES
━━━━━━━━━━━━━━━━━━━━━━
The indicator creates upper and lower barrier levels.
These barriers can be based on:
• Recent range high and range low
• Manual user-defined levels
• Expected-move levels
Once a barrier is touched or breached, the script tracks what happens next.
It classifies the market into states such as:
• Neutral
• Weak upper breach
• Weak lower breach
• Bullish knock-in
• Bearish knock-in
• Bullish retest confirmed
• Bearish retest confirmed
• Bullish barrier failed
• Bearish barrier failed
The key advantage is that the indicator remembers the active barrier and monitors the post-breakout path.
This makes it more useful than a simple horizontal breakout line.
CORE IDEA
━━━━━━━━━━━━━━━━━━━━━━
A normal breakout indicator usually checks whether price has crossed a level.
This indicator goes further.
It treats the breakout level as a barrier.
Once price activates the barrier, the indicator tracks whether the breakout becomes more credible or fails.
The logic is:
1. Define the upper and lower barriers.
2. Watch for price to touch or close beyond a barrier.
3. Apply breakout confirmation rules.
4. Check volatility and volume quality filters.
5. Track the active barrier after breakout.
6. Watch for a retest.
7. Watch for a failure back inside the barrier.
8. Classify the current market state.
This gives the trader a more complete breakout map.
MAIN COMPONENTS
━━━━━━━━━━━━━━━━━━━━━━
1. Barrier Mode
The script includes three barrier modes:
• Range High/Low
• Manual
• Expected Move
Range High/Low uses the recent highest high and lowest low over the selected lookback period.
Manual allows the trader to enter custom upper and lower barrier levels.
Expected Move creates dynamic barriers using volatility and expected-move logic.
Range High/Low is usually best for technical breakout trading.
Manual is useful for major levels, event levels, round numbers, or externally defined support and resistance.
Expected Move is useful for volatility-adjusted breakout analysis.
2. Range Lookback
When using Range High/Low mode, the range lookback determines how many bars are used to calculate the upper and lower barriers.
A shorter lookback creates more reactive barriers.
A longer lookback creates more important, but slower-moving barriers.
For intraday trading, 30 to 80 bars can be useful.
For swing trading, 50 to 200 bars may be more appropriate.
3. Manual Barriers
Manual mode allows the trader to input a specific upper and lower barrier.
This is useful when the trader already knows the key levels.
Examples include:
• Previous day high
• Previous day low
• Weekly high
• Weekly low
• Major support
• Major resistance
• Round number
• Event anchor level
• Liquidity zone
4. Expected Move Barriers
Expected Move mode calculates barriers using volatility.
The indicator estimates expected movement over a selected horizon and places the upper and lower barriers around the anchor price.
This mode is useful when the trader wants breakout levels to adapt to current volatility.
If volatility is high, the expected-move barriers widen.
If volatility is low, the expected-move barriers narrow.
5. Breakout Confirmation
The script includes three confirmation modes:
• Touch Barrier
• Close Beyond Barrier
• Close + Buffer
Touch Barrier is the most sensitive.
Close Beyond Barrier requires the candle to close beyond the barrier.
Close + Buffer requires price to close beyond the barrier by an additional buffer.
Close + Buffer is the strictest and usually the best setting for reducing false breakouts.
6. Breakout Buffer
The breakout buffer helps reduce false signals.
The buffer can be based on:
• ATR
• Percent
• Ticks
ATR buffer is generally the most adaptive because it scales with current market volatility.
For example, a 0.25 ATR buffer means price must close beyond the barrier by 25% of the current ATR.
7. Retest Logic
After a breakout, price often returns to test the breakout level.
The indicator can monitor whether price retests the active barrier and holds.
A bullish retest is confirmed when price breaks above the upper barrier, returns toward that barrier, and holds above it.
A bearish retest is confirmed when price breaks below the lower barrier, returns toward that barrier, and holds below it.
This is useful because many traders prefer to enter after a breakout retest rather than on the initial breakout candle.
8. Retest Window
The retest window controls how many bars after the breakout the indicator will monitor for a valid retest.
A short window is stricter.
A longer window gives price more time to return to the barrier.
For intraday trading, 8 to 24 bars can be useful.
For swing trading, 20 to 50 bars may be more appropriate.
9. Retest Tolerance
The retest tolerance controls how close price must come to the active barrier to qualify as a retest.
The tolerance can be based on:
• ATR
• Percent
• Ticks
ATR tolerance is usually the best default because it adapts to volatility.
10. Failure Logic
A failed breakout occurs when price breaks the barrier but then returns back inside the prior range.
For a bullish breakout, failure occurs when price breaks above the upper barrier but then closes back below the active barrier.
For a bearish breakout, failure occurs when price breaks below the lower barrier but then closes back above the active barrier.
Failure detection is important because failed breakouts can produce strong reversal moves.
11. Quality Filters
The script includes volatility and volume quality filters.
The volatility filter checks whether volatility percentile is high enough to support a quality breakout.
The volume filter checks whether current volume is elevated relative to average volume.
A breakout that passes both filters is treated as stronger.
A breakout that breaches the barrier but fails the quality filters is marked as a weak breach.
12. Barrier Hit Probability Proxy
The indicator includes a simple barrier hit probability estimate.
This is not a full barrier option first-passage model.
It is a simplified approximation based on:
• Distance to the barrier
• Expected move
• Selected barrier sigma
It gives a rough sense of how close price is to the upper or lower barrier in volatility-adjusted terms.
HOW TO READ THE INDICATOR
━━━━━━━━━━━━━━━━━━━━━━
The indicator plots barrier levels on the price chart.
Visual guide:
• Green line = Upper Barrier
• Red line = Lower Barrier
• Faded green line = Upper confirmation level when buffer is enabled
• Faded red line = Lower confirmation level when buffer is enabled
• White line = Active Barrier after breakout activation
Signal labels show:
• Knock-In
• Weak
• Retest
• Fail
A Knock-In signal means the barrier breakout has been activated.
A Weak signal means the barrier was breached, but quality filters failed.
A Retest signal means price returned to the active barrier and held.
A Fail signal means price broke the barrier but failed back inside.
The dashboard shows:
• Market State
• Barrier Mode
• Upper Barrier
• Lower Barrier
• Active Barrier
• Bars Since Breakout
• Volatility Percentile
• Volume Ratio
• Quality Filter
• Probability Hit Upper
• Probability Hit Lower
MARKET STATE DEFINITIONS
━━━━━━━━━━━━━━━━━━━━━━
Neutral
Neutral means no active confirmed breakout state is present.
Price may be trading inside the range or near a barrier without confirmation.
Weak Upper Breach
A weak upper breach occurs when price breaches the upper barrier, but the quality filters do not pass.
This suggests the upside breakout may lack volatility or volume support.
Weak Lower Breach
A weak lower breach occurs when price breaches the lower barrier, but the quality filters do not pass.
This suggests the downside breakout may lack volatility or volume support.
Bullish Knock-In
Bullish Knock-In means the upper barrier has been activated by a confirmed bullish breakout.
This suggests upside breakout conditions are active.
Bearish Knock-In
Bearish Knock-In means the lower barrier has been activated by a confirmed bearish breakout.
This suggests downside breakout conditions are active.
Bullish Retest Confirmed
Bullish Retest Confirmed means price broke above the upper barrier, returned to retest it, and held above it.
This is often a higher-quality bullish continuation condition than the initial breakout candle alone.
Bearish Retest Confirmed
Bearish Retest Confirmed means price broke below the lower barrier, returned to retest it, and held below it.
This is often a higher-quality bearish continuation condition than the initial breakdown candle alone.
Bullish Barrier Failed
Bullish Barrier Failed means price broke above the upper barrier but then failed back below the active barrier.
This may indicate a failed breakout, bull trap, liquidity sweep, or exhaustion move.
Bearish Barrier Failed
Bearish Barrier Failed means price broke below the lower barrier but then failed back above the active barrier.
This may indicate a failed breakdown, bear trap, liquidity sweep, or exhaustion move.
HOW TO USE THE INDICATOR
━━━━━━━━━━━━━━━━━━━━━━
Use this indicator as a breakout-quality framework.
The script is designed to help answer:
• Where are the active breakout barriers?
• Has price breached the barrier?
• Did the breach pass quality filters?
• Has the breakout retested and held?
• Has the breakout failed back inside?
• Is the breakout worth following or should it be avoided?
The indicator should not be used alone for trade entries.
Use it with market structure, trend, liquidity, volatility regime, expected-move levels, and risk management.
PRACTICAL TRADING WORKFLOW
━━━━━━━━━━━━━━━━━━━━━━
1. Choose the barrier mode.
Use Range High/Low for normal breakout trading.
Use Manual for known levels.
Use Expected Move for volatility-adjusted breakout zones.
2. Choose confirmation mode.
Use Close Beyond Barrier for balanced confirmation.
Use Close + Buffer for stricter breakout confirmation.
Use Touch Barrier only for aggressive or early-warning use.
3. Check quality filters.
A breakout is stronger when volatility and volume filters pass.
A weak breach should be treated with caution.
4. Watch the active barrier.
After a breakout, the active barrier becomes the key reference level.
For bullish breakouts, the upper barrier becomes the key support test.
For bearish breakouts, the lower barrier becomes the key resistance test.
5. Wait for retest if needed.
Conservative traders may wait for Retest Confirmed before entering.
This can reduce chasing risk after the initial breakout candle.
6. Watch for failure.
If price returns back inside the barrier within the failure window, the breakout has failed.
Failed breakouts can become reversal opportunities, but they still require confirmation.
7. Manage risk.
Breakouts can be volatile.
Do not use the signal without stop-loss planning, position sizing, and reward-to-risk evaluation.
BREAKOUT INTERPRETATION
━━━━━━━━━━━━━━━━━━━━━━
Bullish Breakout Setup
A higher-quality bullish breakout may include:
• Price breaks above the upper barrier
• Confirmation mode is satisfied
• Volatility filter passes
• Volume filter passes
• Price holds above the active barrier
• Retest is confirmed
• Higher-timeframe structure supports upside
Bearish Breakout Setup
A higher-quality bearish breakout may include:
• Price breaks below the lower barrier
• Confirmation mode is satisfied
• Volatility filter passes
• Volume filter passes
• Price holds below the active barrier
• Retest is confirmed
• Higher-timeframe structure supports downside
Weak Breakout
A weak breakout may occur when:
• Price breaches the barrier but volume is low
• Volatility percentile is too low
• Price fails to close beyond the buffer
• Price immediately returns inside the range
• Breakout occurs into major opposing structure
Failed Breakout
A failed breakout may occur when:
• Price breaks the barrier
• Traders chase the breakout
• Price reverses back inside the barrier
• The active barrier fails to hold
• The market traps breakout traders
Failed breakouts should not be ignored. They often contain useful information about liquidity and positioning.
SUGGESTED SETTINGS
━━━━━━━━━━━━━━━━━━━━━━
FX 1-Hour
• Barrier Mode: Range High/Low
• Range Lookback Bars: 50
• Breakout Confirmation: Close + Buffer
• Buffer Mode: ATR
• ATR Buffer Multiplier: 0.20 to 0.35
• Retest Window Bars: 12 to 24
• Failure Window Bars: 12 to 24
• Volatility Filter: True
• Minimum Vol Percentile: 50
• Volume Filter: False or True depending on broker volume quality
• Bars Per Year: 6240
Crypto 1-Hour
• Barrier Mode: Range High/Low
• Range Lookback Bars: 50 to 100
• Breakout Confirmation: Close + Buffer
• ATR Buffer Multiplier: 0.25 to 0.50
• Retest Window Bars: 24
• Failure Window Bars: 24
• Volatility Filter: True
• Volume Filter: True
• Minimum Volume Ratio: 1.20
• Bars Per Year: 8760
Indices 15-Minute or 1-Hour
• Barrier Mode: Range High/Low
• Range Lookback Bars: 30 to 80
• Breakout Confirmation: Close + Buffer
• ATR Buffer Multiplier: 0.20 to 0.40
• Retest Window Bars: 8 to 20
• Failure Window Bars: 8 to 20
• Volatility Filter: True
• Volume Filter: True
Daily Equities
• Barrier Mode: Range High/Low or Manual
• Range Lookback Bars: 50 to 100
• Breakout Confirmation: Close Beyond Barrier or Close + Buffer
• ATR Buffer Multiplier: 0.20 to 0.50
• Retest Window Bars: 5 to 20
• Failure Window Bars: 5 to 20
• Volatility Filter: True
• Volume Filter: True
• Bars Per Year: 252
BARRIER MODE GUIDE
━━━━━━━━━━━━━━━━━━━━━━
Range High/Low
This mode calculates the upper and lower barriers from the recent price range.
Best for:
• Breakout trading
• Range expansion setups
• Support and resistance breaks
• Consolidation breakouts
Manual
Manual mode allows the trader to define the upper and lower barriers.
Best for:
• Key technical levels
• Previous day high/low
• Weekly high/low
• Round numbers
• Event levels
• Liquidity zones
Expected Move
Expected Move mode creates volatility-adjusted barriers.
Best for:
• Volatility-based breakout analysis
• Event-risk planning
• Comparing price movement to expected range
• Adaptive barrier levels
CONFIRMATION MODE GUIDE
━━━━━━━━━━━━━━━━━━━━━━
Touch Barrier
This mode triggers as soon as price touches the barrier.
It is the most sensitive setting.
Best for early warning, but it will produce more false signals.
Close Beyond Barrier
This mode requires the candle to close beyond the barrier.
It is more reliable than simple touch logic.
This is a balanced setting.
Close + Buffer
This mode requires price to close beyond the barrier by an additional buffer.
It is the strictest setting.
Best for reducing false breakouts.
RETEST LOGIC GUIDE
━━━━━━━━━━━━━━━━━━━━━━
A retest occurs when price breaks the barrier and then returns to test it.
For bullish breakouts, the upper barrier should ideally act as support.
For bearish breakouts, the lower barrier should ideally act as resistance.
Retest confirmation can help traders avoid chasing the initial breakout candle.
However, not all strong breakouts retest.
A very strong breakout may continue without giving a clean retest.
FAILURE LOGIC GUIDE
━━━━━━━━━━━━━━━━━━━━━━
A breakout failure occurs when price breaks the barrier but then returns back inside the active barrier.
This can be important because failed breakouts often indicate trapped positioning.
A bullish breakout failure can suggest:
• Bull trap
• Liquidity sweep above resistance
• Failed upside continuation
• Potential reversal risk
A bearish breakout failure can suggest:
• Bear trap
• Liquidity sweep below support
• Failed downside continuation
• Potential reversal risk
Failure signals should still be confirmed with price structure and risk management.
HOW TO COMBINE WITH OTHER INDICATORS
━━━━━━━━━━━━━━━━━━━━━━
This indicator works best as part of a broader volatility and market-structure framework.
Useful combinations:
• Expected Move Bands
• Realized Volatility Regime Indicator
• Implied Volatility Proxy
• Delta-Hedging Pressure Proxy
• Dynamic Stop-Loss Using Expected Move
• Risk-Neutral Probability Cone
• VWAP
• Moving averages
• Support and resistance
• Liquidity zones
• Market structure breaks
• Macro and event calendars
Suggested framework:
Expected Move Bands show near-term volatility-adjusted levels.
Realized Volatility Regime shows whether volatility is low, normal, high, or extreme.
IV Proxy shows whether broader uncertainty is rising or cooling.
Delta-Hedging Pressure Proxy shows whether directional pressure is positive or negative.
Dynamic Stop-Loss converts volatility into risk levels.
Risk-Neutral Probability Cone maps forward probability ranges.
Barrier Option-Style Breakout Indicator tracks whether price has activated, confirmed, retested, or failed a breakout barrier.
Together, these tools help answer:
• Where are the breakout levels?
• Has price activated the barrier?
• Is the breakout high quality or weak?
• Has the breakout retested and held?
• Has the breakout failed?
• How far can price reasonably move?
• Where should stops and targets be placed?
• Should position size be reduced?
TRADING EXAMPLES
━━━━━━━━━━━━━━━━━━━━━━
Example 1: Bullish Knock-In
Price breaks above the upper barrier.
The dashboard shows:
• Market State: Bullish Knock-In
• Quality Filter: Pass
• Volatility Percentile: above threshold
• Volume Ratio: above threshold
This suggests that the upside breakout has been activated and supported by quality conditions.
A trader may look for continuation, but should still manage risk carefully.
Example 2: Bullish Retest Confirmed
Price breaks above the upper barrier, then returns to retest the barrier and holds above it.
The dashboard shows:
• Market State: Bullish Retest Confirmed
This is often a stronger continuation setup than the initial breakout candle.
A trader may use the active barrier as a key invalidation reference.
Example 3: Weak Upper Breach
Price moves above the upper barrier, but the quality filter fails.
The dashboard shows:
• Market State: Weak Upper Breach
• Quality Filter: Fail
This suggests caution.
The breakout may not have enough volatility or volume support.
Example 4: Bullish Barrier Failed
Price breaks above the upper barrier but then closes back below the active barrier.
The dashboard shows:
• Market State: Bullish Barrier Failed
This may indicate a bull trap, failed breakout, or liquidity sweep.
A trader should avoid assuming continuation unless price reclaims the barrier.
Example 5: Bearish Retest Confirmed
Price breaks below the lower barrier, then retests the barrier from below and fails to reclaim it.
The dashboard shows:
• Market State: Bearish Retest Confirmed
This suggests downside breakout structure remains valid.
A trader may use the active barrier as a resistance and invalidation reference.
RISK MANAGEMENT NOTES
━━━━━━━━━━━━━━━━━━━━━━
Breakout strategies can suffer from false signals.
This indicator helps reduce that risk by separating:
• Weak breaches
• Confirmed knock-ins
• Retest confirmations
• Failed breakouts
Practical risk rules:
• Do not chase every knock-in candle
• Treat weak breaches with caution
• Wait for retest confirmation if chasing risk is high
• Use failed breakout signals as risk warnings
• Use the active barrier as an invalidation reference
• Reduce size in high-volatility conditions
• Do not rely on volume filters when the asset has poor volume data
• Combine with expected move and dynamic stop tools
A breakout is not automatically valid because price crossed a line.
The path after the breakout matters.
WHAT THIS INDICATOR IS BEST FOR
━━━━━━━━━━━━━━━━━━━━━━
This indicator is best used for:
• Breakout quality assessment
• Range breakout tracking
• Barrier activation logic
• Retest confirmation
• Failed breakout detection
• Liquidity sweep awareness
• Event-level breakout monitoring
• Support and resistance breakout analysis
• Volatility-adjusted breakout levels
• Trade planning and risk management
It is useful for traders who want more structure than a basic support/resistance breakout signal.
WHAT THIS INDICATOR IS NOT
━━━━━━━━━━━━━━━━━━━━━━
This indicator is not:
• A standalone trading strategy
• A guaranteed breakout system
• A buy or sell signal generator
• A true barrier option pricing model
• A full first-passage probability model
• A replacement for risk management
• A replacement for market structure
• A complete trading system
The indicator identifies breakout states.
It does not guarantee continuation.
IMPORTANT LIMITATIONS
━━━━━━━━━━━━━━━━━━━━━━
The indicator uses price, volatility, range, and volume data.
It does not include:
• Order flow
• Market depth
• Dealer positioning
• Options open interest
• Real barrier option pricing
• News sentiment
• Fundamental data
• Liquidity conditions
The probability estimate is simplified.
It is not a full barrier option first-passage model.
Volume quality may differ across markets.
For example:
• FX broker volume is usually tick volume
• Crypto volume depends on exchange feed
• Equities and futures volume are generally more reliable
• Indices may use synthetic or broker-dependent volume
Breakouts can fail even when quality filters pass.
The indicator should be used as a decision-support tool, not as a standalone system.
FINAL NOTES
━━━━━━━━━━━━━━━━━━━━━━
The Barrier Option-Style Breakout Indicator helps traders think about breakouts as path-dependent events.
Instead of asking only whether price crossed a level, the tool helps answer:
• Did price activate the barrier?
• Was the breakout strong or weak?
• Did volatility and volume support the move?
• Did price retest the barrier?
• Did the barrier hold?
• Did the breakout fail?
• Is the active barrier now the key invalidation level?
The indicator is designed to improve breakout discipline, reduce emotional chasing, and provide a structured way to monitor breakout behaviour.
Indikator

Dynamic Stop-Loss Using Expected Move [v1]Dynamic Stop-Loss Using Expected Move
The Dynamic Stop-Loss Using Expected Move indicator is a volatility-aware risk management tool designed to help traders place adaptive stop-loss levels based on the expected price movement of the market.
Instead of using a fixed pip, point, or percentage stop, this indicator estimates how far price could reasonably move over a selected holding period and then converts that expected move into dynamic long and short stop levels.
This is not a buy or sell signal indicator.
It is a risk-management framework designed to answer:
“How far can price reasonably move against my position before the trade thesis is likely invalidated?”
The indicator can be used across FX, crypto, indices, commodities, futures, and liquid stocks.
WHAT THE INDICATOR DOES
━━━━━━━━━━━━━━━━━━━━━━
The indicator calculates a volatility-based expected move over a selected holding period.
It then uses that expected move to build adaptive stop-loss levels for long and short positions.
The basic logic is:
Expected Move = Entry Anchor × Volatility × Square Root of Holding Period
The stop distance is then calculated as:
Stop Distance = Expected Move × Stop Sigma × Volatility Regime Multiplier
For a long position:
Long Stop = Entry Anchor - Stop Distance
For a short position:
Short Stop = Entry Anchor + Stop Distance
This means the stop automatically responds to volatility.
When volatility rises, the stop becomes wider.
When volatility falls, the stop becomes tighter.
WHY THIS INDICATOR IS USEFUL
━━━━━━━━━━━━━━━━━━━━━━
Static stops can be too tight during volatile regimes and too wide during compressed regimes.
This indicator tries to solve that problem by adjusting the stop distance according to current market volatility.
The goal is not to avoid every losing trade.
The goal is to place stops that are more consistent with the current volatility environment.
This can help traders:
• Avoid stops that are too tight during high volatility
• Avoid unnecessarily wide stops during low volatility
• Plan trade risk before entry
• Compare stop distance to expected reward
• Adjust stop logic across different markets and timeframes
• Use volatility as part of position sizing and trade management
MAIN COMPONENTS
━━━━━━━━━━━━━━━━━━━━━━
1. Entry Anchor
The entry anchor is the reference price used to calculate the stop and target levels.
The script allows four anchor modes:
• Close
• Manual
• EMA
• VWAP
Close uses the latest closing price.
Manual allows the trader to enter a specific entry price.
EMA uses a moving average as the anchor.
VWAP uses volume-weighted average price as the anchor.
For pre-trade planning, Manual is often the most precise because it lets the trader set the actual intended entry level.
For live chart context, Close or EMA may be easier to use.
2. Volatility Model
The indicator supports three volatility models:
• Realized Volatility
• ATR Proxy
• Composite
Realized Volatility uses log returns and rolling standard deviation.
ATR Proxy uses average true range as a percentage of price.
Composite blends realized volatility and ATR volatility.
Realized Volatility is cleaner from a statistical perspective.
ATR Proxy is more range-sensitive.
Composite is usually the most practical default because it captures both close-to-close volatility and intrabar range behaviour.
3. Expected Holding Period
The holding period is the number of bars the trader expects to hold the trade.
For example:
• On a 1-hour chart, 20 bars means roughly 20 trading hours
• On a daily chart, 10 bars means roughly 10 trading days
• On a 5-minute chart, 24 bars means roughly 2 trading hours
The holding period matters because expected move increases with time.
Longer holding periods create wider expected moves.
Shorter holding periods create tighter expected moves.
4. Bars Per Year
Bars Per Year is used to annualize and de-annualize volatility correctly.
Suggested settings:
• Daily FX / indices: 252
• Daily crypto: 365
• 1-hour FX: approximately 6240
• 1-hour crypto: approximately 8760
The correct value depends on the asset class and timeframe.
5. Stop Sigma
Stop Sigma controls how much of the expected move is used for the stop distance.
For example:
• 1.0σ means the stop is placed around one expected move away
• 1.5σ means the stop is wider
• 2.0σ means the stop is more defensive
Lower sigma creates tighter stops.
Higher sigma creates wider stops.
6. Volatility Regime Multiplier
The indicator can adjust the stop distance based on the volatility regime.
Default logic:
• Low Vol: tighter stop multiplier
• Normal Vol: standard stop multiplier
• High Vol: wider stop multiplier
• Extreme Vol: widest stop multiplier
This helps prevent the stop from being too tight when volatility is elevated.
7. Stop Mode
The script includes three stop modes:
• Static From Anchor
• Trailing
• Ratchet Only
Static From Anchor keeps the stop based on the selected anchor.
Trailing moves the stop based on the latest price or high/low reference.
Ratchet Only only moves the stop in a favourable direction.
For live trade management, Ratchet Only is usually the most practical because it avoids loosening the stop after it has already tightened.
8. Break-Even Rule
The script includes an optional break-even rule.
When enabled, the stop can move to the entry anchor after price moves a selected number of sigma in favour of the trade.
For example, if the break-even trigger is 1.0σ, the stop will move to break-even after price moves one expected move in the trader’s favour.
This can help protect trades after the market confirms the initial direction.
9. Expected Move Targets
The indicator can also plot expected move targets.
Targets are calculated using the same expected move logic as the stop.
For long positions:
• Long Target 1 is above the entry anchor
• Long Target 2 is further above the entry anchor
For short positions:
• Short Target 1 is below the entry anchor
• Short Target 2 is further below the entry anchor
These targets are not predictions.
They are volatility-adjusted reference levels for planning reward-to-risk.
HOW TO READ THE INDICATOR
━━━━━━━━━━━━━━━━━━━━━━
The indicator plots the following on the price chart:
• Entry Anchor
• Long Dynamic Stop
• Short Dynamic Stop
• Long Target 1
• Long Target 2
• Short Target 1
• Short Target 2
• Forward projected stop and target lines
• Dashboard with volatility and risk metrics
Colour guide:
• White line = Entry Anchor
• Red line = Long Stop
• Green line = Short Stop
• Green upper lines = Long targets
• Red lower lines = Short targets
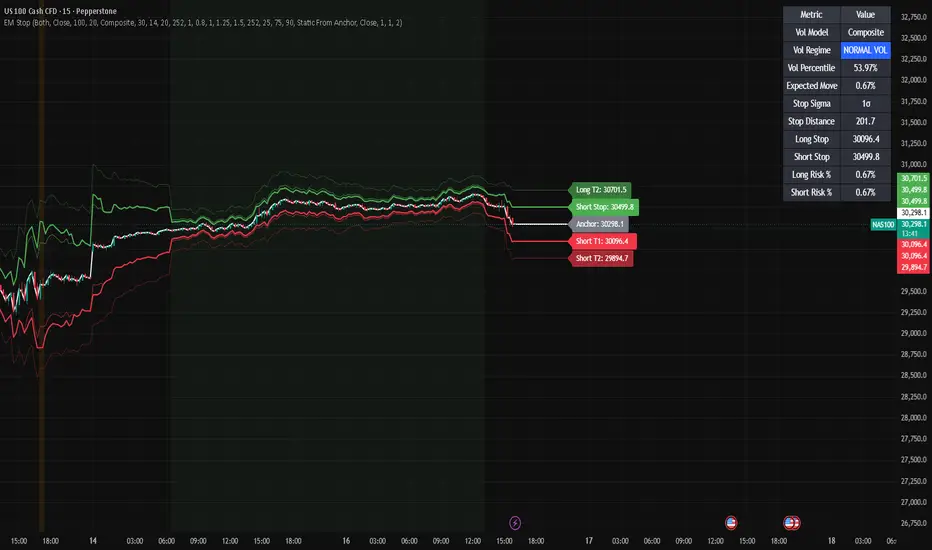
The dashboard shows:
• Volatility Model
• Volatility Regime
• Volatility Percentile
• Expected Move
• Stop Sigma
• Stop Distance
• Long Stop
• Short Stop
• Long Risk %
• Short Risk %
VOLATILITY REGIME INTERPRETATION
━━━━━━━━━━━━━━━━━━━━━━
The indicator classifies volatility into four regimes:
Low Vol
Low volatility means the market is compressed relative to recent history.
In this environment, stops may be tighter because price movement is currently smaller.
However, traders should be aware that low volatility can sometimes precede a breakout.
Normal Vol
Normal volatility means price movement is close to its recent historical range.
This is usually the cleanest environment for standard stop logic.
High Vol
High volatility means price movement is elevated.
In this environment, stops generally need to be wider and position size should usually be smaller.
Tight stops are more likely to be hit during high volatility.
Extreme Vol
Extreme volatility means the market is in a stress or shock regime.
This can happen during economic data releases, central bank decisions, earnings shocks, crypto liquidations, geopolitical events, or major breakouts.
In this environment, traders should be careful with leverage and avoid using normal-volatility stop assumptions.
HOW TO USE THE INDICATOR
━━━━━━━━━━━━━━━━━━━━━━
Use the indicator as a risk engine.
It is designed to help with stop placement, target planning, and trade management.
It should not be used as a standalone entry signal.
The main workflow is:
1. Choose the position mode.
Select Long, Short, or Both.
Use Long if planning a long trade.
Use Short if planning a short trade.
Use Both if comparing both sides.
2. Choose the entry anchor.
Use Manual if you know your exact planned entry price.
Use Close for live chart reference.
Use EMA for a smoother trend-based anchor.
Use VWAP for intraday execution context.
3. Choose the volatility model.
Use Realized Volatility for statistically cleaner expected move calculations.
Use ATR Proxy for a more range-sensitive stop.
Use Composite for a balanced model.
4. Set the expected holding period.
Match this to your trade horizon.
A scalp should use fewer bars.
A swing trade should use more bars.
5. Set the stop sigma.
Use a lower sigma for tighter stops.
Use a higher sigma for wider stops.
Common starting points:
• 1.0σ for tighter tactical stops
• 1.25σ to 1.5σ for balanced stops
• 2.0σ for wider defensive stops
6. Check the volatility regime.
If volatility is high or extreme, the stop will widen if the regime multiplier is enabled.
This helps the stop adapt to the current environment.
7. Compare stop distance to target distance.
Do not only ask whether the stop looks reasonable.
Ask whether the trade still has acceptable reward-to-risk.
8. Use price structure for execution.
The indicator helps with stop placement.
It does not decide trade direction.
Entries should still be based on price action, market structure, trend, support/resistance, liquidity, or macro context.
STOP MODE GUIDE
━━━━━━━━━━━━━━━━━━━━━━
Static From Anchor
This mode keeps the stop based on the selected entry anchor.
Best for:
• Pre-trade planning
• Fixed trade thesis invalidation
• Manual entry planning
• Swing trade risk planning
This mode is clean and stable.
Trailing
This mode recalculates the stop based on the latest price movement.
Best for:
• Active trade management
• Fast-moving markets
• Short-term trading
However, this mode can move the stop both tighter and looser depending on price and volatility.
Ratchet Only
This mode only moves the stop in the trader’s favour.
For long positions, the stop can move higher but not lower.
For short positions, the stop can move lower but not higher.
Best for:
• Live trade management
• Trend-following
• Protecting open profits
• Reducing discretionary stop movement
Ratchet Only is usually the best mode for managing trades after entry.
BREAK-EVEN RULE GUIDE
━━━━━━━━━━━━━━━━━━━━━━
The break-even rule moves the stop to the entry anchor after price has moved a selected number of sigma in favour of the position.
Example:
If Break-Even Trigger is 1.0σ:
• A long trade moves to break-even after price rises by one expected move
• A short trade moves to break-even after price falls by one expected move
This is useful when the trader wants to reduce downside risk after the trade has started working.
However, moving to break-even too early can also stop out good trades before continuation.
A practical setting is usually between 1.0σ and 1.5σ.
SUGGESTED SETTINGS
━━━━━━━━━━━━━━━━━━━━━━
FX 1-Hour
• Position Mode: Long, Short, or Both
• Entry Anchor Mode: Manual or Close
• Volatility Model: Realized Volatility or Composite
• Realized Volatility Lookback: 30 to 50
• ATR Lookback: 14
• Expected Holding Period: 20 to 24
• Bars Per Year: 6240
• Base Stop Sigma: 1.0 to 1.5
• Stop Mode: Static From Anchor or Ratchet Only
Crypto 1-Hour
• Position Mode: Long, Short, or Both
• Entry Anchor Mode: Manual or Close
• Volatility Model: Composite
• Realized Volatility Lookback: 50
• ATR Lookback: 14 to 21
• Expected Holding Period: 24
• Bars Per Year: 8760
• Base Stop Sigma: 1.25 to 2.0
• Stop Mode: Ratchet Only
Daily Equities / Indices
• Position Mode: Long, Short, or Both
• Entry Anchor Mode: Manual or EMA
• EMA Length: 20 or 50
• Volatility Model: Composite
• Realized Volatility Lookback: 20 to 30
• ATR Lookback: 14
• Expected Holding Period: 10 to 20
• Bars Per Year: 252
• Base Stop Sigma: 1.0 to 1.5
• Stop Mode: Ratchet Only
Intraday Indices
• Position Mode: Long, Short, or Both
• Entry Anchor Mode: VWAP, Close, or Manual
• Volatility Model: Composite
• Realized Volatility Lookback: 30 to 50
• ATR Lookback: 14
• Expected Holding Period: 12 to 48
• Bars Per Year: adjust to timeframe
• Base Stop Sigma: 1.25 to 2.0
• Stop Mode: Ratchet Only
PRACTICAL EXAMPLES
━━━━━━━━━━━━━━━━━━━━━━
Example 1: Long Trade Planning
A trader is planning a long EUR/USD trade on the 1-hour chart.
The intended entry is 1.1500.
The indicator estimates a 20-bar expected move of 0.40%.
The stop sigma is set to 1.25σ.
The model calculates a long stop below the entry anchor.
The trader can now compare:
• Entry price
• Dynamic stop
• Long Target 1
• Long Target 2
• Volatility regime
• Risk percentage
If the stop is too wide relative to the target, the trade may not offer attractive reward-to-risk.
Example 2: Short Trade Planning
A trader is planning a short trade after price breaks support.
The trader sets Position Mode to Short.
The script plots a short stop above the entry anchor and downside targets below it.
If volatility is high, the stop will be wider.
This helps avoid placing the stop too close during a fast market.
Example 3: High Volatility Regime
The dashboard shows Extreme Vol.
The model widens the stop using the extreme volatility multiplier.
This does not mean the trade is good or bad.
It means the market requires more room because price movement is elevated.
The trader may respond by:
• Reducing position size
• Waiting for volatility to cool
• Using wider stops
• Avoiding over-leverage
• Reassessing whether the reward justifies the risk
Example 4: Ratchet Stop Management
A trader enters a long position and selects Ratchet Only mode.
As price rises, the stop moves higher.
If price falls, the stop does not move lower.
This allows the trader to protect open profits while still using volatility-adjusted stop logic.
RISK MANAGEMENT NOTES
━━━━━━━━━━━━━━━━━━━━━━
This indicator is most useful when combined with disciplined position sizing.
A wider volatility stop does not mean taking more risk.
It usually means reducing position size so that the cash risk remains controlled.
For example:
If the stop distance doubles, position size should generally be reduced by half to keep the same account risk.
Practical risk rules:
• Define account risk before using the stop
• Do not widen stops without reducing size
• Avoid using tight stops in high-volatility regimes
• Avoid using very wide stops without sufficient reward potential
• Use the stop as invalidation, not as a random distance
• Do not treat target levels as guaranteed price forecasts
HOW TO COMBINE WITH OTHER INDICATORS
━━━━━━━━━━━━━━━━━━━━━━
This indicator works best as part of a broader volatility and market-structure framework.
Useful combinations:
• Expected Move Bands
• Realized Volatility Regime Indicator
• Implied Volatility Proxy
• Delta-Hedging Pressure Proxy
• VWAP
• Moving averages
• Support and resistance
• Liquidity zones
• Market structure breaks
• Macro and event calendars
Suggested framework:
Expected Move Bands show where price may reasonably move.
Realized Volatility Regime shows whether volatility is low, normal, high, or extreme.
IV Proxy shows whether broader uncertainty is rising or cooling.
Delta-Hedging Pressure Proxy shows whether directional pressure is positive or negative.
Dynamic Stop-Loss Using Expected Move converts volatility into actionable risk levels.
Together, these tools help answer:
• How far can price move?
• What volatility regime are we in?
• Is uncertainty rising or cooling?
• Is directional pressure positive or negative?
• Where should the stop be placed?
• Is the reward-to-risk acceptable?
• Should position size be reduced?
WHAT THIS INDICATOR IS BEST FOR
━━━━━━━━━━━━━━━━━━━━━━
This indicator is best used for:
• Volatility-adjusted stop placement
• Trade risk planning
• Expected move-based target planning
• Position management
• Stop distance calibration
• Risk percentage monitoring
• High-volatility regime adjustment
• Avoiding random stop placement
• Improving reward-to-risk discipline
It is useful for traders who want stop placement to be linked to market conditions instead of fixed distances.
WHAT THIS INDICATOR IS NOT
━━━━━━━━━━━━━━━━━━━━━━
This indicator is not:
• A buy or sell signal generator
• A standalone trading strategy
• A guarantee that the stop will not be hit
• A prediction model
• A replacement for position sizing
• A replacement for market structure
• A complete trading system
The indicator tells you where a volatility-adjusted stop may be placed.
It does not tell you whether the trade should be entered.
IMPORTANT LIMITATIONS
━━━━━━━━━━━━━━━━━━━━━━
The indicator uses historical volatility and range behaviour.
It does not know future volatility.
Volatility can change rapidly after:
• Economic data releases
• Central bank decisions
• Earnings reports
• Geopolitical events
• Liquidity shocks
• Market opens and closes
• Crypto liquidation cascades
• Sudden order-flow imbalance
The indicator does not include:
• Options implied volatility
• Order flow
• Market depth
• Positioning data
• News sentiment
• Fundamental data
• Liquidity conditions
A volatility-based stop can still be hit during a normal adverse move.
It should be used with position sizing, trade invalidation logic, and market structure.
FINAL NOTES
━━━━━━━━━━━━━━━━━━━━━━
The Dynamic Stop-Loss Using Expected Move indicator helps traders convert volatility into practical risk levels.
Instead of asking only where support or resistance is, this tool helps answer:
• How far can price reasonably move against me?
• Is my stop too tight for current volatility?
• Is my stop too wide for the expected reward?
• Should my position size be reduced?
• Should the stop trail or stay fixed?
• Has volatility changed enough to alter my risk assumptions?
The indicator is designed to improve trade planning, stop discipline, and volatility-aware risk management.
Indikator

Delta-Hedging Pressure Proxy [v1]The Delta-Hedging Pressure Proxy is designed to estimate potential directional hedging pressure using price movement, volatility, synthetic option sensitivity, volume pressure, and volatility expansion.
This indicator does not use real dealer positioning, live options-chain data, gamma exposure, open interest, or institutional hedge-book data.
Instead, it builds a practical proxy that attempts to answer:
“Is the market behaving as if buy-side or sell-side hedging pressure is increasing?”
The indicator is intended for traders who want to understand when price action may be moving through a hedging-pressure environment, especially during fast directional moves, breakouts, volatility shocks, or post-shock cooling phases.
It can be used across FX, crypto, indices, commodities, futures, and liquid stocks.
IMPORTANT NOTE
━━━━━━━━━━━━━━━━━━━━━━
This is not real dealer hedging data.
True dealer hedging analysis requires options-chain data, strike-level open interest, implied volatility, gamma exposure, dealer positioning assumptions, expiry profiles, and sometimes intraday flow data.
TradingView does not provide all of that information across most markets.
This script therefore uses a synthetic model based on:
• Black-Scholes-style delta and gamma logic
• Realized volatility
• Synthetic strike reference
• Price movement
• Volume pressure
• Volatility expansion
• Percentile ranking
The result is a directional hedging-pressure proxy.
It should be used as a market-context tool, not as a standalone trading system.
WHAT THE INDICATOR MEASURES
━━━━━━━━━━━━━━━━━━━━━━
The indicator estimates whether recent price movement, synthetic option sensitivity, volume, and volatility expansion are creating conditions that resemble buy-side or sell-side hedging pressure.
The main output is the Delta-Hedging Pressure Score.
The score moves between negative and positive values.
Positive values suggest buy-side hedging pressure.
Negative values suggest sell-side hedging pressure.
The stronger the absolute value, the more elevated the pressure regime.
General interpretation:
• Above +75: High buy-hedging pressure
• Above +90: Extreme buy-hedging pressure
• Between -25 and +25: Low or neutral pressure
• Below -75: High sell-hedging pressure
• Below -90: Extreme sell-hedging pressure
MAIN COMPONENTS
━━━━━━━━━━━━━━━━━━━━━━
1. Synthetic Strike
The script needs a strike reference to estimate synthetic option sensitivity.
Users can select:
• ATM
• Manual
• EMA
ATM uses the current close as the synthetic strike.
Manual allows the user to enter a custom strike.
EMA uses a moving average as the synthetic strike reference.
ATM is generally best for short-term intraday analysis.
EMA can be useful for broader swing-trading context.
Manual can be useful if the trader wants to analyse a specific key price level.
2. Synthetic Option Type
The user can select either Call or Put.
This changes the synthetic delta calculation.
Call mode is usually easier to interpret for directional upside pressure.
Put mode can be useful when analysing downside hedging pressure or bearish risk conditions.
3. Realized Volatility
The script calculates realized volatility from log returns.
This volatility is used as the volatility input for the synthetic Black-Scholes-style delta and gamma calculations.
Higher volatility changes the sensitivity of the synthetic option model.
4. Synthetic Delta
Delta measures how sensitive an option’s value is to price movement.
In this proxy, delta helps estimate the directional exposure of the synthetic option reference.
A higher call delta means the synthetic option is behaving more like the underlying asset.
A lower call delta means the synthetic option is less sensitive to price movement.
5. Gamma Proxy
Gamma measures how quickly delta changes when price moves.
This is important because hedging pressure is often linked to changes in delta.
When gamma is elevated, a small move in price can create a larger change in delta.
This can increase the need for hedging activity in real options markets.
In this script, gamma is used as a pressure amplifier.
6. Price Impulse
The script measures the latest price change.
Price movement is necessary for the pressure model because delta changes when price moves.
A strong upward price impulse can contribute to buy-pressure conditions.
A strong downward price impulse can contribute to sell-pressure conditions.
7. Volume Pressure
The script compares current volume to average volume.
When volume is elevated, the model assumes that pressure conditions may be more meaningful.
If volume is low, the pressure signal is less convincing.
Users can switch volume pressure on or off.
8. Volatility Expansion Pressure
The script checks whether realized volatility is expanding relative to its recent average.
If volatility is expanding, the model increases the importance of the pressure reading.
This is useful because hedging pressure is more relevant during active or fast-moving markets than during quiet ranges.
9. Pressure Percentile
The raw pressure value is converted into a percentile rank.
This makes the output easier to interpret across different assets and timeframes.
The indicator does not only ask whether pressure is high in absolute terms.
It asks whether current pressure is high relative to the instrument’s own recent history.
HOW THE PRESSURE SCORE WORKS
━━━━━━━━━━━━━━━━━━━━━━
The script estimates pressure using the following logic:
Synthetic delta change is approximated using gamma and price movement.
That pressure is then adjusted by volume pressure and volatility expansion pressure.
The result is normalized using percentile ranking.
The final score is directional:
• Positive pressure = buy-side hedging pressure
• Negative pressure = sell-side hedging pressure
• Larger absolute value = stronger pressure regime
The score can also be smoothed to reduce noise.
HOW TO READ THE INDICATOR
━━━━━━━━━━━━━━━━━━━━━━
The main line is the Delta-Hedging Pressure Score.
Positive readings indicate buy-pressure conditions.
Negative readings indicate sell-pressure conditions.
The zero line is the neutral boundary.
Colour guide:
• Grey = Low or neutral pressure
• Blue or purple = Normal pressure
• Green = High buy pressure
• Lime = Extreme buy pressure
• Red = High sell pressure
• Maroon = Extreme sell pressure
The dashboard shows:
• Pressure Regime
• Pressure Score
• Market State
• Direction
• Synthetic Strike
• Synthetic Delta
• Gamma Proxy
• Volume Factor
• Vol Expansion
• Regime Score
Regime Score:
• 1 = Low Pressure
• 2 = Normal Pressure
• 3 = High Pressure
• 4 = Extreme Pressure
PRESSURE REGIMES
━━━━━━━━━━━━━━━━━━━━━━
Low Pressure
Low Pressure means the score is close to zero.
This suggests that the model is not detecting meaningful directional hedging pressure.
Common interpretation:
• Market may be balanced
• Pressure signal is weak
• Price action should take priority
• Avoid over-interpreting small movements
Normal Pressure
Normal Pressure means the indicator is detecting some directional pressure, but not enough to classify it as high or extreme.
Common interpretation:
• Directional pressure may be present
• Confirmation is needed from price structure
• Use with trend, support/resistance, or volatility tools
High Buy Pressure
High Buy Pressure means the score is above the high-pressure threshold.
This suggests the model is detecting strong upside pressure conditions.
Possible interpretation:
• Upside momentum may be active
• Buy-side hedging pressure may be reinforcing the move
• Breakouts may have better continuation potential
• Fading the move too early may be risky
High Sell Pressure
High Sell Pressure means the score is below the negative high-pressure threshold.
This suggests the model is detecting strong downside pressure conditions.
Possible interpretation:
• Downside momentum may be active
• Sell-side hedging pressure may be reinforcing the move
• Breakdowns may have better continuation potential
• Catching the falling knife may be risky
Extreme Buy Pressure
Extreme Buy Pressure means the score is above the extreme-pressure threshold.
This may indicate a buy-side pressure shock.
Possible interpretation:
• Strong upside repricing
• Breakout acceleration
• Stop-run or short squeeze conditions
• Momentum chase risk is elevated
• Risk controls should be tightened
Extreme Sell Pressure
Extreme Sell Pressure means the score is below the negative extreme-pressure threshold.
This may indicate a sell-side pressure shock.
Possible interpretation:
• Strong downside repricing
• Breakdown acceleration
• Long liquidation or stop cascade
• Panic selling conditions may be present
• Risk controls should be tightened
MARKET STATE DEFINITIONS
━━━━━━━━━━━━━━━━━━━━━━
Buy Hedge Expansion
Buy Hedge Expansion occurs when positive pressure is high and increasing.
This suggests upside pressure may be strengthening.
Traders may use this as confirmation that bullish momentum is being supported by pressure conditions.
Sell Hedge Expansion
Sell Hedge Expansion occurs when negative pressure is high and increasing.
This suggests downside pressure may be strengthening.
Traders may use this as confirmation that bearish momentum is being supported by pressure conditions.
Buy Hedge Shock
Buy Hedge Shock occurs when positive pressure is extreme and still increasing.
This is a high-risk upside momentum environment.
It may occur during sharp breakouts, squeeze-like moves, major news repricing, or aggressive upside continuation.
Sell Hedge Shock
Sell Hedge Shock occurs when negative pressure is extreme and still increasing.
This is a high-risk downside momentum environment.
It may occur during sharp breakdowns, liquidation events, major news repricing, or aggressive downside continuation.
Pressure Compression
Pressure Compression occurs when pressure is low and cooling.
This suggests that directional hedging pressure is weak or fading.
It can be useful when identifying quieter conditions before the next expansion phase.
Pressure Cooling
Pressure Cooling occurs when pressure was elevated but is now declining.
This may suggest that a pressure-driven move is losing force.
Cooling is not a reversal signal by itself.
It simply means the pressure phase may be easing.
Neutral
Neutral means no major pressure condition is active.
During neutral conditions, traders should rely more on price structure, trend, support/resistance, liquidity zones, or volatility context.
HOW TO USE THE INDICATOR
━━━━━━━━━━━━━━━━━━━━━━
Use the Delta-Hedging Pressure Proxy as a directional pressure filter.
It is best used to answer:
• Is pressure positive or negative?
• Is the pressure weak, high, or extreme?
• Is pressure increasing or cooling?
• Is the move supported by volume and volatility expansion?
• Should I avoid fading the move too early?
• Is the market entering a pressure shock?
It should not be used alone for entries.
The indicator provides context, not a full trade signal.
PRACTICAL TRADING WORKFLOW
━━━━━━━━━━━━━━━━━━━━━━
1. Check the Pressure Score.
Positive means buy-pressure conditions.
Negative means sell-pressure conditions.
2. Check the Pressure Regime.
Low, Normal, High, or Extreme.
3. Check Market State.
Look for Buy Hedge Expansion, Sell Hedge Expansion, Buy Hedge Shock, Sell Hedge Shock, Pressure Cooling, or Neutral.
4. Compare with price structure.
Pressure is more useful when it aligns with market structure.
For example:
• Buy pressure above resistance can support bullish breakout continuation
• Sell pressure below support can support bearish breakdown continuation
• Pressure cooling after an extended move can support an exhaustion watchlist
5. Adjust risk.
High and extreme pressure conditions are not low-risk environments.
They can offer continuation potential, but stops usually need to account for wider movement.
As pressure and volatility rise, position size should generally fall.
6. Avoid automatic reversals.
Extreme buy pressure does not mean sell.
Extreme sell pressure does not mean buy.
Extreme pressure often means the move is dangerous to fade until there is clear structural confirmation.
SUGGESTED SETTINGS
━━━━━━━━━━━━━━━━━━━━━━
FX 1-Hour
• Synthetic Strike Mode: ATM
• Option Type: Call
• Horizon Bars: 20
• Bars Per Year: 6240
• Vol Lookback: 30 to 50
• Percentile Lookback: 252
• Use Volume Pressure: True
• Use Vol Expansion: True
• Smooth Pressure Score: True
• Smoothing Length: 5
Crypto 1-Hour
• Synthetic Strike Mode: ATM
• Horizon Bars: 24
• Bars Per Year: 8760
• Vol Lookback: 50
• Percentile Lookback: 500
• Use Volume Pressure: True
• Use Vol Expansion: True
• Smooth Pressure Score: True
• Smoothing Length: 5 to 10
Daily Equities / Indices
• Synthetic Strike Mode: EMA
• EMA Strike Length: 50
• Horizon Bars: 20
• Bars Per Year: 252
• Vol Lookback: 20 to 30
• Percentile Lookback: 252
• Use Volume Pressure: True
• Use Vol Expansion: True
• Smooth Pressure Score: True
• Smoothing Length: 3 to 5
Intraday Indices
• Synthetic Strike Mode: ATM or EMA
• EMA Strike Length: 20 to 50
• Horizon Bars: 12 to 48
• Bars Per Year: adjust to timeframe
• Vol Lookback: 30 to 50
• Percentile Lookback: 252
• Use Volume Pressure: True
• Use Vol Expansion: True
SYNTHETIC STRIKE MODE GUIDE
━━━━━━━━━━━━━━━━━━━━━━
ATM
ATM uses the current close as the synthetic strike.
Best for:
• Short-term analysis
• Intraday pressure readings
• Current-market sensitivity
• Fast-moving markets
Manual
Manual allows the user to enter a custom strike.
Best for:
• Analysing a known options strike
• Testing pressure around a major price level
• Event-risk scenarios
• Key round numbers
EMA
EMA uses a moving average as the synthetic strike.
Best for:
• Swing trading
• Trend context
• Broader pressure analysis
• Smoother signals
OPTION TYPE GUIDE
━━━━━━━━━━━━━━━━━━━━━━
Call Mode
Call mode is generally better for analysing upside pressure.
Use it when you want to study bullish momentum, upside breakouts, or buy-side pressure.
Put Mode
Put mode is useful for analysing downside pressure.
Use it when you want to study bearish momentum, downside breaks, or sell-side risk.
For most general use, Call mode with ATM strike is a clean starting point.
HOW TO COMBINE WITH OTHER INDICATORS
━━━━━━━━━━━━━━━━━━━━━━
This indicator works best when combined with a broader volatility and market-structure framework.
Useful combinations:
• Expected Move Bands
• Realized Volatility Regime Indicator
• Implied Volatility Proxy
• VWAP
• Moving averages
• Support and resistance
• Liquidity zones
• Market structure breaks
• Macro and event calendars
Suggested framework:
Expected Move Bands show where price may reasonably move.
Realized Volatility Regime shows whether the market is calm, normal, active, or stressed.
IV Proxy shows whether broader uncertainty is rising or cooling.
Delta-Hedging Pressure Proxy shows whether directional pressure is leaning buy-side or sell-side.
Together, these tools help answer:
• How far can price move?
• What volatility regime are we in?
• Is uncertainty rising or cooling?
• Is directional pressure positive or negative?
• Should I trade, reduce size, wait, or avoid fading?
TRADING EXAMPLES
━━━━━━━━━━━━━━━━━━━━━━
Example 1: Buy Pressure Breakout
If the dashboard shows:
• Pressure Regime: High Buy Pressure
• Pressure Score: above +75
• Market State: Buy Hedge Expansion
• Price is breaking above resistance
This suggests upside pressure may be supporting the breakout.
A trader may look for continuation setups, pullback entries, or confirmation above the breakout level.
Example 2: Sell Pressure Breakdown
If the dashboard shows:
• Pressure Regime: High Sell Pressure
• Pressure Score: below -75
• Market State: Sell Hedge Expansion
• Price is breaking below support
This suggests downside pressure may be supporting the breakdown.
A trader may avoid catching the falling knife and instead wait for continuation or failed-retest setups.
Example 3: Buy Hedge Shock
If the dashboard shows:
• Pressure Regime: Extreme Buy Pressure
• Pressure Score: above +90
• Market State: Buy Hedge Shock
This suggests upside pressure is extreme.
The market may continue squeezing higher, but risk is elevated.
A trader should avoid over-leverage, avoid poor entries after vertical candles, and wait for structure.
Example 4: Sell Hedge Shock
If the dashboard shows:
• Pressure Regime: Extreme Sell Pressure
• Pressure Score: below -90
• Market State: Sell Hedge Shock
This suggests downside pressure is extreme.
The market may be in liquidation, panic, or aggressive repricing mode.
A trader should avoid blind dip-buying until there is evidence of stabilization.
Example 5: Pressure Cooling
If the dashboard shows:
• Pressure Regime: High or Extreme Pressure
• Direction: Falling
• Market State: Pressure Cooling
This means pressure remains elevated but is starting to fade.
A trader may monitor for failed continuation, market-structure shifts, re-entry into a range, or exhaustion setups.
Cooling is not a reversal signal by itself.
RISK MANAGEMENT NOTES
━━━━━━━━━━━━━━━━━━━━━━
This indicator is especially useful for avoiding poor trade location.
Possible applications:
• Avoid fading strong moves during pressure expansion
• Reduce position size during high or extreme pressure
• Avoid tight stops during pressure shocks
• Wait for cooling before considering mean reversion
• Use pressure alignment to confirm breakouts or breakdowns
• Use price structure, not pressure alone, for entries
• Avoid treating extreme readings as automatic reversal signals
A practical rule:
When pressure and volatility rise together, position size should generally fall.
WHAT THIS INDICATOR IS BEST FOR
━━━━━━━━━━━━━━━━━━━━━━
This indicator is best used for:
• Directional pressure context
• Breakout confirmation
• Breakdown confirmation
• Momentum continuation filtering
• Hedging-pressure approximation
• Volatility shock awareness
• Risk management
• Avoiding premature fade trades
• Trade sizing context
It is most useful when combined with price action, market structure, volatility regime, expected move levels, and macro or event awareness.
WHAT THIS INDICATOR IS NOT
━━━━━━━━━━━━━━━━━━━━━━
This indicator is not:
• Real dealer positioning
• Real options open interest analysis
• Real gamma exposure
• A dealer gamma model
• A volatility surface model
• A skew or term structure model
• A standalone trading strategy
• A buy or sell signal generator
• A guarantee of future price direction
• A replacement for risk management
The indicator estimates pressure conditions. It does not predict price direction by itself.
IMPORTANT LIMITATIONS
━━━━━━━━━━━━━━━━━━━━━━
The indicator uses price, volume, realized volatility, and synthetic option sensitivity.
It does not include:
• Real options-chain implied volatility
• Strike-level open interest
• Dealer inventory
• Market maker positioning
• Options expiry effects
• Dealer gamma exposure
• Skew
• Term structure
• Order flow
• Market depth
• News sentiment
• Fundamental data
Volume quality can also differ by asset class.
For example, centralized exchange crypto volume may behave differently from FX tick volume or futures volume.
The indicator should be treated as a pressure proxy, not a source of confirmed institutional positioning.
FINAL NOTES
━━━━━━━━━━━━━━━━━━━━━━
The Delta-Hedging Pressure Proxy helps traders think in terms of directional pressure, volatility, and risk.
Instead of asking only whether price is bullish or bearish, this tool helps answer:
• Is directional pressure positive or negative?
• Is pressure weak, high, or extreme?
• Is pressure increasing or cooling?
• Is price movement supported by volume and volatility expansion?
• Is the market in a pressure shock?
• Should I avoid fading the move too early?
• Should I reduce size or wait for structure?
The indicator is designed to improve market context, risk discipline, and volatility-aware decision making.
Indikator

Implied Volatility Proxy Indicator [v1]Implied Volatility Proxy Indicator
The Implied Volatility Proxy Indicator is designed to estimate market uncertainty when true options-chain implied volatility data is not available.
This indicator does not use real implied volatility from listed options. Instead, it creates an IV-style proxy using a composite score built from realized volatility, ATR volatility, range expansion, volatility compression, and percentile ranking.
The goal is to help traders understand whether the market is behaving as if forward uncertainty is rising, falling, compressed, or entering a shock regime.
This is not a buy or sell signal indicator. It is a volatility and uncertainty regime tool.
It can be used across FX, crypto, indices, commodities, futures, and liquid stocks.
WHAT THE INDICATOR MEASURES
━━━━━━━━━━━━━━━━━━━━━━
True implied volatility comes from option prices and reflects the market’s expectation of future volatility.
However, many TradingView instruments do not provide clean or accessible options-chain implied volatility.
This indicator solves that problem by building a practical proxy from price behaviour.
It asks:
“Is the market behaving as if uncertainty is rising or falling?”
To answer that, the script combines three main components:
• Realized volatility
• ATR volatility
• Range expansion
Each component is converted into a percentile rank, then blended into a single IV Proxy Score from 0 to 100.
MAIN COMPONENTS
━━━━━━━━━━━━━━━━━━━━━━
1. Realized Volatility Component
Realized volatility measures how much price has actually moved over a selected lookback period.
The script calculates log returns and then applies a rolling standard deviation.
Higher realized volatility means price has been moving more aggressively.
Lower realized volatility means price has been more compressed.
2. ATR Volatility Component
ATR measures the average trading range of the asset.
The script converts ATR into a percentage of price and annualizes it using the selected Bars Per Year input.
This helps capture broader range-based volatility that may not be fully reflected in close-to-close returns.
3. Range Expansion Component
Range expansion measures whether the current candle range is large relative to its recent average range.
This helps identify sudden bursts in price movement.
A large current candle range compared to recent range may indicate a volatility impulse, stop-run, news repricing, liquidation event, or breakout attempt.
4. Percentile Ranking
Each component is ranked against its own recent history.
The indicator does not simply ask whether volatility is high in absolute terms.
It asks whether volatility is high relative to the instrument’s own recent behaviour.
This makes the indicator more adaptive across different assets.
5. Composite IV Proxy Score
The final IV Proxy Score is a weighted blend of the three component percentiles.
Default weighting:
• Realized Volatility: 40%
• ATR Volatility: 30%
• Range Expansion: 30%
Users can adjust these weights in the settings.
WHAT THE IV PROXY SCORE MEANS
━━━━━━━━━━━━━━━━━━━━━━
The IV Proxy Score ranges from 0 to 100.
General interpretation:
• 0–25: Low IV Proxy
• 25–75: Normal IV Proxy
• 75–90: High IV Proxy
• 90–100: Extreme IV Proxy
A low score suggests compressed uncertainty.
A high score suggests elevated uncertainty.
An extreme score suggests shock-like market conditions.
IMPORTANT NOTE
━━━━━━━━━━━━━━━━━━━━━━
This is not true options implied volatility.
It is a price-derived proxy designed to approximate uncertainty regimes when actual implied volatility data is unavailable.
It should not be used as a substitute for options-chain IV, skew, term structure, dealer gamma, or volatility surface analysis.
It is best used as a practical trading filter for volatility-sensitive decision making.
HOW TO READ THE INDICATOR
━━━━━━━━━━━━━━━━━━━━━━
The main plotted line is the IV Proxy Score.
The line changes colour depending on the regime.
Colour guide:
• Green = Low IV Proxy
• Blue = Normal IV Proxy
• Orange = High IV Proxy
• Red = Extreme IV Proxy
The dashboard shows:
• IV Proxy Regime
• IV Proxy Score
• IV Direction
• Market State
• Realized Volatility Component
• ATR Component
• Range Expansion Component
• Regime Score
Regime Score:
• 1 = Low IV Proxy
• 2 = Normal IV Proxy
• 3 = High IV Proxy
• 4 = Extreme IV Proxy
IV PROXY REGIMES
━━━━━━━━━━━━━━━━━━━━━━
Low IV Proxy
Low IV Proxy means the market is relatively compressed.
This can suggest:
• Lower price movement
• Narrower trading ranges
• Reduced uncertainty
• Potential breakout risk building
Low IV Proxy does not forecast direction. It only indicates that uncertainty is low relative to recent history.
Common use cases:
• Prepare for breakout setups
• Watch key support and resistance
• Avoid over-targeting trades
• Wait for volatility expansion confirmation
Normal IV Proxy
Normal IV Proxy means uncertainty is balanced relative to recent history.
This is usually a cleaner environment for normal trade execution.
Common use cases:
• Standard trade sizing
• Normal technical analysis
• Trend or range trading depending on price structure
• Standard stop and target logic
High IV Proxy
High IV Proxy means uncertainty is elevated.
This can indicate that the market is becoming more active and riskier.
Common use cases:
• Reduce position size
• Use wider stops if trading
• Avoid tight entries
• Favour momentum continuation if the score is rising
• Avoid fading strong moves too early
Extreme IV Proxy
Extreme IV Proxy means the market is in a stress or shock-like uncertainty regime.
This can appear during:
• Economic data releases
• Central bank decisions
• Earnings shocks
• Geopolitical events
• Crypto liquidation cascades
• Major breakouts or breakdowns
• Panic repricing
• Liquidity shocks
Common use cases:
• Reduce exposure
• Avoid over-leverage
• Avoid chasing large candles
• Wait for stabilization
• Watch for cooling before considering reversal trades
Extreme IV Proxy is not automatically a reversal signal. Markets can remain extreme for longer than expected.
MARKET STATE DEFINITIONS
━━━━━━━━━━━━━━━━━━━━━━
IV Compression
IV Compression occurs when the IV Proxy Score is low and still falling.
This may indicate that the market is becoming increasingly quiet.
Compression can be useful for preparing breakout alerts, but it does not predict direction.
Use compression as a preparation signal, not a trade entry signal.
IV Expansion
IV Expansion occurs when the IV Proxy Score is high and rising.
This suggests that uncertainty is increasing.
Expansion may support:
• Breakouts
• Momentum continuation
• Wider expected ranges
• Higher-risk trade conditions
In IV Expansion, traders should be careful about fading strong directional moves too early.
IV Shock
IV Shock occurs when the IV Proxy Score is extreme and still rising.
This is the highest-risk state.
It may indicate:
• News repricing
• Panic movement
• Liquidation pressure
• Stop cascades
• Forced positioning adjustment
• Macro repricing
• Major volatility impulse
During IV Shock conditions, risk management should take priority.
IV Cooling
IV Cooling occurs when the IV Proxy Score is high or extreme but falling.
This suggests that uncertainty remains elevated, but pressure is starting to ease.
Cooling is not a reversal signal by itself.
It may support monitoring for:
• Failed continuation
• Re-entry after an extreme move
• Mean-reversion confirmation
• Break of short-term structure
• Return inside a prior range
Neutral
Neutral means no major uncertainty condition is active.
In this state, traders should rely more heavily on price structure, trend, support/resistance, liquidity levels, and standard trade rules.
HOW TO USE THE INDICATOR
━━━━━━━━━━━━━━━━━━━━━━
Use the indicator as an uncertainty and volatility filter.
The main purpose is to help decide whether current market conditions favour:
• Breakout preparation
• Normal trading
• Momentum continuation
• Defensive risk management
• Cooling or exhaustion monitoring
The indicator should not be used alone for trade entries.
It tells you about the volatility environment, not price direction.
PRACTICAL TRADING WORKFLOW
━━━━━━━━━━━━━━━━━━━━━━
1. Check the IV Proxy Regime.
Determine whether the market is in Low, Normal, High, or Extreme IV Proxy.
2. Check IV Direction.
Is the score rising, falling, or flat?
3. Check Market State.
The dashboard will classify the environment as Compression, Expansion, IV Shock, Cooling, or Neutral.
4. Match the strategy to the regime.
Low and falling IV Proxy may favour breakout preparation.
High and rising IV Proxy may favour momentum continuation.
Extreme and rising IV Proxy may require defensive risk management.
High or extreme but falling IV Proxy may support watching for failed continuation or exhaustion.
5. Adjust risk.
As uncertainty rises, position size should generally fall.
High uncertainty regimes usually require wider stops and smaller size.
6. Use price structure for execution.
Do not enter trades from the IV Proxy alone.
Use trend, support/resistance, liquidity, market structure, expected move levels, or macro context for actual entries.
SUGGESTED SETTINGS
━━━━━━━━━━━━━━━━━━━━━━
FX 1-Hour
• Realized Volatility Lookback: 30 to 50
• ATR Lookback: 14
• Range Lookback: 20
• Percentile Lookback: 252
• Bars Per Year: 6240
• Smooth Proxy Score: True
• Smoothing Length: 5
Daily FX / Indices
• Realized Volatility Lookback: 20 to 30
• ATR Lookback: 14
• Range Lookback: 20
• Percentile Lookback: 252
• Bars Per Year: 252
• Smooth Proxy Score: True
• Smoothing Length: 3 to 5
Crypto 1-Hour
• Realized Volatility Lookback: 50
• ATR Lookback: 14 to 21
• Range Lookback: 20 to 30
• Percentile Lookback: 500
• Bars Per Year: 8760
• Smooth Proxy Score: True
• Smoothing Length: 5 to 10
Daily Crypto
• Realized Volatility Lookback: 20 to 30
• ATR Lookback: 14
• Range Lookback: 20
• Percentile Lookback: 365
• Bars Per Year: 365
• Smooth Proxy Score: True
• Smoothing Length: 3 to 5
COMPONENT WEIGHTING
━━━━━━━━━━━━━━━━━━━━━━
The default weighting is:
• Realized Volatility Weight: 40%
• ATR Volatility Weight: 30%
• Range Expansion Weight: 30%
These can be adjusted.
A trader who wants a smoother proxy can increase the realized volatility weight.
A trader who wants a more reactive proxy can increase the range expansion weight.
A trader who wants a broader range-based volatility measure can increase the ATR weight.
Suggested use:
• More stable markets: increase realized volatility weight
• Intraday breakout trading: increase range expansion weight
• Trend and swing trading: keep balanced weights
• Crypto: consider slightly higher ATR and range weights
HOW THIS DIFFERS FROM REALIZED VOLATILITY
━━━━━━━━━━━━━━━━━━━━━━
A realized volatility indicator only measures how much price has moved based on returns.
The IV Proxy Indicator blends several sources of volatility behaviour:
• Close-to-close realized volatility
• Range-based volatility through ATR
• Current candle range expansion
This makes it more sensitive to market uncertainty and sudden repricing.
It is not better in every case. It is simply broader.
Realized volatility is cleaner and more statistically direct.
The IV Proxy is more practical and responsive for discretionary trading context.
HOW TO COMBINE WITH OTHER INDICATORS
━━━━━━━━━━━━━━━━━━━━━━
This indicator pairs well with:
• Expected Move Bands
• Realized Volatility Regime Indicator
• VWAP
• Moving averages
• Market structure tools
• Support and resistance
• Liquidity levels
• Macro/event calendars
Suggested framework:
Expected Move Bands show where price may reasonably move.
Realized Volatility Regime shows the current volatility environment.
IV Proxy shows whether forward uncertainty appears to be rising or falling.
Together, they help answer:
• How far can price move?
• What volatility regime are we in?
• Is uncertainty rising or cooling?
• Should I trade normally, reduce size, or wait?
TRADING EXAMPLES
━━━━━━━━━━━━━━━━━━━━━━
Example 1: Low IV Proxy Compression
If the dashboard shows:
• IV Proxy Regime: Low IV Proxy
• IV Direction: Falling
• Market State: IV Compression
This means uncertainty is compressed.
A trader may prepare breakout alerts above resistance and below support, but should wait for price confirmation.
Example 2: High IV Proxy Expansion
If the dashboard shows:
• IV Proxy Regime: High IV Proxy
• IV Direction: Rising
• Market State: IV Expansion
This means uncertainty is rising.
A trader may favour momentum continuation, avoid tight stops, and avoid fading strong moves too early.
Example 3: Extreme IV Proxy Shock
If the dashboard shows:
• IV Proxy Regime: Extreme IV Proxy
• IV Direction: Rising
• Market State: IV Shock
This means the market is in a stress or shock environment.
A trader may reduce exposure, avoid leverage, and wait for stabilization before entering new trades.
Example 4: Extreme IV Proxy Cooling
If the dashboard shows:
• IV Proxy Regime: Extreme IV Proxy
• IV Direction: Falling
• Market State: IV Cooling
This means uncertainty remains elevated, but pressure is starting to ease.
A trader may monitor for failed continuation, re-entry after an extreme move, or mean-reversion confirmation.
Cooling is not a buy or sell signal. It is a warning that the uncertainty phase may be changing.
RISK MANAGEMENT NOTES
━━━━━━━━━━━━━━━━━━━━━━
This indicator is especially useful for risk adjustment.
Possible applications:
• Reduce size during High IV and Extreme IV regimes
• Avoid tight stops when the IV Proxy is rising
• Avoid over-targeting trades when the IV Proxy is compressed
• Use wider stops only if position size is reduced
• Avoid fading extreme moves without confirmation
• Use compression to prepare, not predict
• Use cooling to monitor possible exhaustion
A practical rule:
As uncertainty rises, position size should generally fall.
WHAT THIS INDICATOR IS BEST FOR
━━━━━━━━━━━━━━━━━━━━━━
This indicator is best used for:
• Uncertainty regime detection
• Volatility context
• Breakout preparation
• Momentum confirmation
• Shock detection
• Risk management
• Trade sizing context
• Event-risk awareness
It is most useful when combined with price action, market structure, support/resistance, trend filters, and macro or event awareness.
WHAT THIS INDICATOR IS NOT
━━━━━━━━━━━━━━━━━━━━━━
This indicator is not:
• Real options-chain implied volatility
• A volatility surface model
• A skew or term structure model
• A dealer gamma model
• A standalone trading strategy
• A buy or sell signal generator
• A guarantee of future volatility
• A replacement for risk management
The IV Proxy describes uncertainty conditions. It does not tell you direction by itself.
IMPORTANT LIMITATIONS
━━━━━━━━━━━━━━━━━━━━━━
The indicator uses historical price behaviour. It does not know future volatility.
The indicator does not include:
• Options-chain implied volatility
• Options skew
• Options term structure
• Dealer positioning
• Order flow
• Market depth
• Positioning data
• Fundamental data
• News sentiment
• Liquidity conditions
Volatility and uncertainty can change rapidly after:
• Economic data releases
• Central bank decisions
• Earnings reports
• Geopolitical events
• Liquidity shocks
• Crypto liquidation cascades
• Market open or close effects
Use it as a decision-support tool, not as a standalone trading system.
FINAL NOTES
━━━━━━━━━━━━━━━━━━━━━━
The Implied Volatility Proxy Indicator helps traders think in terms of uncertainty, risk, and volatility regime.
Instead of asking only whether price is bullish or bearish, this tool helps answer:
• Is uncertainty compressed or elevated?
• Is uncertainty rising or falling?
• Is the market entering a volatility shock?
• Is volatility pressure starting to cool?
• Should I trade normally, reduce size, or wait?
• Is this environment better for breakout, momentum, range, or defensive trading?
The indicator is designed to improve trade context and risk discipline.
Indikator
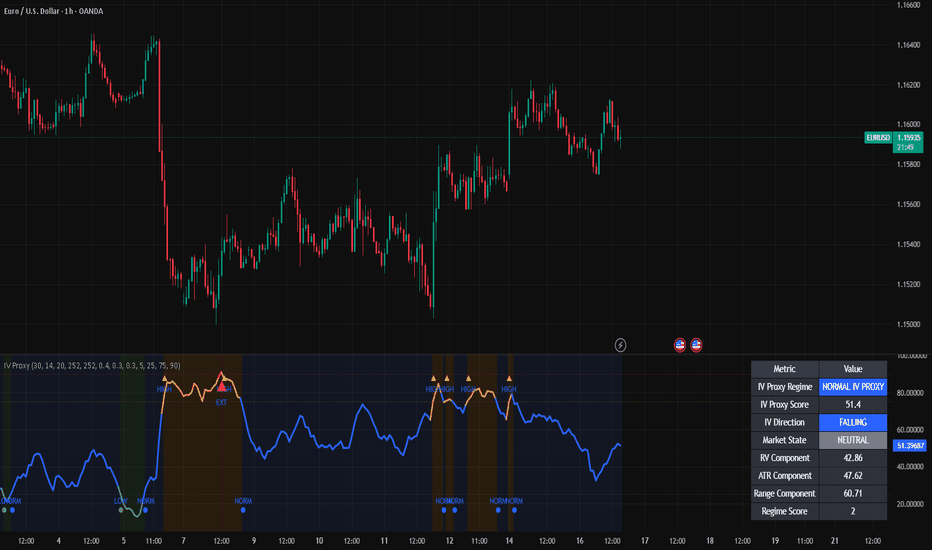
Indikator

Market Adaptive Trend [Interakktive]Market Adaptive Trend (MAT) is a diagnostic trend tool that re-tunes its own responsiveness to the live volatility regime — and shows you, in plain English, why it tightened or loosened.
Most "adaptive" trend tools hide their adaptation behind math you cannot audit. MAT does the opposite: it adapts AND it narrates. Every adjustment it makes is shown on the chart, in words, so you can see the reasoning rather than trust a black box.
This is a market-state diagnostic tool, not a signal generator.
█ THE CORE IDEA
A fixed-length moving average has one flaw: it responds the same way in calm markets and violent ones. In a clean trend it lags; in a chop it whipsaws. MAT addresses this by letting the live volatility regime govern how responsive the trend line is — the link most adaptive tools never expose.
MAT continuously measures relative volatility: current ATR divided by its own longer-run average. A reading near 1.00 means volatility is at this market's own baseline; above means more volatile than usual; below means calmer. That single ratio classifies the market into one of three regimes, and each regime changes how the line behaves.
█ THE THREE REGIMES
RIDING (calm) — Volatility below baseline. The line loosens and leans toward its slower estimate, so it rides a clean trend without being shaken out by minor noise.
TIGHTENING (balanced) — Volatility near baseline. The line sits in a balanced blend — neither chasing nor lagging — typical of coiling, pre-expansion conditions.
GUARDED (volatile / stretched) — Volatility above baseline. The line damps its response and becomes slow to flip, and candles tint amber as a caution that conditions are stretched and a flip here is lower-confidence.
█ HOW THE LINE IS BUILT
MAT blends a fast and a slow estimate of price. The blend weight is not fixed — it shifts with the regime above, scaled by an Adaptation Strength input (0 = a fixed blend, 1 = full regime governance). The blended target then drives the visible line through an error-feedback step, so the line moves toward its target proportionally rather than snapping. The calculation uses only confirmed historical data, contains no lookahead, and does not repaint.
█ THE HUD
A compact on-chart panel reports, in plain language:
- Trend — UP / DOWN
- Regime — RIDING / TIGHTENING / GUARDED, with a plain-English volatility descriptor (very calm → below normal → near normal → slightly elevated → high)
- Responsiveness — LOW / MED / HIGH (how reactive the line currently is)
- Read — a one-line summary of the current state
No raw scores are presented as the message — the panel is meant to be read at a glance.
█ HOW TRADERS USE MAT
MAT is designed to provide context, not entries. Common uses:
- Reading whether the current environment favours riding (RIDING) or caution (GUARDED)
- Avoiding low-confidence flips when the regime is GUARDED and conditions are stretched
- Using the regime read as a filter alongside your own entry method
- Framing trend direction with an honest sense of how much to trust it right now
█ SETTINGS OVERVIEW
Adaptive Baseline
- Source, Fast estimate length, Slow estimate length
- Adaptation Strength (how strongly the regime governs responsiveness)
Regime Governor
- Volatility baseline length, ATR length
- Calm threshold (below = RIDING), Volatile threshold (above = GUARDED)
Visual
- Adaptive line, Gradient fill, Edge glow, Color candles, Line width
HUD
- Show HUD, Position, Size
█ DISCLAIMER
This indicator is a market context and diagnostic tool only. It does not generate trade signals, entries, or exits. Past behaviour does not guarantee future price action. Always combine with independent analysis and proper risk management. Indikator

Liquidity Magnet ICT Liquidity & Sweeps [LunqFX]Liquidity Magnet is an ICT / Smart Money Concepts (SMC) liquidity indicator that maps buy-side and sell-side liquidity (BSL / SSL) and ranks every liquidity pool by how likely it is to be swept next. Instead of just drawing equal highs, equal lows and swing liquidity, it scores each resting pool of liquidity with a transparent 0–100 "Magnet Score" and highlights the single strongest draw on price as the NEXT TARGET — so you can anticipate the next liquidity sweep, stop hunt or liquidity grab before it happens.
If you trade ICT concepts, order flow, smart money, or supply and demand, this tool answers the one question every liquidity-based strategy needs: where is price most likely to go to take liquidity next?
WHAT IT DOES
• Detects liquidity pools automatically — swing highs / lows and equal highs / equal lows (EQH / EQL) where stop-losses cluster.
• Scores each pool 0–100 with the Magnet Score, a transparent weighted formula.
• Flags the strongest pool as the NEXT TARGET with a live arrow, price and probability.
• Marks pools as swept the moment price closes through them, then fades them.
• Shows a clean live dashboard: next target, probability, distance, bias and pool counts.
• Recolors the chart with neon gradient candles (turquoise bullish / violet bearish).
HOW THE MAGNET SCORE WORKS
The Magnet Score is fully transparent — no black box. Each unswept pool is graded on four weighted factors:
1. Proximity — how close the pool sits to current price (closer pulls harder).
2. Momentum — whether current momentum is moving toward the pool.
3. Age — how long the pool has rested untouched (older pools hold more liquidity).
4. Touches — how many times price has tagged the level (more taps = more stops stacked).
The four factors are combined into a single 0–100 score. The pool with the highest score, within a maximum distance from price, becomes the NEXT TARGET. If no pool is strong or close enough, the panel honestly reports "No clear magnet" instead of inventing a far-away target.
HOW TO USE IT
1. Read the BIAS in the panel — BUY-SIDE PULL means liquidity above is the draw (look for longs into the target); SELL-SIDE PULL means liquidity below is the draw (look for shorts).
2. Find the NEXT TARGET — the highlighted pool is where price is most likely to sweep liquidity next. Use it as a logical take-profit / objective.
3. Check the PROBABILITY bar — higher score = stronger magnet. Weak scores mean price is in a low-liquidity void; be patient.
4. Watch DISTANCE — how far the target is in %. Tight distance = an immediate objective; large distance = a swing objective.
5. Trade the sweep — as price reaches a pool and sweeps it, watch for the reaction. Swept pools fade automatically so the chart always shows live, unmitigated liquidity only.
Tip: combine the NEXT TARGET with your own entry model (FVG, order block, market structure). Liquidity Magnet tells you WHERE liquidity sits and which pool is the draw — you choose the entry.
THE DASHBOARD
• NEXT TARGET — price of the strongest liquidity pool and its probability.
• Probability bar — visual 0–100 strength of the current magnet.
• Distance — % distance from price to the target.
• Touches — how many times the target level was tested.
• Bias — overall liquidity pull (buy-side vs sell-side).
• Buy-side / Sell-side pools — count of active unmitigated pools on each side.
NON-REPAINTING
All liquidity pools are built from confirmed pivots (a fixed lookback of closed bars), and every sweep is confirmed on closed bars only — barstate.isconfirmed. Scores and visuals are display-side and never rewrite history. No request.security, no lookahead, no future leak. What you see is what actually happened.
SETTINGS
Liquidity Engine
• Swing length — pivot lookback; higher = only major swings become pools.
• Equal-level tolerance — how close two highs/lows must be (in ATR) to merge into one pool and count as a touch.
• Max pools per side — cap on active pools above and below.
• Max pool age — pools older than this are removed.
Magnet Score
• Proximity range, Momentum lookback / range — sensitivity of the score factors.
• Weights: proximity / age / touches / momentum — fully customizable scoring.
• Min score to flag target — hide weak magnets below this score.
• Max target distance % — a pool farther than this can never be the NEXT TARGET.
Neon Candles
• Neon gradient candles on/off, Glow halo on/off.
Panel
• Show panel, position, background / text / accent colors.
BEST USED ON
Forex, Gold (XAUUSD), indices, crypto and stocks. Works on all timeframes; intraday (15m–4H) is ideal for liquidity sweeps, higher timeframes for swing objectives.
Keywords: liquidity, liquidity sweep, liquidity pools, ICT, SMC, smart money concepts, buy-side liquidity, sell-side liquidity, BSL, SSL, equal highs, equal lows, EQH, EQL, stop hunt, liquidity grab, order flow, smart money, market structure.
This indicator is a decision-support tool, not financial advice. Always combine it with your own analysis and risk management.
Indikator

Alpha Signal Engine Pro [MarkitTick]🎁 Our gift to the TradingView community.
This indicator was previously available as a paid, invite-only tool. Today, it is permanently and unconditionally free — open to every trader on TradingView without restriction, without a subscription, and without an expiration date.
No catch. No trial period. Ours to you, forever.
💡A comprehensive trend-following and market-state detection framework . It operates by generating a dynamic, volatility-adjusted trailing band that reacts not just to price movements, but to the shifting structural regimes of the asset. By analyzing True Range, historical price percentiles, and momentum simultaneously, this indicator filters out market noise and isolates high-probability directional shifts. It inherently guards against false signals during flat or consolidating markets through a multi-layered filtering matrix, ensuring that traders are presented with actionable data only when strict momentum and structural conditions are met.
● ✨ Originality and Utility
Most trend-following systems rely on static multipliers or fixed lookback periods, rendering them susceptible to sudden market regime changes. The primary utility of this engine lies in its adaptive nature. It introduces a Volatility Fingerprint module that constantly scans the environment, classifying the market into distinct regimes: Alpha, Beta, Gamma, and Delta. Based on this continuous assessment, the indicator autonomously scales its sensitivity, smoothing depth, and filter thresholds. This means the engine tightens its criteria during erratic, low-liquidity chop and expands its bands during high-volatility expansions, providing an organic, self-adjusting framework that eliminates the need for constant manual parameter tuning.
● 🔬 Methodology and Concepts
• Dynamic Trailing Core
At the heart of the engine is a composite distance formula that calculates a dynamic half-band. Instead of relying solely on a basic Average True Range (ATR) multiplier, it combines three elements: an absolute band multiplier, an ATR weight normalized against the closing price, and a raw price move weight. This composite value is then smoothed using an Exponential Moving Average (EMA) alpha factor. The resulting smoothed band is applied to the median price to establish upper and lower boundaries, forming the basis of the trendline.
• Volatility Fingerprinting
The script normalizes the ATR as a percentage of the closing price and ranks it against a historical lookback window using non-parametric percentile thresholds. By splitting the historical distribution into quartiles (25th, 50th, and 75th percentiles), the asset's current volatility is placed into a specific bucket. The core mathematical weights and matrix thresholds are then dynamically multiplied by regime-specific scalars.
• Alpha Filtering Matrix
To prevent whipsaws, the script employs a five-layer matrix that acts as a logical gatekeeper before any signal is validated:
- Trendline Stall: Measures the absolute change in the trendline against a fraction of the ATR.
- Slope Regression: Computes the linear regression slope of the trendline over a rolling window and normalizes it.
- Volume Gate: Compares current volume to a dynamic simple moving average of volume.
- Range Gate: Checks if the current bar's High-Low range exceeds a specific historical percentile.
- Basis Point (BPS) Delta: Ensures the trendline shift meets a minimum percentage threshold.
• Breakout Override
If the market suddenly explodes with extreme momentum, a Breakout Override function bypasses the filtering matrix. If the absolute change in price heavily exceeds a set multiple of the ATR, the system immediately forces engagement to capture the breakout.
● 🎨 Visual Guide
• Dynamic Trendline
A solid line plots the active trailing stop and trend direction. By default, it is colored Cyan for a Bullish trend and Magenta for a Bearish trend. This line steps up or down along with price action, providing a clear visual anchor for the current structural bias.
• Dynamic Bar Coloring
The chart's candlesticks are dynamically colored using a visual gradient. The script measures the normalized distance of the closing price from the trendline. When price is near the trendline, candles assume a neutral slate-blue tone. As momentum carries price further away, the color interpolates into bright Cyan (Bullish) or Magenta (Bearish), immediately illustrating trend strength.
• Cloud Fill
A semi-transparent cloud is drawn between the primary trendline and a smoothed moving average of the typical price. This creates a visual "value zone" on the chart, helping users quickly identify the spatial relationship between the current trend anchor and the smoothed price core.
• HUD Dashboard
A comprehensive heads-up display is positioned in the top-right corner of the chart. It outputs real-time diagnostic data:
- Direction: Displays the current structural bias (Bullish/Bearish).
- Signal: Indicates if an actionable Buy or Sell signal is present.
- Override: Shows the status of the Breakout Override (Off, Nominal, or Engaged in Orange).
- Matrix Pillars: Five rows display the status of the Stall, Slope, Volume, Range, and BPS Delta filters. A Red "Flat" tag indicates the filter is blocking signals, while a Green "Active" tag indicates the path is clear.
- VF Regime: The bottom row explicitly states the current volatility state (Alpha, Beta, Gamma, or Delta) with corresponding color codes.
• Signal Labels
When a directional flip occurs and the matrix conditions are met, explicit "BUY" (Upward pointing, subtle green) or "SELL" (Downward pointing, subtle red) labels are plotted precisely at the trendline level.
• Non-Standard Chart Warning
If the user applies the script to Heikin Ashi, Renko, Line Break, Kagi, or Point & Figure charts, a bold Red warning table will appear in the top-left corner. This warns the user that standard signals may repaint due to the synthetic price data of non-standard charts.
📌 Note : the best way to resolve visual overlap is to navigate to the Object Tree and drag the indicator above the main chart layer, or simply hide the native candles in your chart settings.
● 📖 How to Use
• Identifying Entries
Wait for a clear crossover of the closing price over the dynamic trendline. For a valid entry, ensure the HUD Dashboard confirms the matrix conditions are "Active" and not "Flat." The emergence of a defined BUY or SELL label serves as the primary action trigger.
• Managing the Trade
Once in a position, the dynamic trendline serves as a logical trailing stop-loss level. As the trendline steps in the direction of the trade, users can manually trail their risk. The color gradient on the bars provides a secondary gauge; fading colors suggest weakening momentum and a potential reversion to the mean.
• Regime Awareness
Monitor the VF Regime status on the dashboard. In "Alpha" or "Beta" (lower volatility), expect tighter bands and slower movements. In "Gamma" or "Delta" (extreme volatility), be prepared for wider stops and aggressive price action. The indicator will automatically handle the mathematical adjustments, but position sizing should reflect the increased environmental risk.
• Repaint Warning Note
Always utilize this indicator on standard candlestick or bar charts. The underlying calculations depend on absolute close, high, and low values. Applying this to Heikin Ashi will cause lookahead bias and repainting signals.
🏆 Golden Rule — Before You Trade This Indicator:
Never rely on the default settings, every asset behaves differently. Every timeframe has its own rhythm. Default settings are a starting point — not a strategy.
The best configuration is the one you build yourself, through deliberate testing:
Adjust the settings methodically until false signals are minimized and entry/exit accuracy is maximized.
Test on your specific asset. Test on your specific timeframe. Then lock in what works.
The trader who takes time to configure is the trader who profits consistently.
● ⚙️ Inputs and Settings
• Volatility Fingerprint Group
Allows users to toggle the adaptive engine on or off, and set the lookback length used to determine the historical percentiles for regime classification.
• Core Engine Parameters
Controls the baseline foundation. Adjust the ATR period, the absolute Band Multiplier, the relative ATR Weight, the Price Move Weight, and the EMA Smoothing Length. When VF is enabled, these act as the baseline from which multipliers scale.
• Alpha Filtering Matrix
Provides granular control over the five anti-chop filters. Users can toggle each filter independently and adjust their strictness, such as the Flatness Threshold, Regression Length, Slope Threshold, Volume MA Length, and Range Percentile.
• Display & Cloud Configuration
Permits full aesthetic customization of the Bull/Bear colors, neutral gradient tones, visibility of the dashboard, signal labels, and the transparency parameters of the cloud fill.
• Alert Actions
Customizable string inputs that feed directly into the JSON webhook alert system, allowing automated traders to define syntax for Long, Short, Close Long, and Close Short actions.
● 🔍 Deconstruction of the Underlying Scientific and Academic Framework
• Autoregressive Smoothing and Moving Averages
The system employs an Exponential Moving Average (EMA) to smooth its dynamic raw band. The mathematical alpha factor is defined as 2 / (N + 1), where N is the user-defined smoothing length. This recursive formula assigns geometrically decreasing weights to older observations, ensuring the trendline remains highly responsive to recent price vectors while mathematically filtering high-frequency noise.
• Non-Parametric Rank Statistics
To evaluate the volatility state, the script calculates the nearest-rank percentile of the normalized ATR over a rolling window. Unlike standard standard-deviation bands (such as Bollinger Bands) that assume a normal Gaussian distribution of returns, this non-parametric percentile approach does not assume normality. This is statistically robust for financial time series, which exhibit leptokurtic (fat-tailed) distributions, ensuring accurate classification even during severe market outliers.
• Linear Regression and Slope Normalization
The Slope Filter relies on the Ordinary Least Squares (OLS) linear regression of the trendline. By calculating the change between the current linear regression value and the previous bar's value, it extracts a pure mathematical slope. To make this slope asset-agnostic, it is normalized by dividing the raw slope by the ATR, yielding a dimensionless ratio that accurately represents directional velocity regardless of the instrument's absolute price.
⚠️ Disclaimer
All provided scripts and indicators are strictly for educational exploration and must not be interpreted as financial advice or a recommendation to execute trades. We expressly disclaim all liability for any financial losses or damages that may result, directly or indirectly, from the reliance on or application of these tools. Market participation carries inherent risk where past performance never guarantees future returns, leaving all investment decisions and due diligence solely at your own discretion. Indikator

Tightening Trailing Stop LossA utility tool to independently simulate a Trailing Stop based on ATR and Recent Candle Structure. It's most helpful if you only want something to independently trail a Stop and nothing else. For example, if you decide where to enter via a discretionary system, but like trailing Stops via code.
It's used by changing the 'Start Date' to the date where you wish to enter. It'll then display a Stop and Trail it, until it intersects with a candle. The Indicator will hide itself when it intersects with a candle to avoid cluttering the chart. It only moves in the direction of risk, so that means that, when set, it'll never increase the risk of your trade, unlike simple ATR bands. However, it does require resetting manually for each trade.
By Default, it uses a 10 Period RMA ATR, which is set 0.5 ATR away from the Low/High of the recent candle structure. It'll tighten each candle by multiplying it's value with .95, meaning it always tightens a little. All of these can be changed in the settings to match your preferred method of Setting/Trailing Stops
Indikator

SOL v1.0 Swing Trader
SOL v1.0 · Swing Trader 1-4hr Time Frame
A systematic mean-reversion signal cockpit for SOL perpetual futures. Identifies capitulation washout lows in low-momentum, ranging market conditions and targets multi-day recoveries. Built and validated on Jupiter Perps.
The thesis:
SOL spends extended periods chopping in tight ranges. Inside those ranges, sharp downward volatility spikes — capitulation wicks that flush weak longs — tend to resolve upward over the following 2–3 days. This indicator identifies those setups systematically and tells you exactly where to enter, where to take profit, and where to cut the loss.
Three hard gates — all three must be true to fire a signal
WVF (Williams VIX Fix) — detects the capitulation wick structure. Price made a sharp low, volatility spiked, and has since reset. This is the core setup identifier.
ADX < 25 — confirms the market is ranging, not trending. Mean reversion has no edge in a trending market. This gate ensures you're only trading the conditions where the thesis applies.
ER < 0.35 (Efficiency Ratio) — confirms the price action is genuinely choppy, not directional. A low efficiency ratio means price is oscillating rather than making sustained moves. Paired with ADX, this is the tightest ranging filter available without adding lag.
All three gates are toggleable and threshold-adjustable in the inputs. Defaults are the validated settings — change them only if you know what you're doing.
Stop framework:
Framework B fixed exits, validated as optimal against every alternative tested:
2h signals: TP +8.5% / SL −5.0%
3h signals: TP +10.0% / SL −6.0%
4h signals: TP +13.0% / SL −8.0%
Timeout: 144 bars (trade closes at market if neither target nor stop is hit)
Do not move the stop to breakeven. Do not take partial profit early. Do not trail. Every mechanism that touches a winning trade early was tested head-to-head against these fixed exits and underperformed. The stop is wide by design — the capitulation retest requires room.
Tiered alerts:
T4 ★★ — 3h and 4h aligned simultaneously. Strongest setup.
T3 ★ — 2h and 3h aligned. Primary signal.
T2 — 3h gate live only.
T1 — 2h gate live only.
T3 and T4 are the setups to prioritize. T1 and T2 are informational — treat them as early warnings that a T3 may be forming.
The panel:
NOW — live multi-timeframe decision cockpit across 1h, 2h, 3h, and 4h. Shows gate status, tier (BASE / SCALE / FULL based on trend-alignment score), regime (GREEN / YELLOW), and live Jupiter-ready entry, TP, and SL prices the moment a signal fires. Prices are anchored to the signal bar close — what you would have entered at.
CONFLUENCE — chart-timeframe observable stack. MBI, CVI, BBAWE, BP, VWAP, OBV, DELTA, EMA 9/21, HTF 240 bias, BTC regime, BB state. These do not gate signals. They are context — use them to read the quality of the setup before executing.
GREEN vs YELLOW regime — the NOW panel shows a regime color for each timeframe. GREEN means both ADX and ER confirm a tight ranging condition. YELLOW means ADX is below threshold but ER is elevated — a looser, less favorable setup. The system still signals in YELLOW with the default settings, but GREEN entries carry materially stronger historical performance. When the regime row is YELLOW, size accordingly or wait.
Chart overlays:
Bollinger Bands · EMA 9/21 · EMA 50 · SMA 50 · WVF capitulation markers · FVG (Fair Value Gap) boxes · Pivot swing high/low levels · Liquidation level lines (manual Coinglass inputs) · Adaptive Trend Finder channel. All individually toggleable.
Liquidation levels:
Enter your session liquidation heatmap values manually from Coinglass (SOL, 24h, All Exchanges, threshold 0.85). Four inputs: two above price, two below. These plot as horizontal reference lines — not signals, not gates. They show where forced liquidations are clustered, which can act as magnet levels for the capitulation move and for the recovery target.
What this is not:
Not a bot. Not an automated execution system. You receive an alert, you review the panel, you execute on Jupiter manually.
Not suitable for trending markets. When SOL is in a sustained directional move, the ADX gate will suppress most signals by design. If you're fighting the gate, the market is telling you this is not a mean-reversion environment.
Not a scalping tool. The 2h and 3h timeframes mean signals fire infrequently — sometimes once a week, sometimes less. The edge lives in patience and selectivity, not volume of trades.
Not optimized for other assets. Every parameter — WVF calibration, ADX threshold, ER threshold, stop percentages — was derived and validated specifically on SOL perpetuals. Applying it to BTC, ETH, or altcoins without independent validation is untested.
Inputs worth knowing:
Panel size and position are adjustable. If you're on mobile, Tiny or Small with Top Right works well.
The stop framework selector (A / B / C) is visible in inputs. Framework B is the validated default. A uses tighter stops and smaller targets — lower R:R. C uses wider stops with the same targets as A. Don't change the framework without understanding that the performance data was collected on B.
The conditions group exposes every parameter (WVF period, BB length, ADX length, ER length, EMA lengths, VIDYA settings, etc.) for advanced users. Leave them at defaults unless you have a specific reason to change them.
SOL v1.0 · Swing Trader is an analysis tool, not financial advice. Past signal performance does not guarantee future results. Perpetual futures carry significant risk including total loss of margin. Trade only what you can afford to lose.
Indikator

Event HorizonEvent Horizon is a historical analog projection fan designed to answer one practical question:
What has price tended to do after market conditions similar to the current one?
Instead of using a fixed crossover, oscillator threshold, or trend flip, this indicator builds a market fingerprint from the current chart, searches historical bars for similar conditions, and projects how those past analogs moved forward. The result is a visual forward fan showing possible path behavior, consensus direction, dispersion, confidence, and the closest historical analog path.
The goal is not to predict the future with certainty. The goal is to give traders a structured way to compare the current setup against similar historical environments and quickly see whether the analogs are aligned, scattered, bullish, bearish, or not useful.
━━━━━━━━━━━━━━━━━━━━━━━━━━━━━━━━━━━━━━
What makes this script different
━━━━━━━━━━━━━━━━━━━━━━━━━━━━━━━━━━━━━━
Most projection tools draw a channel, regression, moving average extension, or volatility cone from a fixed formula.
Event Horizon uses a historical analog engine. Each bar is converted into a multi-factor feature profile, then compared against prior market states using weighted Euclidean similarity. The closest historical analogs are used to create a forward projection fan.
The script combines:
• Historical analog matching
• Weighted Euclidean distance
• Regime-aware scoring
• Volatility and trend-state filtering
• Consensus projection logic
• Closest historical path overlay
• Agreement and confidence scoring
• Directional historical event dots
• A visual fan that shows uncertainty instead of one hard prediction
━━━━━━━━━━━━━━━━━━━━━━━━━━━━━━━━━━━━━━
How it works
━━━━━━━━━━━━━━━━━━━━━━━━━━━━━━━━━━━━━━
1. Market fingerprint
The script measures the current market using multiple dimensions, including:
• Recent price movement
• Trend slope
• ATR expansion and compression
• Candle range and body behavior
• Wick imbalance
• Position relative to recent structure
• Breakout distance
• Volume ratio and volume trend
• ATR percentile
• ADX / trend strength
• Historical shape samples
This creates a multi-dimensional profile of the current setup.
2. Historical analog search
The current profile is compared to historical profiles on the same chart. Similarity is calculated with weighted Euclidean distance, so higher-value features such as trend, volatility regime, and price-shape behavior can matter more than smaller candle details.
Closer historical examples receive stronger match scores.
3. Regime awareness
The script also classifies the current environment into regimes such as trend, compression, volatility expansion, volume shock, or range/chop. Historical examples from incompatible regimes are penalized, helping reduce weak comparisons.
4. Forward projection
Once the best analogs are selected, the script looks at what actually happened after those historical setups. Those forward moves are normalized and projected from the current anchor point.
5. Consensus and confidence
The indicator summarizes the analog group with:
• Directional bias
• Agreement percentage
• Dispersion
• Confidence score
• Edge state: TRADEABLE, CAUTION, or NO EDGE
• Historical self-test statistics
━━━━━━━━━━━━━━━━━━━━━━━━━━━━━━━━━━━━━━
How to read the fan
━━━━━━━━━━━━━━━━━━━━━━━━━━━━━━━━━━━━━━
The colored fan shows the projected analog field.
The colored median shows the consensus path of the analog set.
The white line shows the closest visible historical analog path. It is not a guaranteed target. It is the path taken by the most similar past setup selected by the engine.
The wider the fan, the more disagreement there is between analogs.
The tighter the fan, the more historically aligned the analogs are.
The confidence and edge label are important. A bullish-looking fan with low confidence or high dispersion should be treated differently than a bullish fan with strong agreement and cleaner regime structure.
━━━━━━━━━━━━━━━━━━━━━━━━━━━━━━━━━━━━━━
Historical dots
━━━━━━━━━━━━━━━━━━━━━━━━━━━━━━━━━━━━━━
Historical event dots help visually review where prior projection events occurred.
• Bullish projection dots appear below price
• Bearish projection dots appear above price
• Mixed or neutral readings are visually separated
This makes it easier to inspect whether the indicator has been identifying useful directional conditions on the current symbol and timeframe.
━━━━━━━━━━━━━━━━━━━━━━━━━━━━━━━━━━━━━━
How to use it
━━━━━━━━━━━━━━━━━━━━━━━━━━━━━━━━━━━━━━
For newer traders:
1. Start on the Daily or 4H chart.
2. Look at the colored median.
3. Check whether the white analog path agrees with the median.
4. Check confidence and agreement.
5. Avoid forcing trades when the label says NO EDGE or when dispersion is high.
A stronger bullish read usually has:
• Median path rising
• White analog path also rising
• Agreement above roughly 65%
• Confidence above roughly 70
• Low or medium dispersion
• Edge state showing TRADEABLE or CAUTION, not NO EDGE
A weaker or avoidable read usually has:
• Median and white path disagreeing
• Agreement near 50%
• High dispersion
• Low confidence
• Range/chop regime
• NO EDGE label
For experienced traders:
Use the fan as an analog-based context layer. It is most useful when combined with your own structure, liquidity, trend, support/resistance, volume, or macro view. The script is designed to show whether historical analog behavior supports or conflicts with the trade idea you already see on the chart.
━━━━━━━━━━━━━━━━━━━━━━━━━━━━━━━━━━━━━━
Suggested settings
━━━━━━━━━━━━━━━━━━━━━━━━━━━━━━━━━━━━━━
Balanced stocks / ETFs:
• Mode: Current Bar Projection
• Visual Mode: Cinematic
• Fan Style: Hybrid Swarm + Contours
• Horizon: 30
• Memory Lookback: 1800
• Max Analogs: 30
• Minimum Analogs: 6
• Pre-Event Window: 20
• Shape Samples: 6
• Path Scale: 1.0
Crypto:
• Horizon: 24
• Memory Lookback: 2000 to 2500
• Path Scale: 0.75 to 0.90
• Flexible direction matching
Intraday:
• Horizon: 20 to 24
• Minimum Analogs: 8
• Path Scale: 0.75 to 1.0
• Use liquid symbols only
Trend continuation:
• Direction Matching: Strict
• Mirror Opposite Direction: Off
• Path Scale: 1.0
Reversal / exhaustion:
• Direction Matching: Flexible
• Mirror Opposite Direction: On
• Path Scale: 0.75
• Shorter horizon preferred
━━━━━━━━━━━━━━━━━━━━━━━━━━━━━━━━━━━━━━
Best use cases
━━━━━━━━━━━━━━━━━━━━━━━━━━━━━━━━━━━━━━
Event Horizon is best suited for:
• Liquid stocks
• Major ETFs
• Index products
• Major crypto pairs
• Trend continuation setups
• Post-compression expansion
• Structure breaks
• Swing-trade context
• Daily and 4H analysis
It is less suitable for:
• Illiquid symbols
• Very new tickers with limited history
• Low-volume penny stocks
• Earnings gaps
• Binary news events
• Extremely short scalping timeframes
• Markets with sudden one-off catalysts
━━━━━━━━━━━━━━━━━━━━━━━━━━━━━━━━━━━━━━
Important notes
━━━━━━━━━━━━━━━━━━━━━━━━━━━━━━━━━━━━━━
This is an analog projection tool, not a standalone buy/sell system.
Historical similarity does not guarantee future behavior. Market structure, liquidity, volatility, news, and macro conditions can change quickly. The fan should be used as a decision-support layer, not as a guaranteed forecast.
The strongest readings occur when the median, white analog path, agreement, confidence, and regime state all point in the same direction.
The weakest readings occur when analogs are scattered, confidence is low, dispersion is high, or the script identifies a no-edge environment.
━━━━━━━━━━━━━━━━━━━━━━━━━━━━━━━━━━━━━━
Summary
━━━━━━━━━━━━━━━━━━━━━━━━━━━━━━━━━━━━━━
Event Horizon turns historical market behavior into a forward analog projection fan.
It helps traders see:
• What similar past setups did next
• Whether those analogs agree or disagree
• Whether the current regime supports the projection
• Whether the projected path is tight or scattered
• Whether the setup has enough confidence to matter
Use it to add historical context, probability awareness, and regime-based discipline to your chart analysis.
Indikator

Sweep V-Recovery Smart Zones ProSweep V-Recovery Smart Zones Pro is a smart-money style TradingView indicator designed to identify liquidity sweeps, fast V-shape recoveries, and high-quality retests into key zones such as Inversion Fair Value Gaps (IFVGs), Order Blocks (OBs), and Breaker Blocks.
The indicator is built to help traders focus on reversal and continuation setups that begin with a sweep of liquidity, followed by a sharp recovery, and then a retest into a valid bullish or bearish zone. This makes it especially useful for traders looking for structured entries rather than chasing the initial move.
In addition to the core signal logic, the script also maps and manages real-time Fair Value Gaps (FVGs), Inversion Fair Value Gaps (IFVGs), Order Blocks, and Breaker Blocks directly on the chart using customizable live boxes. Zones can be shown or hidden individually, their colors can be fully customized, and invalidated zones can automatically remove themselves to keep the chart cleaner.
A major feature of this indicator is its smart zone behavior. When enabled, broken FVGs can automatically convert into IFVGs, allowing the chart to update as market structure changes. The indicator can also preserve prior-session zones and lets the user define how many days of historical zones should remain visible, making it useful for both intraday and multi-day context.
The script also includes IFVG quality filters to reduce lower-probability signals. Users can require a minimum IFVG size in ticks, limit how far away the original FVG can be before the inversion is considered valid, and optionally block signals when price is trading inside a Balanced Price Range (BPR) or overlapping opposite-gap area.
For traders who want stronger confirmation, the indicator can also print a strong signal when an IFVG overlaps with an Order Block or Breaker Block in the same price area. This helps distinguish standard setups from higher-confluence setups.
What the indicator looks for
Long setup
Price sweeps a prior low
Price forms a V-shape recovery
Price retests a valid bullish IFVG, bullish OB, or bullish Breaker
A long signal appears when confirmation rules are met
Short setup
Price sweeps a prior high
Price forms an inverted V recovery
Price retests a valid bearish IFVG, bearish OB, or bearish Breaker
A short signal appears when confirmation rules are met
Features
Liquidity sweep detection
3-bar V-recovery logic
2-candle snapback recovery logic
Retest signal logic
Real-time FVG, IFVG, Order Block, and Breaker Block boxes
Optional automatic removal of broken zones
Optional FVG to IFVG conversion
Adjustable historical zone lookback
Optional BPR no-signal filter
Optional minimum IFVG size filter
Optional maximum bars from FVG to IFVG filter
Strong confirmation signals when IFVG overlaps OB or Breaker
Fully customizable colors and visibility settings
Built-in alerts
Designed for clean charting and flexible workflows
Recommended settings
These are the settings I found to work best:
Setting Recommended Value
Zone Lookback Days 20
Minimum IFVG Size 20 ticks
Max Bars From FVG to IFVG 200
Sweep Lookback Bars 30
Recovery Window Bars 2
Retest Window Bars 15
Best use
This indicator is best suited for intraday trading, especially on markets where liquidity sweeps and fast recoveries are common. It works well for traders who want to combine price action, smart-money zone mapping, and clean retest entries into one workflow.
Notes
FVG, IFVG, Order Block, Breaker Block, and BPR logic are rule-based and designed for consistent automation in Pine Script. Because of that, they may not perfectly match every discretionary interpretation, but they provide a practical and structured framework for real-time analysis. Indikator

Strategi

Indikator

Indikator

Solana Day Trader 1.02SOLANA DAY TRADER 1.01
Multi-timeframe capitulation entry system for SOL perpetual futures
━━━━━━━━━━━━━━━━━━━━━━━━━━━━━━━━━━━━━━━━
WHAT IT DOES
Solana Day Trader identifies high-probability long entries during washout conditions — the sharp, wick-heavy drops where weak hands are flushed out before a mean-reversion recovery. It monitors the 15m, 30m, and 1h timeframes simultaneously and grades each potential entry from BASE through SCALE to FULL based on how much confirming evidence lines up.
The result is a live multi-timeframe dashboard that shows exactly where each timeframe stands — gate status, entry tier, confluence score, regime quality, liquidity levels, and active exit signals — all in one panel.
━━━━━━━━━━━━━━━━━━━━━━━━━━━━━━━━━━━━━━━━
HOW IT WORKS
The system runs three filters in sequence. All three must pass for a FULL-tier entry; failing the third downgrades to SCALE or BASE.
1 — CAPITULATION GATES (must both pass)
The Williams VIX Fix (WVF Filtered) fires when the current low relative to recent highs reaches an extreme — the volatility-squeeze signature of a washout wick. A Fair Value Gap (FVG) must also be present: a 3-bar price imbalance that confirms institutional order flow was present at the move. Together these two gates filter out ordinary pullbacks and focus attention on structural lows.
2 — CONFLUENCE SCORE (determines BASE vs SCALE)
Once the gates pass, four factors add to a score: EMA 9>21 alignment, a VIDYA adaptive moving average in bull posture, OBV slope pointing upward (contrarian — rising buy-side pressure into the low), and a signed-volume DELTA measure. The score floor for BASE is 1; SCALE requires 2 or higher. Each weight is adjustable, and any factor can be zeroed out to simplify the model.
3 — REGIME GATE (SCALE → FULL escalation)
FULL tier requires the market to be in a ranging, low-momentum state: ADX below the configured threshold (default 25). High-ADX trending markets favor momentum strategies; low-ADX ranging markets are where mean-reversion setups have the clearest edge. Optionally, a BTC bull requirement can be added as an additional gate for FULL.
━━━━━━━━━━━━━━━━━━━━━━━━━━━━━━━━━━━━━━━━
THE DASHBOARD
The panel (default: middle-right, toggleable) displays a 3-column layout — one column per timeframe (15m / 30m / 1h) — with the active chart timeframe highlighted.
Row by row:
TIER — BASE / SCALE / FULL (or blank if no signal)
SIGNAL — current trade status (GET IN / IN TRADE / EXIT FULL / RE-ENTRY / etc.)
WVF — armed (✓) or not
FVG — armed (✓) or not
TQI gate — gating status when TQI gate is enabled
TQI — Trend Quality Index value (0–1), used for the optional gate and char-flip exit
Score — current confluence score
ADX < — ADX value vs. the FULL-tier threshold
REGIME — GREEN / YELLOW / RED composite regime
HTF / EMA — higher-timeframe EMA bias
ATF / BTC — adaptive trend fit classification + BTC lead direction
VWAP / OBV — swing VWAP position + OBV state
LEVELS — structural stop and ATR-based stop levels
Liq ↑ — nearest auto-detected sell-side liquidity above (resistance pool)
Liq ↓ — nearest auto-detected buy-side liquidity below (support pool)
OBSERVABLES — MBI, CVI, BBAWE, Bull Pressure composite line
Sweep — per-TF liquidity sweep detection
GATES — WVF / FVG gate arm state
GREEN regime = trending higher with measured momentum, favorable for recovery.
YELLOW regime = intermediate / mixed — entries here carry more risk.
RED regime = downtrend or high-volatility chop — approach with caution.
━━━━━━━━━━━━━━━━━━━━━━━━━━━━━━━━━━━━━━━━
EXIT SIGNALS
Four exit conditions are available (each independently toggleable):
• BB Break — closes below the Bollinger lower band; thesis invalidated
• WVF Top — volatility-spike exhaustion reading; momentum likely stalling
• CVI Top — CVI exhaustion signal at extended levels
• Char-Flip (default OFF) — TQI collapse: trend quality deteriorates sharply after entry
The dashboard SIGNAL row tracks trade state and flags when any exit fires. A re-entry signal also activates after a full exit if the entry conditions re-arm within the configured watch window.
━━━━━━━━━━━━━━━━━━━━━━━━━━━━━━━━━━━━━━━━
MANUAL TRADE PROJECTION
When you enter a trade, toggle "I am currently in a trade" ON and type your entry price into "My entry price." The indicator draws TP and SL lines on the chart so you can see your risk/reward at a glance. Toggle OFF when you exit.
━━━━━━━━━━━━━━━━━━━━━━━━━━━━━━━━━━━━━━━━
ALERTS
Three alert conditions are available — one per tier — so you can be notified on BASE, SCALE, and/or FULL fires independently. Configure in the Alert Filtering settings group.
━━━━━━━━━━━━━━━━━━━━━━━━━━━━━━━━━━━━━━━━
RECOMMENDED SETUP
Chart: SOL/USDT or SOLUSDT perpetual, any supported exchange.
Timeframe: 15m is the primary display TF. The indicator reads 15m, 30m, and 1h internally regardless of which TF the chart is set to, but the dashboard highlights whichever matches your chart.
Defaults: WVF gate ON, FVG gate ON, ADX threshold 25, all three timeframes enabled. These are sensible starting points — the system is designed to be used as-is.
The most conservative approach is to trade FULL-tier signals only during GREEN regime. BASE and SCALE signals in YELLOW regime are valid setups but carry wider outcome distributions.
━━━━━━━━━━━━━━━━━━━━━━━━━━━━━━━━━━━━━━━━
SETTINGS GROUPS
Display — panel location/size, chart overlays (BB bands, WVF markers, EMA/SMA lines), trade projection toggle and entry price.
Entry Engine — timing windows (core arm, active trade, exit escalation, cooldown, re-entry).
Gate Stack — toggle WVF, FVG, TQI gates and the BB anti-signal individually.
Tier Escalators — ADX threshold for FULL tier.
Exit Signals — toggle each exit condition independently.
Cores — toggle EMA and VIDYA cores.
Confluence Score — individual weights for EMA, VIDYA, OBV, DELTA; score floor for BASE and SCALE/FULL.
Regime Escalator — BTC — optional BTC bull requirement for FULL-tier entries.
Alert Filtering — enable/disable alerts per tier.
Regime Context — HTF bias timeframe, EMA lengths, ADX length, ATF settings, BTC symbol.
Timeframes — enable/disable 15m, 30m, 1h independently; per-TF entry offset bars.
GATE — WVF Filtered — WVF period, Bollinger parameters, range lookback, arm window.
GATE — FVG — minimum gap height as % of price.
GATE — TQI — Trend Quality Index lengths and thresholds (informational unless TQI gate is enabled).
━━━━━━━━━━━━━━━━━━━━━━━━━━━━━━━━━━━━━━━━
ATTRIBUTION
Williams VIX Fix methodology originally by LazyBear.
VIDYA adaptive moving average component from BigBeluga's Volumatic VIDYA.
━━━━━━━━━━━━━━━━━━━━━━━━━━━━━━━━━━━━━━━━
This indicator is built for SOL perpetual futures. It is a decision-support tool, not a signal service. All entries and exits are your own decision. Past entry conditions do not guarantee future results.
Indikator

Dynamic Volume Profile Oscillator (DVPO)WHAT IT DOES
DVPO is a volume-weighted deviation oscillator. It answers a single question on every bar: how far has price stretched away from the level where most volume has actually traded, measured against how widely volume has been distributed around that level? The result is plotted as a single line oscillating around a 50 midline, with adaptive zones that widen and narrow with the instrument's own behavior instead of relying on fixed thresholds.
WHAT MAKES IT DIFFERENT
Most oscillators ignore volume, and the few that use it tend to use it loosely. RSI and CCI are built purely on price. MFI uses volume, but only to label each bar as buying or selling pressure before summing it like a volume-weighted RSI. %B and CCI both measure deviation from a mean, but the mean is unweighted and the deviation bands are either fixed (Bollinger) or based on a simple mean absolute deviation (CCI).
DVPO differs on two specific points:
The reference is a volume-weighted mean, a rolling VWAP over the lookback window, so the "fair value" it measures against is anchored to where trading actually happened, not to a simple price average.
The normalization is a volume-weighted mean absolute deviation: each bar's distance from the mean is weighted by that bar's share of total volume before being averaged. Price excursions that happened on thin volume contribute little; excursions on heavy volume define the scale. The oscillator then expresses current price as a number of these volume-weighted deviations away from the mean.
On top of that, the overbought/oversold zones are not fixed lines. They are recomputed continuously as a moving average of the oscillator plus or minus a multiple of its own standard deviation, so a quiet instrument gets tight zones and a volatile one gets wide zones automatically.
HOW IT WORKS
Volume-weighted mean (rolling VWAP): mean = sum(price * volume ) / sum(volume ) over the lookback window.
Volume-weighted mean absolute deviation: dev = sum( |price - mean| * (volume / sum(volume)) ) over the same window.
Oscillator (Mean Reversion mode): value = 50 + (price - mean) / (dev * sensitivity) * 25 A reading of 50 means price sits at the volume-weighted mean. Readings pull above or below 50 as price stretches away from it, scaled so that roughly one volume-weighted deviation maps to 25 oscillator points. The value is then EMA-smoothed.
Adaptive zones: midline = moving average of the oscillator (or a fixed 50 if disabled) upper / lower zone = midline +/- standard deviation of the oscillator * zone width
Signal lines: A fast and a slow EMA of the oscillator generate crossover events for timing.
TWO MODES
Mean Reversion (default): the deviation oscillator described above. Best for spotting stretched conditions and exhaustion relative to volume-defined fair value.
Volume Intensity: rescales smoothed volume inside its own recent high-low range, 0 to 100. A simpler read of whether participation is currently expanding or drying up. Useful as a context filter alongside any price tool.
HOW TO USE IT
Works on any market and timeframe. A few common readings:
Price crossing above the upper zone signals an unusually strong push relative to volume-weighted fair value, which can mean breakout strength or, in a range, exhaustion. The fast/slow signal cross helps tell continuation from fade.
A return toward the midline after a zone excursion is the mean-reversion leg.
In Volume Intensity mode, fading participation under a price advance is the classic non-confirmation warning. The four built-in alerts (cross above upper zone, cross below lower zone, bullish and bearish signal cross) let you watch several symbols without staring at charts.
SETTINGS
Defaults are neutral, round starting values rather than curve-fitted numbers: lookback 50, smoothing 5, sensitivity 1.0, adaptive midline period 50, zone width 1.5. Every input carries a tooltip. Bar coloring is off by default so the script does not override your chart; turn it on if you want the oscillator state mirrored on price.
ORIGINALITY
This script is an original construction by SfericaTrading. It does not reuse or adapt third-party Pine code. The underlying statistical building blocks (volume-weighted mean, mean absolute deviation, standard-deviation bands) are standard, but their combination into a volume-weighted deviation oscillator with self-normalizing adaptive zones is the original contribution.
DISCLAIMER
This is an educational tool for market analysis. It is not financial advice and no performance is implied or promised. Always do your own research and manage risk. Indikator
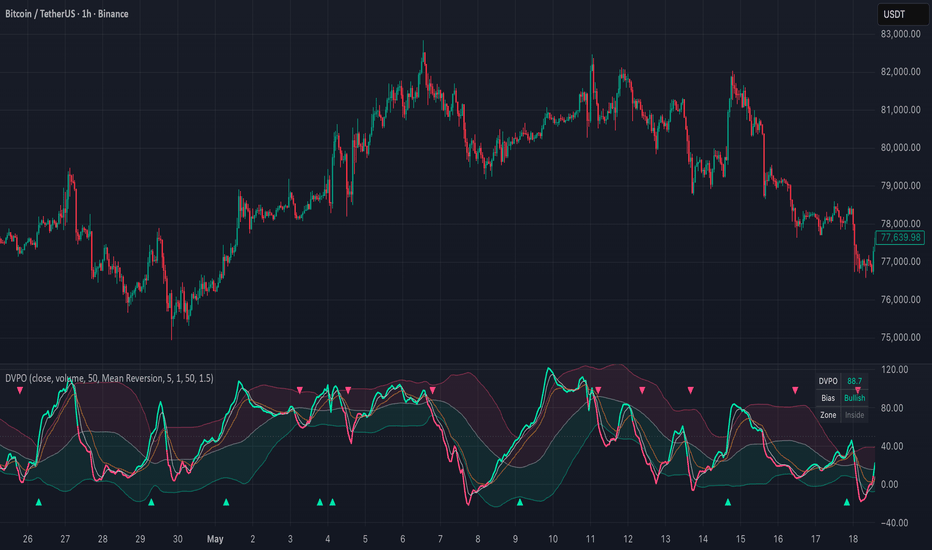
RSI Pattern Matcher & Forward ProjectionRSI Pattern Matcher & Forward Projection is an advanced RSI-based analysis tool
that combines historical pattern matching, statistical forward projection,
Bollinger Bands, and an EMA overlay — all applied directly on the RSI panel.
Instead of using RSI as a simple overbought/oversold indicator, this script
treats the RSI as a pattern signal. It scans hundreds of historical bars to find
past moments where RSI behavior and price direction closely matched the current
market structure, then statistically projects what RSI is most likely to do next.
### How It Works
The indicator builds a fingerprint of the current market using the last N bars
(Pattern Length), capturing:
- RSI value for each bar in the window
- Price direction per bar (rising, falling, or flat)
It then scans the full lookback window and marks a historical bar as a match when:
- Each RSI value falls within the defined tolerance (e.g. ±4 points per bar)
- At least 60% of the price direction steps align with the current pattern
Once matches are collected, the script averages what happened to RSI over the
following bars after each match. This averaged path is rendered as a step-by-step
dashed projection line extending to the right of the last bar.
Bollinger Bands (length 14, multiplier 2.0) and EMA 12 are computed on the RSI
itself — not on price. Both indicators are also extended forward by the same
projection length using linear slope extrapolation, giving a complete forward
context for the RSI forecast.
### What It Displays
RSI Line — main aqua line (standard RSI)
RSI EMA 12 — orange line tracking the short-term RSI average; crossovers
signal early momentum shifts
Bollinger Bands on RSI:
• Yellow middle band (SMA 14)
• Red upper band (overbought pressure zone)
• Green lower band (oversold pressure zone)
• Gray fill between bands
Forward Projection (dashed lines extending beyond last bar):
• RSI forecast path — averaged from historical analogs, color-coded by zone
• BB Upper extension — red dashed
• BB Lower extension — green dashed
• BB Basis extension — yellow dashed
• EMA 12 extension — orange dashed
Live RSI Label — current RSI value displayed next to the last bar,
color-coded in real time (red ≥ 70, green ≤ 30, aqua otherwise)
Forecast Label — projected RSI value shown at the end of the forward window
Info Table (top right):
• Matches found vs maximum
• Dominant directional bias (Up / Down / Flat)
• Direction distribution percentages
• Average, best-case, and worst-case price change across all matches
• Estimated RSI value N bars ahead
• Confidence score based on match count
### Confidence Score
≥ 10 matches → 90%
≥ 7 matches → 75%
≥ 5 matches → 60%
≥ 3 matches → 40%
< 3 matches → 20%
A warning is displayed on the table when fewer than 3 matches are found.
In this case, increase RSI Tolerance or Lookback to find more historical analogs.
### Inputs
RSI Period — RSI calculation length (default: 14)
RSI Source — price input for RSI (default: close)
Pattern Length — bars used to build the current pattern fingerprint (2–20, default: 3)
Projection Length — bars ahead to project all forward lines (1–20, default: 3)
RSI Tolerance — max RSI difference per bar allowed when matching (±0.5–10, default: ±4.0)
Lookback — historical bars to scan for matches (50–999, default: 500)
Max Matches — maximum historical matches to average (3–20, default: 10)
### How To Use
1. Add the indicator to any chart — it plots on a separate RSI panel
2. Check the info table for match count; if below 3, raise RSI Tolerance or Lookback
3. Read the dominant direction and confidence score for a quick bias assessment
4. Follow the dashed projection line to see where RSI is historically likely to go
5. Use the extended BB bands to anticipate whether RSI may reach overbought or
oversold territory within the projection window
6. Watch the EMA extension — if the projected RSI crosses above or below the
extended EMA, it can signal a momentum shift ahead
7. Compare the forecast RSI label against the 70 and 30 levels for reversal context
8. Use best-case and worst-case % change figures to frame risk/reward expectations
9. Higher timeframes (1H, 4H, Daily) generally produce cleaner RSI patterns
and more meaningful matches
### Best Used For
- Anticipating RSI direction before price confirms
- Identifying overbought/oversold exhaustion using historical analogs
- Spotting early momentum shifts via RSI EMA crossovers
- Using BB band position to contextualize RSI extremes
- Filtering trade entries with forward projection confluence
- Multi-layer RSI analysis combining pattern matching, bands, and trend
### Originality
This script combines four independent analytical layers into a single RSI panel:
a historical analog pattern matcher, a statistical forward projection engine,
Bollinger Bands applied to RSI (not price), and a linear slope extrapolation
system for all forward indicators. The specific combination — simultaneous RSI
and price direction fingerprinting, 60% direction alignment threshold, per-bar
averaged projection, and slope-based BB/EMA extension — represents the author's
own approach to making RSI forecasting both visual and statistically grounded.
### Disclaimer
This indicator is for educational and analytical purposes only. Pattern matching
based on historical RSI behavior does not guarantee future results. Past analogs
may not repeat. Always apply proper risk management and combine this tool with
additional analysis before making any trading decisions.
Short Description:
Scans historical RSI and price direction patterns to project the most likely RSI
path forward. Includes Bollinger Bands and EMA on RSI, full forward extension of
all indicators, directional bias stats, and a confidence score. Indikator

Strategi