Indikator

Indikator

Indikator

VWAP ORB Pullback StrategyThis strategy is an Opening Range Breakout pullback system that uses the first X minutes after the market open to define the opening range, then looks for breakout entries that pull back to VWAP for confirmation. It is designed to trade in the direction of momentum after the opening range is established, with ATR-based stop loss and profit target levels.
How it works
It records the opening range high and low during the first part of the session after the U.S. market opens at 9:30 AM New York time.
After the opening range period ends, it waits for price to break above the opening range high for longs or break below the opening range low for shorts.
For a long trade, price must also be above VWAP and the 9 EMA, and the candle must pull back to VWAP before entry.
For a short trade, price must be below VWAP and the 9 EMA, and the candle must retest VWAP from below before entry.
Risk management uses ATR(14) to set the stop loss and take profit automatically.
How to use it
Add the strategy to a chart on TradingView.
Use it on intraday timeframes such as 1-minute, 5-minute, or 15-minute charts.
Focus on liquid, trend-sensitive markets like large-cap stocks, futures, or ETFs.
Watch for the opening range to form after the market open.
After the opening range ends, the strategy will only trigger when breakout and pullback conditions align.
Settings explained
Opening Range Minutes
This controls how long the opening range lasts after the market opens.
Lower values, like 5 or 15, create a tighter opening range.
Higher values create a wider range and fewer signals.
Risk/Reward Ratio
This sets the profit target as a multiple of ATR.
A value of 1.5 means the target is 1.5 times ATR away from entry.
Higher values aim for bigger winners but may reduce win rate.
Use VWAP Filter
This toggles the VWAP condition on or off.
Enabled: trades require price confirmation around VWAP.
Disabled: the strategy still uses the opening range breakout logic, but removes VWAP as an extra filter.
Trading behavior
This strategy is meant to catch early-session momentum while avoiding low-quality breakout entries. The VWAP and EMA filters help confirm trend direction, while the pullback requirement is intended to improve entry quality instead of chasing extended moves. The ATR stop and target make the strategy adaptive to volatility.
Suggested description for TradingView
VWAP ORB Pullback Strategy combines the opening range breakout with VWAP and EMA pullback confirmation. It defines the opening range during the first user-defined minutes after the market open, then looks for price to break that range and retest VWAP before entering. Long trades require price above VWAP and the 9 EMA, while short trades require price below both. Exits are managed with ATR-based stop loss and take profit levels using the selected risk/reward ratio. Strategi

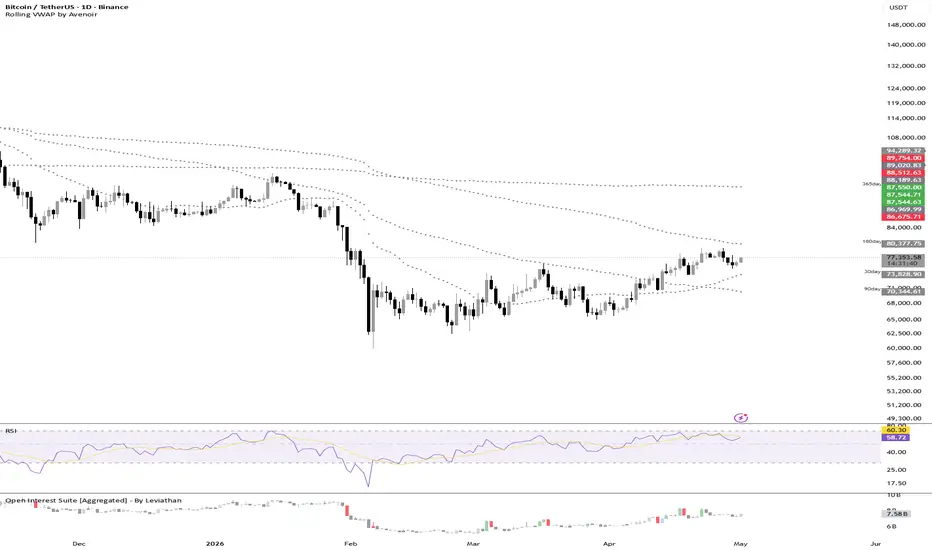
Rolling VWAP by AvenoirRolling VWAP by Avenoir
Plots up to five rolling VWAPs (7D, 30D, 90D, 180D, 365D) as dotted historical traces, with clean text labels on the right edge of the chart.
Features
Five toggleable lookbacks: 7, 30, 90, 180, and 365 days
Two calculation modes:
Daily Based — pulls daily data via request.security, so the VWAPs stay consistent regardless of your chart timeframe
Current Timeframe — calculates from the active chart timeframe using fixed bar lengths
Minimal styling: single line color, adjustable dot size, and label offset/nudge controls so the labels sit cleanly above each line
Labels redraw only on the last bar to keep the chart uncluttered
Use case
Useful for spotting where price sits relative to medium- and long-term volume-weighted averages — a quick read on whether an asset is trading above or below its rolling fair value across multiple horizons. Indikator

Fib 1-2-3-4 Vol/Delta/ProjOverview
This indicator automates a practical Fib 1–2–3–4 workflow on the chart: fractal-style swings define point 1 and point 2, retracements mark the discount/premium zone, and negative extensions mark take-profit style targets. It is built for fast markets (e.g. MNQ / NQ) but works on any symbol the chart supports.
Purpose
The goal is to keep the chart readable while still showing:
Where the active leg is (swing line + optional zone fill)
Key retracements (defaults favor 61.8%–88.6%; extras optional)
Extension levels (e.g. −12.7% / −27.2% / −61.8% style targets — toggles available)
Stop reference beyond point 1 (optional plot + buffer in ticks)
Optional BUY / SELL markers driven by a zone reclaim rule, plus matching alerts
Fib levels are treated as framework for stops and limits; entries are a heuristic (reclaim), not a guarantee.
Structure timeframe (2-minute friendly)
Swing & fib timeframe lets you anchor pivots and fib math to a chosen TF (default 2). On a 1m chart with structure set to 2, swings come from 2m while signals still use the chart’s closes for timing. When structure TF ≠ chart, built-in volume profile / delta / projection blocks stay off so bar math stays honest.
Zeiierman-style add-ons (optional, CC BY-NC-SA)
If enabled, optional Fib volume profile, Fib-band delta, and projection segments are adapted from Zeiierman’s published concept — non-commercial use only for those portions; see script header for license note.
Main features
Fractal pivots — configurable left/right bars (Fractals-style lag).
Clean preset — fewer lines; zone fill; optional swing leg.
Entry zone — configurable deep/shallow bounds (default 78.6%–88.6% style band).
BUY / SELL — label shapes + alerts on zone reclaim (deep touch + confirmed close through shallow edge); cooldown to reduce noise.
Optional mapping — swing labels, zone edge plots, fractal marks (mostly off by default).
Compact table — optional snapshot of bias, points, stop, targets.
How to use
Set Swing & fib timeframe to Chart on a 2m chart, or keep 2 on 1m for 2m legs with 1m entries.
Tune Left / Right bars to match how “noisy” you want swings.
Turn on Show targets / Show stop when you want full framework on chart.
Create alerts from the indicator’s Alerts tab (BUY / SELL, optional zone/extensions).
Disclaimer
This tool is for education and research only. It is not financial advice. Past behavior of any heuristic does not predict future results. You are responsible for your own risk, sizing, and compliance with your jurisdiction.
If your published script has a different name or you want this shorter (TradingView sometimes truncates), say the exact title and I’ll compress it to one tight block. Indikator
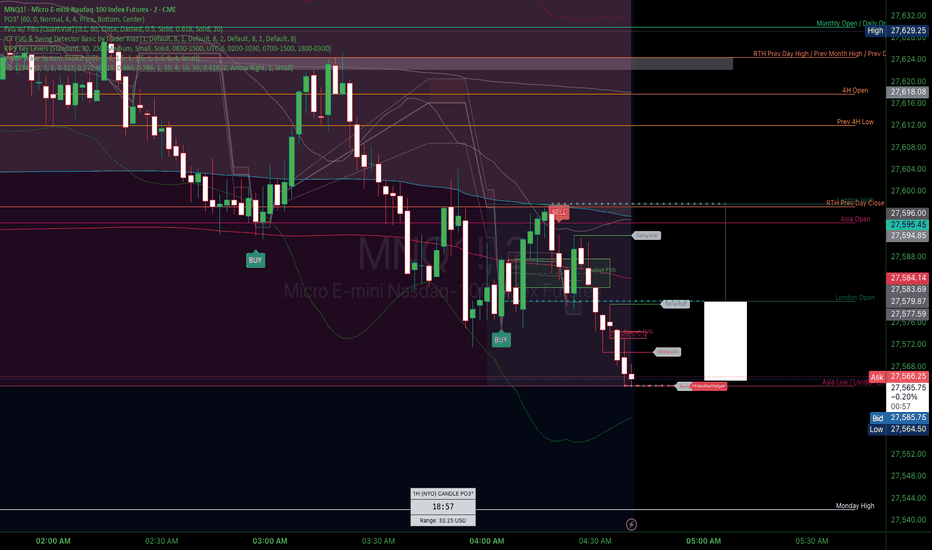
VWAP DELTA🇬🇧 ENGLISH
VWAP DELTA is a Volume Weighted Average Price that uses delta volume magnitude as its weighting factor instead of total volume. Unlike a standard VWAP — where every bar contributes proportionally to its raw volume — VWAP DELTA gives more weight to bars where buyers or sellers clearly dominated, and less weight to bars where volume was balanced between both sides. The result is a price level that better reflects where the market agreed during high-conviction moves.
HOW IT WORKS:
Delta volume is estimated from each candle's shape by splitting volume between buyers and sellers using the high-low range. Bars that close near the high have high buy delta; bars that close near the low have high sell delta. The VWAP is then computed weighting each price by the absolute value of its delta, so only directional pressure counts.
COMPONENTS:
1. Delta Volume — Estimated as: Buy Vol = Volume × (Close − Low) / (High − Low), Sell Vol = Volume × (High − Close) / (High − Low). Delta = Buy Vol − Sell Vol.
2. VWAP Delta — Formula: Sum(HLC3 × |Delta|) / Sum(|Delta|), anchored and reset at each new period (Session, Week, Month, Quarter or Year).
3. Standard Deviation Bands — Delta-weighted variance bands above and below the VWAP Delta, showing price extension during high-conviction moves. Useful as dynamic support and resistance zones.
4. Dynamic Color — The line turns teal when cumulative session delta is positive (buyers dominating the strong moves) and red when negative (sellers dominating). At a glance you know which side has been more active in the meaningful bars of the session.
USE CASES:
• Confirm the direction of "active money" — price above VWAP Delta means high-conviction moves were bullish.
• Filter false signals — balanced-volume candles barely move the indicator, reducing noise.
• Spot divergences — price rising but VWAP Delta lagging or falling signals a rally with weak buying conviction.
• Intraday bias — color tells you who dominated the strong bars of the session without reading order flow tools.
━━━━━━━━━━━━━━━━━━━━━━━━━━━━━━━━━━━━━━
🇪🇸 ESPAÑOL
VWAP DELTA es un Precio Medio Ponderado por Volumen que usa la magnitud del volumen delta como factor de ponderación en lugar del volumen total. A diferencia del VWAP estándar — donde cada vela contribuye de forma proporcional a su volumen bruto — VWAP DELTA otorga más peso a las velas donde compradores o vendedores dominaron claramente, y menos peso a las velas donde el volumen estuvo equilibrado entre ambos lados. El resultado es un nivel de precio que refleja mejor dónde acordó el mercado durante los movimientos de alta convicción.
CÓMO FUNCIONA:
El volumen delta se estima a partir de la forma de cada vela dividiendo el volumen entre compradores y vendedores usando el rango high-low. Las velas que cierran cerca del máximo tienen alto delta comprador; las que cierran cerca del mínimo tienen alto delta vendedor. El VWAP se calcula ponderando cada precio por el valor absoluto de su delta, de modo que sólo cuenta la presión direccional.
COMPONENTES:
1. Volumen Delta — Estimado como: Vol Comprador = Volumen × (Close − Low) / (High − Low), Vol Vendedor = Volumen × (High − Close) / (High − Low). Delta = Vol Comprador − Vol Vendedor.
2. VWAP Delta — Fórmula: Sum(HLC3 × |Delta|) / Sum(|Delta|), anclado y reiniciado en cada nuevo período (Sesión, Semana, Mes, Trimestre o Año).
3. Bandas de Desviación Estándar — Bandas de varianza ponderada por delta por encima y por debajo del VWAP Delta, que muestran la extensión del precio durante movimientos de alta convicción. Útiles como zonas dinámicas de soporte y resistencia.
4. Color Dinámico — La línea se muestra en verde azulado cuando el delta neto de la sesión es positivo (compradores dominando los movimientos fuertes) y en rojo cuando es negativo (vendedores dominando). De un vistazo sabes qué lado ha sido más activo en las velas importantes de la sesión.
CASOS DE USO:
• Confirmar la dirección del "dinero activo" — precio por encima del VWAP Delta significa que los movimientos de alta convicción fueron alcistas.
• Filtrar señales falsas — las velas de volumen equilibrado apenas mueven el indicador, reduciendo el ruido.
• Detectar divergencias — precio subiendo pero VWAP Delta plano o bajando señala un rally sin convicción compradora real.
• Sesgo intradiario — el color indica quién dominó las velas importantes de la sesión sin necesidad de herramientas de order flow. Indikator

Indikator
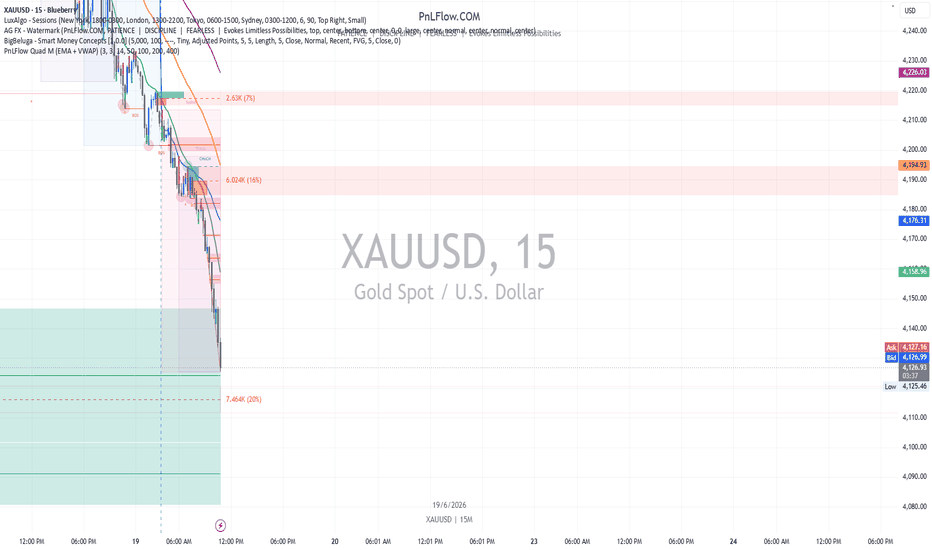
PnLFlow Triple M (EMA + VWAP)PnLFlow Triple M (EMA + VWAP) is a precision-based price action indicator designed to highlight liquidity wicks alongside key dynamic levels for high-probability trading decisions.
This tool identifies high and low wick rejections, helping traders spot potential liquidity sweeps and reversal zones in real time. It is combined with three essential moving averages (EMA 14, EMA 200, EMA 400) to provide short-term momentum, mid-term trend, and long-term directional bias.
Additionally, the built-in session VWAP offers a reliable institutional reference point for fair value, enhancing confluence in entries and exits.
Key Features:
Automatic detection of liquidity wicks (high/low sweeps)
EMA 14 (momentum), EMA 200 & 400 (trend structure)
Session VWAP for institutional price alignment
Clean and minimal visual design for clarity
Suitable for scalping, intraday, and swing trading
This indicator is ideal for traders who follow smart money concepts, liquidity-based trading, and structured market analysis, and want a simplified yet powerful visual tool. Indikator
Indikator

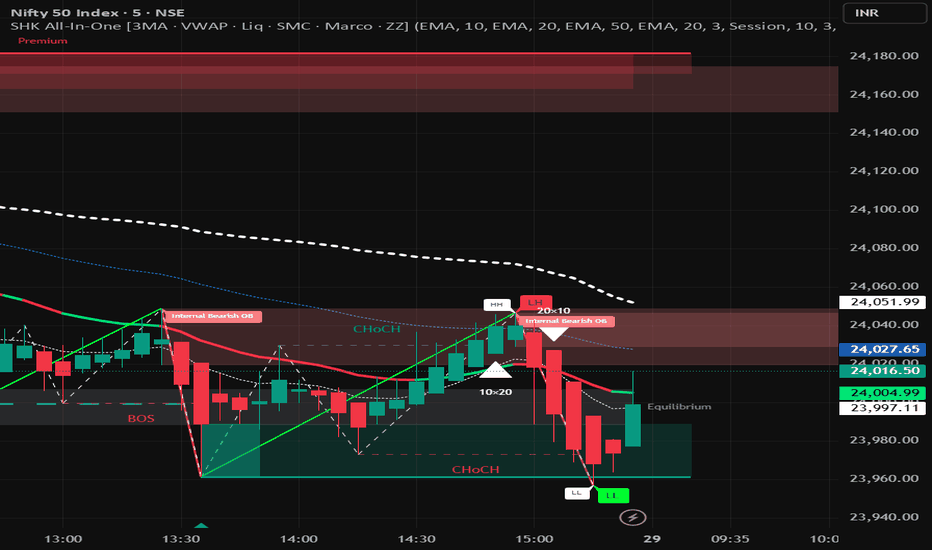
SHK All-In-One | 3MA - VWAP - Liq - SMC - Marco - ZZ╔══════════════════════════════════════════════════════════════════╗
║ SHK All-In-One ║
║ by SHK · Pine Script v6 ║
╚══════════════════════════════════════════════════════════════════╝
━━━━━━━━━━━━━━━━━━━━━━━━━━━━━━━━━━━━━━━━━━━━━━━━━━━━━━━━━━━━━━━━
🏅 CREDITS & ORIGINAL AUTHORS
━━━━━━━━━━━━━━━━━━━━━━━━━━━━━━━━━━━━━━━━━━━━━━━━━━━━━━━━━━━━━━━━
This script is a combined, extended and restructured version of
several outstanding open-source indicators. Full credit belongs
to the original authors listed below. I have only merged,
organised and added connecting logic.
① Smart Money Concepts (SMC)
→ Original: LuxAlgo — "SMC Lite" (open-source, TradingView)
→ Includes: BOS, CHoCH, Order Blocks, FVG, EQH/EQL,
MTF Levels, Premium/Discount Zones, STH/STL
② Liquidity Swings (BSL / SSL)
→ Original: LuxAlgo — "Liquidity Levels" (open-source)
→ Includes: Buy-Side & Sell-Side Liquidity zones,
sweep detection, volume/count filtering
③ Marco Polo Top Detective
→ Original: Marco Polo — community TradingView adaptation
→ Includes: Custom pivot top/bottom detection,
BBands 3-bar reversal confirmation
④ ZigZag Engine (Swing + Internal)
→ Original: Classic TradingView community ZigZag
(multiple open-source contributors)
→ Includes: Swing ZigZag with HH/HL/LH/LL labels,
Internal ZigZag with separate settings
⑤ UT Bot Filter (inside Signal MA)
→ Original: QuantNomad — "UT Bot Alert" (open-source)
→ Used as one of three Signal MA colour filters
⑥ Supertrend Filter (inside Signal MA)
→ Built-in ta.supertrend() — Pine Script standard library
→ Used as one of three Signal MA colour filters
⑦ 3 MA + Signal MA System + VWAP
→ Original work by SHK
→ Includes: 3 independent MAs, a colour-coded Signal MA
combining HA + Supertrend + UT Bot filters,
and an anchored VWAP
Combined, unified and extended by SHK.
━━━━━━━━━━━━━━━━━━━━━━━━━━━━━━━━━━━━━━━━━━━━━━━━━━━━━━━━━━━━━━━━
📌 WHAT IS THIS INDICATOR?
━━━━━━━━━━━━━━━━━━━━━━━━━━━━━━━━━━━━━━━━━━━━━━━━━━━━━━━━━━━━━━━━
SHK All-In-One brings together five of the most powerful
open-source market analysis tools into a single, clean,
modular indicator. Instead of adding 5 separate scripts to
your chart and dealing with clutter and conflicts, everything
lives in one place.
Each of the five modules can be INDEPENDENTLY TURNED ON OR OFF
using the Master Toggles at the top of the settings. Use only
what you need — run all five at once or pick just one.
Designed primarily for Indian markets (Nifty, BankNifty,
Sensex, MCX commodities) but works on any symbol and timeframe.
━━━━━━━━━━━━━━━━━━━━━━━━━━━━━━━━━━━━━━━━━━━━━━━━━━━━━━━━━━━━━━━━
① 3 MA + VWAP MODULE
━━━━━━━━━━━━━━━━━━━━━━━━━━━━━━━━━━━━━━━━━━━━━━━━━━━━━━━━━━━━━━━━
Three fully independent Moving Averages, each with its own
type, length and colour setting.
SUPPORTED MA TYPES:
• EMA — Exponential Moving Average
• SMA — Simple Moving Average
• WMA — Weighted Moving Average
• HMA — Hull Moving Average (smooth, low lag)
• TEMA — Triple EMA (very low lag)
• DEMA — Double EMA (reduced lag)
• ZLEMA — Zero-Lag EMA (lag corrected using looback)
All three MAs default to EMA 9 / 21 / 50 — the classic
short, medium and long-term trend framework.
SIGNAL MA:
A fourth moving average acts as a dynamic trend signal line.
It changes colour based on THREE combined market filters:
Filter 1 — Heiken Ashi:
Reads the Heiken Ashi close vs open to determine if price
action is in a bullish or bearish HA candle. Smooths out
noise from regular candles.
Filter 2 — Supertrend:
Uses ta.supertrend() with configurable ATR length and
factor. Adds a trend-following layer to the signal.
Filter 3 — UT Bot:
QuantNomad's UT Bot trailing stop logic using ATR.
Identifies momentum direction based on a key value
multiplier and ATR period.
Scoring system:
Each filter votes +1 (bullish) or -1 (bearish).
Total score > 0 → Signal MA turns GREEN (bullish)
Total score < 0 → Signal MA turns RED (bearish)
Total score = 0 → Signal MA turns GREY (neutral)
You can enable or disable any of the three filters
individually. Running all three gives the most robust signal.
MA CROSSOVER LABELS:
Whenever MA1 crosses MA2, or MA2 crosses MA3, a small
triangle label appears on the chart automatically.
Upward triangle = bullish cross (below bar)
Downward triangle = bearish cross (above bar)
The label shows the two MA lengths that crossed.
VWAP (Volume Weighted Average Price):
A fully anchored VWAP is included with anchor options:
Session / Week / Month / Quarter / Year
VWAP is calculated from scratch using cumulative
TPV (typical price × volume) for accuracy.
Displayed as a bold coloured line (default yellow).
━━━━━━━━━━━━━━━━━━━━━━━━━━━━━━━━━━━━━━━━━━━━━━━━━━━━━━━━━━━━━━━━
② LIQUIDITY SWINGS MODULE
━━━━━━━━━━━━━━━━━━━━━━━━━━━━━━━━━━━━━━━━━━━━━━━━━━━━━━━━━━━━━━━━
Identifies areas where resting liquidity (stop losses and
pending orders) is likely clustered above swing highs and
below swing lows. Based on LuxAlgo's Liquidity Levels logic.
HOW IT WORKS:
Uses ta.pivothigh() and ta.pivotlow() with a configurable
lookback length to detect swing pivot points.
For each detected swing high → marks a BSL zone
(Buy-Side Liquidity — stop losses of shorts clustered above)
For each detected swing low → marks a SSL zone
(Sell-Side Liquidity — stop losses of longs clustered below)
A horizontal line is drawn at the pivot level and extends
to the right until price sweeps through it.
When price closes beyond the level:
• Line turns DASHED
• Label updates to "✓ BSL Swept" or "✓ SSL Swept"
• Zone box fades
SWING AREA MODES:
Wick Extremity — Zone top/bottom uses the wick extreme
vs the candle body edge (tighter zone)
Full Range — Zone spans full candle high to low
FILTERING:
Filter by Count — minimum number of bars that touched
the zone (liquidity density)
Filter by Volume — minimum cumulative volume inside
the zone (institutional interest)
LABELS:
Each level shows "▲ Buy Side Liquidity" or
"▼ Sell Side Liquidity" with the cumulative volume.
Label size and BSL/SSL label size are configurable.
━━━━━━━━━━━━━━━━━━━━━━━━━━━━━━━━━━━━━━━━━━━━━━━━━━━━━━━━━━━━━━━━
③ SMART MONEY CONCEPTS (SMC) MODULE
━━━━━━━━━━━━━━━━━━━━━━━━━━━━━━━━━━━━━━━━━━━━━━━━━━━━━━━━━━━━━━━━
The most comprehensive module. Based on LuxAlgo's SMC Lite
open-source indicator, adapted and integrated for this script.
─── STRUCTURE ───────────────────────────────────────────────
SWING STRUCTURE:
Identifies the major market structure by tracking swing
highs and swing lows over a configurable lookback length.
BOS (Break of Structure):
Price closes beyond the last swing high/low in the
SAME direction as the current trend. Confirms trend
continuation.
CHoCH (Change of Character):
Price closes beyond the last swing high/low in the
OPPOSITE direction of the current trend. First signal
of a potential trend reversal.
A line is drawn from the broken level to the current bar,
labelled BOS or CHoCH. Bullish = green, Bearish = red.
INTERNAL STRUCTURE:
Same BOS/CHoCH logic applied to a shorter lookback (5 bars)
to catch intrabar / internal structure shifts.
Internal structure lines are dashed to distinguish from
swing structure.
Confluence Filter option: when enabled, only shows
internal structure that aligns with candle body direction
(filters out weak signals).
SWING POINTS:
Optional labels showing HH (Higher High), HL (Higher Low),
LH (Lower High), LL (Lower Low) at each pivot.
STRONG / WEAK HIGH-LOW LABELS:
STH (Short-Term High) and STL (Short-Term Low) mark the
most recent swing extreme. When both occur at the same
bar, shows a combined STH/STL label.
─── ORDER BLOCKS ────────────────────────────────────────────
Order Blocks are the last up/down candle before a BOS or
CHoCH. They represent areas where institutional orders
were placed and price is likely to react on a return visit.
INTERNAL ORDER BLOCKS:
Derived from internal structure BOS/CHoCH events.
Show the 5 most recent (configurable up to 20).
SWING ORDER BLOCKS:
Derived from swing structure BOS/CHoCH events.
Disabled by default (toggle on if needed).
OB FILTER:
ATR Filter — removes OBs from high-volatility candles
(candle range ≥ 2× ATR is excluded as noise)
Cumulative Mean Range Filter — uses average range
instead of ATR as the volatility measure
OB MITIGATION:
Close — OB is mitigated when price CLOSES inside it
High/Low — OB is mitigated when price WICKS into it
Each OB is drawn as a coloured box that extends to the
right until price mitigates it.
─── FAIR VALUE GAPS (FVG) ───────────────────────────────────
A Fair Value Gap is a 3-candle imbalance where:
Bullish FVG: candle 3 low > candle 1 high (gap up)
Bearish FVG: candle 3 high < candle 1 low (gap down)
FVGs are drawn as semi-transparent boxes.
Auto Threshold option filters out micro-gaps below
0.5× ATR (reduces noise).
Optional multi-timeframe FVG via timeframe input —
you can display FVGs from a higher timeframe on your
current chart.
─── EQUAL HIGHS / EQUAL LOWS (EQH/EQL) ─────────────────────
Detects when two consecutive swing highs or lows are within
a configurable ATR threshold of each other, indicating
clustered liquidity at that level.
Drawn as a dotted line between the two equal levels,
labelled EQH or EQL.
─── MULTI-TIMEFRAME HIGHS & LOWS ────────────────────────────
Draws the previous period's High and Low for:
• Daily (previous day high/low)
• Weekly (previous week high/low)
• Monthly (previous month high/low)
Each level has its own style (solid/dashed/dotted) and
colour. Useful as key support/resistance reference levels.
─── PREMIUM / DISCOUNT / EQUILIBRIUM ZONES ──────────────────
Based on the current swing high and swing low (trailing
extremes), the visible range is divided into three zones:
Premium Zone (top 5%):
Price is trading at a premium. Bearish bias —
institutions tend to SELL in premium.
Equilibrium Zone (middle 5% around 50%):
Price is at fair value. Neutral zone.
Discount Zone (bottom 5%):
Price is at a discount. Bullish bias —
institutions tend to BUY in discount.
Display modes:
Historical — draws ALL historical structure and OBs
Present — draws only the MOST RECENT instance
(cleaner chart for live trading)
Style modes:
Colored — standard green/red/blue colours
Monochrome — single grey tone (for minimal charts)
─── SMC ALERTS ──────────────────────────────────────────────
Full alert conditions available for:
Internal Bullish / Bearish BOS
Internal Bullish / Bearish CHoCH
Swing Bullish / Bearish BOS
Swing Bullish / Bearish CHoCH
Equal Highs / Equal Lows
Bullish / Bearish Fair Value Gap
Internal Bullish / Bearish Order Block (mitigated)
Swing Bullish / Bearish Order Block (mitigated)
━━━━━━━━━━━━━━━━━━━━━━━━━━━━━━━━━━━━━━━━━━━━━━━━━━━━━━━━━━━━━━━━
④ MARCO POLO TOP DETECTIVE MODULE
━━━━━━━━━━━━━━━━━━━━━━━━━━━━━━━━━━━━━━━━━━━━━━━━━━━━━━━━━━━━━━━━
A pivot detection tool that identifies significant swing
tops and bottoms using a custom algorithm — different from
the standard ta.pivothigh() approach.
PIVOT DETECTION:
Uses a rolling highest/lowest scan over a configurable
Depth. A pivot is confirmed only when the price found
deviates from the previous pivot by more than a threshold:
Threshold = ATR(10) / close × 100 × Deviation input
This prevents trivial micro-swings from being plotted and
focuses only on significant structural pivots.
Labels appear DEPTH bars back (offset) so they appear
at the actual pivot bar, not the confirmation bar.
→ "Top Pivot" label (red, above bar)
→ "Bot Pivot" label (blue, below bar)
BOLLINGER BANDS REVERSAL CONFIRMATION:
A second layer — the 3-bar BBands pattern — identifies
short-term exhaustion reversals:
Bear Reversal (bearish):
• 2 bars ago: close > BBands upper AND green candle
• 1 bar ago: close > BBands upper AND red candle
• Current bar: close < 1-bar-ago high
→ "Bear Rev" label (orange, above bar)
Bull Reversal (bullish):
• 2 bars ago: close < BBands lower AND red candle
• 1 bar ago: close < BBands lower AND green candle
• Current bar: close > 1-bar-ago low
→ "Bull Rev" label (lime green, below bar)
This pattern catches short-term mean-reversion setups
at Bollinger Band extremes with candle confirmation.
ALERTS:
Marco Top Detected — pivot top or bear reversal found
Marco Bottom Detected — pivot bottom or bull reversal
━━━━━━━━━━━━━━━━━━━━━━━━━━━━━━━━━━━━━━━━━━━━━━━━━━━━━━━━━━━━━━━━
⑤ ZIGZAG MODULE (SWING + INTERNAL)
━━━━━━━━━━━━━━━━━━━━━━━━━━━━━━━━━━━━━━━━━━━━━━━━━━━━━━━━━━━━━━━━
A dual ZigZag engine with a main Swing ZigZag and a
faster Internal ZigZag — each fully independent.
SWING ZIGZAG:
Depth — minimum bars before a pivot is confirmed
Deviation — minimum % price move required for a new leg
Backstep — minimum bars between two pivots
Each ZigZag leg is drawn as a line connecting consecutive
swing highs and lows. Bull legs (rising) and Bear legs
(falling) use separate configurable colours.
HH / HL / LH / LL LABELS:
Each pivot is automatically classified and labelled:
• HH — Higher High (bullish trend continuation)
• HL — Higher Low (bullish trend continuation)
• LH — Lower High (bearish trend continuation)
• LL — Lower Low (bearish trend continuation)
Label size is configurable (Tiny / Small / Normal).
INTERNAL ZIGZAG:
A faster ZigZag with smaller depth and deviation to
capture internal market structure swings within the
main ZigZag legs. Displayed with a different colour
and style (default dashed) to separate it visually
from the main swing ZigZag.
The internal ZigZag is disabled by default. Turn it on
in the Internal ZigZag settings group.
LINE STYLES (both ZigZags):
⎯⎯⎯ Solid
---- Dashed
···· Dotted
Line width: 1–4
━━━━━━━━━━━━━━━━━━━━━━━━━━━━━━━━━━━━━━━━━━━━━━━━━━━━━━━━━━━━━━━━
⚙️ SETTINGS OVERVIEW
━━━━━━━━━━━━━━━━━━━━━━━━━━━━━━━━━━━━━━━━━━━━━━━━━━━━━━━━━━━━━━━━
◆ Master Toggles
Enable / Disable each of the 5 modules independently.
① MA 1 / MA 2 / MA 3 — Type, Length, Colour
① Signal MA — Type, Length, Width, Bull/Bear/Neutral colours
① Signal MA Filters — HA toggle, Supertrend toggle, UT Bot toggle
① Supertrend — ATR Length, Factor
① UT Bot — Key Value, ATR Period
① VWAP — Show toggle, Anchor, Colour
② Liquidity Swings — Pivot Lookback, Swing Area mode
② Filter — Count or Volume, threshold value
② Style — Swing High colour, Swing Low colour,
area colours, label sizes, BSL/SSL labels
③ Smart Money Concepts — Mode (Historical/Present),
Style (Colored/Monochrome)
③ Internal Structure — Show toggle, Bull/Bear filter, label size,
Confluence Filter
③ Swing Structure — Show toggle, Bull/Bear filter, label size,
Swing Points toggle + length,
Strong/Weak High/Low toggle
③ Order Blocks — Internal OB toggle + size,
Swing OB toggle + size,
OB Filter type, OB Mitigation type,
4 individual OB colours
③ EQH/EQL — Show toggle, Bars Confirmation,
Threshold (ATR multiplier), Label size
③ Fair Value Gaps — Show toggle, Auto Threshold,
Timeframe, Bull/Bear colours, Extend
③ Highs & Lows MTF — Daily / Weekly / Monthly toggles,
style and colour for each
③ Premium & Discount — Show toggle, Premium / Equilibrium /
Discount zone colours
④ Marco Polo — Deviation, Depth, Text colour,
BBands Length, BBands Multiplier
⑤ Main ZigZag — Depth, Deviation, Backstep,
Bull/Bear colours, Width, Style,
HH/HL labels toggle + size
⑤ Internal ZigZag — Same settings as main ZigZag,
independently configured
━━━━━━━━━━━━━━━━━━━━━━━━━━━━━━━━━━━━━━━━━━━━━━━━━━━━━━━━━━━━━━━━
🔔 ALERTS SUMMARY
━━━━━━━━━━━━━━━━━━━━━━━━━━━━━━━━━━━━━━━━━━━━━━━━━━━━━━━━━━━━━━━━
SMC Alerts:
✦ Internal Bullish BOS ✦ Internal Bearish BOS
✦ Internal Bullish CHoCH ✦ Internal Bearish CHoCH
✦ Swing Bullish BOS ✦ Swing Bearish BOS
✦ Swing Bullish CHoCH ✦ Swing Bearish CHoCH
✦ Equal Highs ✦ Equal Lows
✦ Bullish Fair Value Gap ✦ Bearish Fair Value Gap
Marco Polo Alerts:
✦ Marco Top Detected (pivot top or bear reversal)
✦ Marco Bottom Detected (pivot bottom or bull reversal)
━━━━━━━━━━━━━━━━━━━━━━━━━━━━━━━━━━━━━━━━━━━━━━━━━━━━━━━━━━━━━━━━
📝 USAGE TIPS
━━━━━━━━━━━━━━━━━━━━━━━━━━━━━━━━━━━━━━━━━━━━━━━━━━━━━━━━━━━━━━━━
• On lower timeframes (1m–5m), disable Fair Value Gaps
and Swing Order Blocks to reduce visual clutter.
• For Nifty/BankNifty intraday, recommended setup:
Signal MA (EMA 20) with all 3 filters ON +
Liquidity Swings + Internal SMC structure only.
• For positional/swing trading, enable the full SMC
module with Historical mode to see all past structure.
• Use Master Toggles to turn off modules you don't need —
this significantly improves chart performance.
• ZigZag and SMC Swing Structure complement each other:
ZigZag shows the visual wave, SMC labels the reason
(BOS/CHoCH) at each pivot.
• Marco Polo works best on 15m and above for pivot
detection. On 1m it may generate excessive signals.
━━━━━━━━━━━━━━━━━━━━━━━━━━━━━━━━━━━━━━━━━━━━━━━━━━━━━━━━━━━━━━━━
📜 LICENSE
━━━━━━━━━━━━━━━━━━━━━━━━━━━━━━━━━━━━━━━━━━━━━━━━━━━━━━━━━━━━━━━━
CC BY-NC-SA 4.0 — Attribution-NonCommercial-ShareAlike 4.0
creativecommons.org
✅ Free to use for personal and educational purposes
✅ Free to share with proper credit to SHK and original authors
✅ Free to adapt and modify with credit and same license
❌ Commercial use is NOT permitted
❌ Cannot be republished as invite-only or paid script
━━━━━━━━━━━━━━━━━━━━━━━━━━━━━━━━━━━━━━━━━━━━━━━━━━━━━━━━━━━━━━━━
⚠️ DISCLAIMER
━━━━━━━━━━━━━━━━━━━━━━━━━━━━━━━━━━━━━━━━━━━━━━━━━━━━━━━━━━━━━━━━
This indicator is published for EDUCATIONAL and INFORMATIONAL
purposes only. It is NOT financial advice, investment advice,
or a recommendation to buy or sell any financial instrument.
Trading and investing in financial markets — including stocks,
indices, commodities, currencies and derivatives — involves
substantial risk of loss. Past performance of any indicator,
strategy or signal does NOT guarantee future results.
The signals, labels, zones and levels produced by this script
are based purely on mathematical calculations applied to
historical price and volume data. They do not predict the
future with certainty. No indicator can.
YOU are solely responsible for your own trading decisions.
Always do your own research and analysis before entering any
trade. Always use proper risk management — including stop
losses and position sizing — on every trade.
The author (SHK) and the original authors of all combined
modules (LuxAlgo, QuantNomad, Marco Polo, ZigZag community)
accept NO liability for any financial losses incurred from
the use of this script, directly or indirectly.
This script is provided "AS IS" without warranty of any kind,
express or implied. The author makes no guarantee that the
script will function correctly on all symbols, timeframes,
brokers or data feeds.
By using this script, you acknowledge and accept that:
• All trading decisions are made entirely at your own risk
• No profit is guaranteed by using this indicator
• The author bears zero responsibility for your P&L
If you are unsure about any trade, consult a registered
financial advisor before taking action.
Trade safe. Manage your risk. Protect your capital. 🙏
━━━━━━━━━━━━━━━━━━━━━━━━━━━━━━━━━━━━━━━━━━━━━━━━━━━━━━━━━━━━━━━━ Indikator
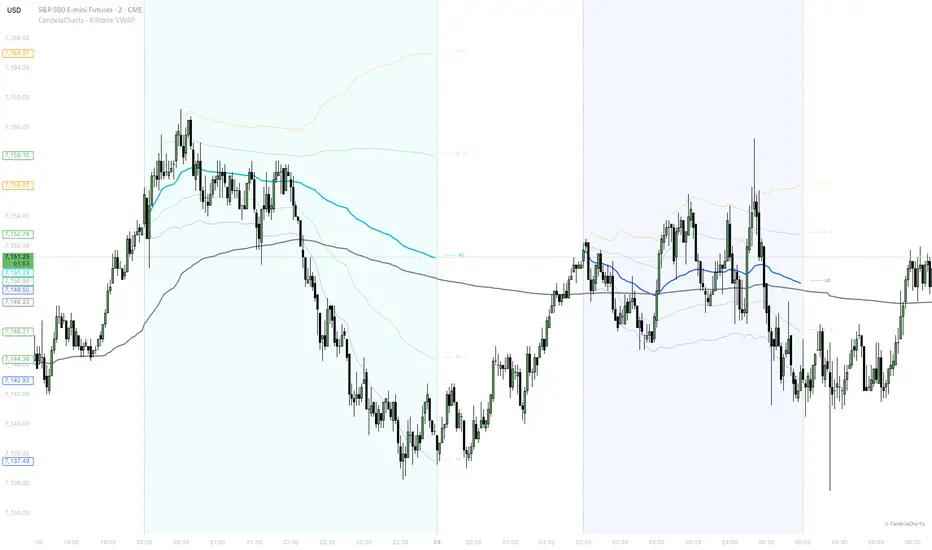
CandelaCharts - Killzone VWAP📝 Overview
The CandelaCharts - Killzone VWAP indicator provides a specialized Volume Weighted Average Price (VWAP) calculation for specific intraday sessions (Killzones) and the daily period. It includes advanced features like Standard Deviation bands and Rolling VWAP calculation, making it a powerful tool for volume-based trend analysis.
📦 Features
5 Customizable Sessions : Tracks VWAP across Asia, London, NY AM, NY Lunch, and NY PM sessions.
Daily VWAP Modes :
Classic : Resets at the start of each daily session.
Rolling : Provides a 24-hour continuous rolling average for a smoother representation of long-term volume-weighted price.
Standard Deviation Bands : Up to two levels of bands (±1, ±2) for volatility analysis and identifying overextended price levels.
Historical Labels : Automatically marks session-end levels with labels to identify where previous institutional interest concluded.
Session Backgrounds : Highlights active killzones with distinct background highlights for better visual organization.
Session Dividers : Clear vertical dividers with customizable line styles and widths.
⚙️ Settings
Source : Price source for VWAP calculation (default: `hlc3`).
StDev Mult (1 & 2) : Custom multipliers for the volatility bands.
Timezone : Supports Exchange, UTC, and America/New_York.
Line Width & Opacity : Customize the appearance of StDev bands.
Session Name & Time : Configure exact labels and windows.
Show Std Dev Bands : Toggle volatility bands for this specific session.
Show Labels : Toggle current and historical session-end labels.
Show Background & Divider : Visual organizers for the active period.
Daily VWAP : Toggle, choose calculation type (Classic/Rolling), and configure bands/labels.
Dividers : Global style, width, and color settings for vertical lines.
⚡️ Showcase
VWAP Line
VWAP with Standard Deviation Bands
Daily Rolling VWAP
Session Backgrounds and Session Dividers
🚨 Alerts
Standard TradingView alerts for session start/end can be configured based on the visualized periods.
⚠️ Disclaimer
Trading involves significant risk, and many participants may incur losses. The content on this site is not intended as financial advice and should not be interpreted as such. Decisions to buy, sell, hold, or trade securities, commodities, or other financial instruments carry inherent risks and are best made with guidance from qualified financial professionals. Past performance is not indicative of future results.
Indikator

BoaBias: Anchored Swing VWAP (MTF) - Touch, Alerts, Stats█ WHAT IT DOES
Chart timeframe: Multiple anchored VWAP curves from swing pivots—not session VWAP. Resistance-anchored paths (swing highs) and support-anchored paths (swing lows) draw as polylines and clear after confirmation (same rules as the inputs: one qualifying close or N bars in a row ). Optional touch markers when the bar range spans VWAP (green below / red above).
Higher timeframes: Optional HTF 1–3 reuse the same pivot + anchored-VWAP logic inside request.security with barmerge.gaps_off and barmerge.lookahead_off . Display as a ribbon (midline ± % of price) or stepped lines . Up to five concurrent VWAP slots per HTF (plot budget).
Alerts: Separate alert() channels—chart VWAP touches and optional HTF 1–3 midline touches when the chart bar’s range crosses the HTF VWAP. Prefixes: Chart VWAP touch / HTF VWAP touch with ticker, price, time, and touched lines on HTF. Create Alert → this script → Any alert() function call . Alert frequency input applies to every alert() from this script (once per bar / once per bar close / all ticks).
Reaction statistics (optional table): A compact on-chart table aggregates how closed swing-anchored lines behaved on the chart timeframe only —not HTF curves. Toggle in inputs; Show stats table is on in factory defaults for this build (disable to reduce on-chart load). Cohort splits include touched vs no-touch, K/M-style breakout vs bounce windows after first touch, ATR pierce vs hold, and simple marginal “first event” proxies (swing-side pivot, opposite-side VWAP range touch, close beyond last swing). Numbers are descriptive context, not trade signals or guaranteed forward behaviour. When the table is enabled, lifecycle logic shares a small Pine library module ( BoaBiasVwapSwingRxStats ) so stats stay aligned with line confirmation.
█ REACTION STATS TABLE — WHAT EACH ROW MEANS
Percent row labels use short tags: b = “ b ” bucket, br = “ br ” (break) bucket in the K/M and ATR rules defined in code (not a broker term). Counts and % are descriptive on history —not forecasts.
Row 0 (headers) — TF / Support / Resistance / All : TF shows the chart’s period. Columns 1–2 are support- and resistance-anchored closed lines. All = mixed view for FE totals and the combined line count.
Line 1 — n= and X lines : Support / Resistance show how many touched lines of that type finished (had at least one bar with range spanning VWAP before the line was confirmed and removed). The All cell shows the total completed lines: support + resistance anchors that were cleared by confirmation, including no-touch cases.
No-touch row: For lines that never had low ≤ VWAP ≤ high before the line was confirmed, split by S/R. Percent (where shown) = no-touch count ÷ all completed lines of that side (touched + no-touch).
K/M b% and K/M br% : Denominator = touched S/R lines only. After the first touch , the script tracks consecutive closes on the break side of VWAP (K bars) in a post-touch window, and a flag if that ever reaches K (see inputs). A line is bucketed as K/M br (break) if, at the confirmation bar, either: (1) the bar is still within M bars after the first touch, or (2) the K-hold was reached in the tracked window. Otherwise, among touched lines, it counts in K/M b ( b = non-`br` in this K/M sense). The All cell on the K/M rows shows the active K / M from inputs.
ATR b% and ATR br% : Denominator = touched S/R. Uses ATR = R ×ATR from VWAP (R and ATR length from inputs). A line is ATR br if, with touch, the confirmation bar is still within M_atr bars after the first touch or a pierce of that ATR band occurred in the tracked window. Otherwise the touched line is counted in ATR b . The All cell shows ATR length / R / M_atr used for the rule.
FE (marginal) rows — P(≥1) , P(swing) , P(opp) , P(cls) , P(none) : Only for touched lines: before confirmation, the script can record the first bar of three optional “events” if they occur. P(≥1): % where at least one event occurred. P(swing): a pivot of the favourable side (for a resistance-anchored line, a swing low bar is relevant; for support, a swing high ) is present in the path and used for the timing flag. P(opp): the range first crosses another active line of the opposite type (its VWAP in range). P(cls): close beyond the last recorded swing high (for support) or low (for resistance) before confirm. P(none): % where none of the three event types fired before the line closed. The All column pools S+R for the FE P(*) All percentages.
Avg life row: Average number of chart bars from the anchor to confirmation, over all completed lines. One merged cell in the table shows the value.
█ HOW IT WORKS
Pivots: ta.pivothigh / ta.pivotlow with configurable left/right length. Each anchor seeds cumulative typical-price × volume from the anchor forward; VWAP = cumulative TPV / cumulative volume along that line’s active segment.
Touch: low ≤ VWAP ≤ high on an active curve.
Confirmation: Line removal when closes satisfy the far-side rule after the minimum post-anchor bars— One bar or N bars in a row , per inputs.
HTF packaging: Same mechanics on selected higher TFs; values are pulled without lookahead from the security call.
Stats path: When the stats table is on, the script runs the shared library helpers so counters and polylines use the same confirmation and touch definitions as the visual path; HTF series do not feed those counters.
█ WHY THESE PIECES TOGETHER
Swing-anchored VWAP gives a volume path from structure; MTF ribbons or lines place that structure on a second axis of time; touch markers and alerts flag range overlap without claiming execution edges; optional stats summarize historical line outcomes for research. The bundle is one overlay for context and notification—not a black-box signal service.
█ HOW TO USE
First use: If the indicator appears in the wrong scale (squashed or fullscreen), right-click the indicator → Pin to scale → Pin to right scale.
Tune pivot length and confirmation mode; enable or disable touch markers, HTF layers, and each alert channel.
Add alert → this script → Any alert() function call ; respect HTF toggles and that HTF alerts need the HTF layer shown and a higher TF than the chart.
Higher-timeframe VWAPs: Show HTF 1–3 on the same chart to reduce time and clicks switching TFs. The higher-TF midlines/ribbons add structural context (where swing-based volume paths sit) without leaving the current timeframe.
Reaction stats: The optional table is on by default; turn it off if the on-chart table or extra compute is not needed. It aggregates how past closed chart-TF lines behaved (cohort splits, not a live edge claim). That helps reason about relative bounce/break and related counts on history—useful for testing hypotheses and ideas (what-if inputs, not guaranteed forward odds).
As a set: HTF + chart VWAP + optional stats supports exploring a wide range of VWAP interaction ideas on the same price history. Position it as a research and strategy-development layer (iterate rules on the chart, risk management stays separate)—not a turnkey signal.
█ LIMITATIONS
Meaningful volume improves the curves. Five HTF VWAP slots max per HTF (plot cap). HTF alerts use the midline VWAP, not ribbon edges. Stats are chart-TF only and historical. Structural / educational tool— not financial advice and not a substitute for independent risk management. Indikator

BoaBiasVwapSwingRxStatsLibrary "BoaBiasVwapSwingRxStats"
reset_slot_rx(idx, slotTouched, firstTouchBar, cohortConsec, kMetInWindow, atrMetInWindow, feFirstSwingBar, feFirstOppBar, feFirstBeyondBar, noTouchSent, feUnset)
Parameters:
idx (int)
slotTouched (array)
firstTouchBar (array)
cohortConsec (array)
kMetInWindow (array)
atrMetInWindow (array)
feFirstSwingBar (array)
feFirstOppBar (array)
feFirstBeyondBar (array)
noTouchSent (int)
feUnset (int)
chart_cum_pass(anchorBars, cumTPVs, cumVols, tested, maxLines, bar_index, high, low, close, volume)
Parameters:
anchorBars (array)
cumTPVs (array)
cumVols (array)
tested (array)
maxLines (int)
bar_index (int)
high (float)
low (float)
close (float)
volume (float)
chart_build_snap(snapVwap, anchorBars, cumTPVs, cumVols, tested, maxLines, bar_index)
Parameters:
snapVwap (array)
anchorBars (array)
cumTPVs (array)
cumVols (array)
tested (array)
maxLines (int)
bar_index (int)
chart_slot_rx_close(i, snapVwap, anchorBars, fromHigh, tested, consecBars, slotTouched, firstTouchBar, cohortConsec, kMetInWindow, atrMetInWindow, feFirstSwingBar, feFirstOppBar, feFirstBeyondBar, rxCounts, sumLifeHolder, bar_index, high, low, close, swingHighPx, swingLowPx, lastSwingHighPx, lastSwingLowPx, pivotLen, confirmMode, confirmBars, kHoldBars, mBarsAfterTouch, atrVal, atrRMult, mAtrWindow, noTouchSent, feUnset, maxLines)
Parameters:
i (int)
snapVwap (array)
anchorBars (array)
fromHigh (array)
tested (array)
consecBars (array)
slotTouched (array)
firstTouchBar (array)
cohortConsec (array)
kMetInWindow (array)
atrMetInWindow (array)
feFirstSwingBar (array)
feFirstOppBar (array)
feFirstBeyondBar (array)
rxCounts (array)
sumLifeHolder (array)
bar_index (int)
high (float)
low (float)
close (float)
swingHighPx (float)
swingLowPx (float)
lastSwingHighPx (float)
lastSwingLowPx (float)
pivotLen (int)
confirmMode (string)
confirmBars (int)
kHoldBars (int)
mBarsAfterTouch (int)
atrVal (float)
atrRMult (float)
mAtrWindow (int)
noTouchSent (int)
feUnset (int)
maxLines (int) Perpustakaan

Indikator

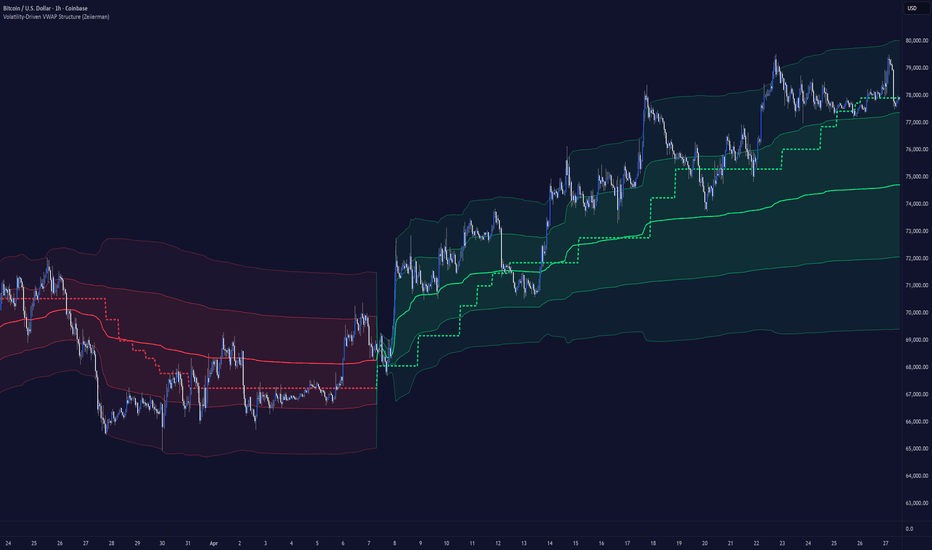
Volatility-Driven VWAP Structure (Zeiierman)█ Overview
Volatility-Driven VWAP Structure (Zeiierman) is a VWAP-based market structure tool that adapts its regime logic using volatility, Z-score normalization, and reversal-anchored VWAP profiles.
The script builds a rolling VWAP structure and adjusts its transition distance using an adaptive volatility engine. The result is a dynamic structure line that shifts only when VWAP displacement is strong enough relative to current volatility conditions.
When a structure reversal occurs, the script resets an anchored VWAP profile from that point and builds deviation bands around it, allowing traders to track the active post-reversal value area.
█ How It Works
⚪ Rolling VWAP Base
The script first calculates a rolling VWAP using price multiplied by volume over the selected lookback period.
float rollingVwap = math.sum(src * volume, vwapLengthInput) / math.sum(volume, vwapLengthInput)
This creates a volume-weighted fair value line that updates continuously without relying on fixed session, daily, weekly, or monthly anchors.
⚪ Adaptive Volatility Engine
The structure step is not fixed. It is based on ATR, a slow ATR comparison, and a Z-score volatility reading.
float atrZ = atrDev != 0 ? (atrFast - atrMean) / atrDev : 0.0
float volRatio = atrSlow != 0 ? atrFast / atrSlow : 1.0
This allows the script to identify whether volatility is currently expanding or contracting compared to its recent behavior.
⚪ Sigmoid Volatility Mapping
The volatility ratio and Z-score are blended into a sigmoid function.
float sigmoidInput = 4.0 * (volRatio - 1.0) + 0.75 * atrZClamped
float sigmoid = 1.0 / (1.0 + math.exp(-sigmoidInput))
The sigmoid smooths extreme volatility changes, converting them into a controlled, adaptive multiplier.
This helps prevent the structure from becoming too sensitive during noise while still expanding during stronger volatility regimes.
⚪ VWAP Structure Engine
The rolling VWAP is compared against adaptive upper and lower structure levels.
When VWAP expands far enough beyond the current structure range, the script shifts the structure higher or lower.
float upsideExpansion = rollingVwap - (structureUpper + structureStep)
float downsideExpansion = (structureLower - structureStep) - rollingVwap
If the expansion is strong enough, a new structure direction is assigned:
int nextDirection = expandsHigher ? 1 : expandsLower ? -1 : direction
This creates bullish and bearish VWAP structure regimes based on volume-weighted displacement, not just candle closes.
⚪ Structure Mean
The main plotted line is the midpoint of the active VWAP structure range.
float structureMid = (structureUpper + structureLower) / 2.0
This line acts as the active structure mean:
When the regime is bullish, it uses the bullish color.
When the regime is bearish, it uses the bearish color.
⚪ Reversal-Anchored VWAP Profile
Every time the VWAP structure reverses, a new anchored VWAP profile begins.
bool anchorReset = isReversed or na(anchorSumPV)
From that reversal point, the script accumulates:
price × volume
volume
price² × volume
These values are used to calculate the active anchored VWAP and its weighted deviation.
float anchoredVwap = anchorSumV != 0 ? anchorSumPV / anchorSumV : na
float anchoredDev = not na(anchoredVar) ? math.sqrt(math.max(anchoredVar, 0)) : na
This creates a fresh value profile after every structural shift.
⚪ Anchored Deviation Bands
The script plots one or two deviation bands around the reversal-anchored VWAP.
float anchorUpper1 = anchoredVwap + anchoredDev * bandMult1
float anchorLower1 = anchoredVwap - anchoredDev * bandMult1
These bands help visualize the active post-reversal value area and potential stretched-price zones.
█ How to Use
⚪ Read the Structure Mean
Bullish color → VWAP structure is in an upward regime
Bearish color → VWAP structure is in a downward regime
The structure mean can be used as a dynamic guide for trend bias, continuation, regime changes, and identifying good areas to look for retests on the mean.
⚪ Watch for Structure Reversals
A reversal occurs when the adaptive VWAP structure changes direction.
These reversals reset the anchored VWAP profile, marking the start of a new active value phase.
⚪ Use the Anchored VWAP
After a reversal, the anchored VWAP shows the volume-weighted average price from that new structure point.
Price above anchored VWAP → stronger bullish control
Price below anchored VWAP → stronger bearish control
⚪ Use the Deviation Bands
The deviation bands show how far the price has moved from the active anchored VWAP.
Band 1 → normal value expansion
Band 2 → stronger price extension
Touches of the outer bands can be used to identify extended conditions, reaction zones, or continuation pressure.
█ Settings
Rolling VWAP Length: Controls the lookback period for the rolling VWAP calculation.
Structure Multiplier: Controls how wide the adaptive structure transitions are.
Volatility Length: Controls the ATR length used in the volatility engine.
Band 1 Multiplier: Controls the first anchored VWAP deviation band.
Band 2 Multiplier: Controls the second anchored VWAP deviation band.
-----------------
Disclaimer
The content provided in my scripts, indicators, ideas, algorithms, and systems is for educational and informational purposes only. It does not constitute financial advice, investment recommendations, or a solicitation to buy or sell any financial instruments. I will not accept liability for any loss or damage, including without limitation any loss of profit, which may arise directly or indirectly from the use of or reliance on such information.
All investments involve risk, and the past performance of a security, industry, sector, market, financial product, trading strategy, backtest, or individual's trading does not guarantee future results or returns. Investors are fully responsible for any investment decisions they make. Such decisions should be based solely on an evaluation of their financial circumstances, investment objectives, risk tolerance, and liquidity needs.
Indikator
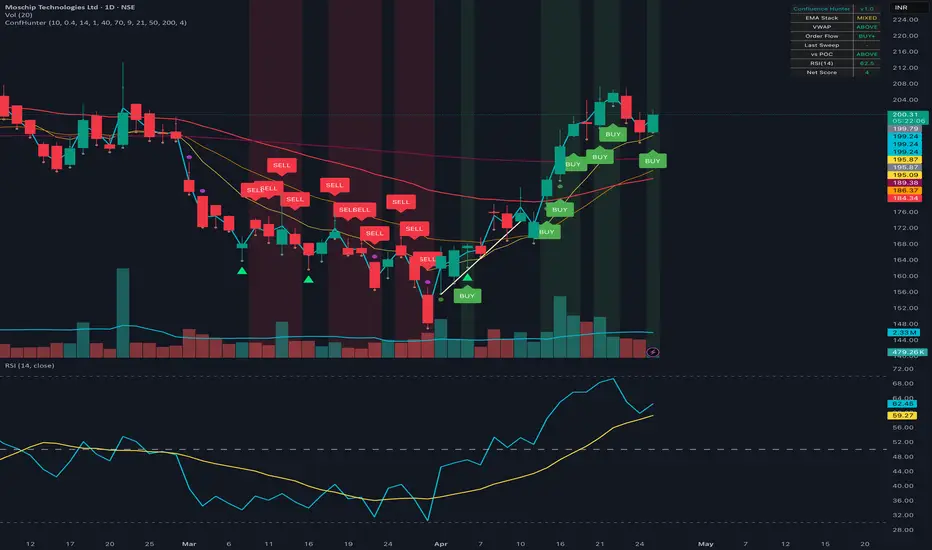
Confluence HunterConfluence Hunter is a multi-factor confluence engine that fuses six independent dimensions of market behavior into one signal. Instead of firing on a single condition (a moving average cross, an RSI level), it only triggers when at least 4 of 6 factors agree on the same bar — dramatically cutting false signals.
THE SIX FACTORS
1. EMA STACK (Trend) — 9 / 21 / 50 / 200 EMAs. Stacked up = uptrend; stacked down = downtrend; mixed = chop, stay out.
2. SESSION VWAP (Fair Value) — Volume-weighted average price anchored to the daily session, with a configurable ±σ band. Price above VWAP = bulls in control.
3. LIQUIDITY SWEEPS (Structure) — Detects stop hunts: bars that pierce a recent swing high/low and snap back with a strong rejection wick (≥40% of range by default). These are the highest-edge structural events on the chart and act as the trigger.
4. ORDER FLOW DELTA (Intent) — Bar-by-bar buy/sell pressure derived from close position within range × volume, smoothed with an EMA. Strong-delta bars are highlighted with circle markers below/above.
5. SESSION VOLUME PROFILE (Acceptance) — Plots POC, VAH, and VAL for the active session using a configurable bin count (default 40 rows) and Value Area % (default 70%). Trading above POC with the trend = strong continuation; below POC against the trend = caution.
6. RSI(14) (Momentum) — Tiebreaker confirming momentum supports the bias.
CONFLUENCE SCORING
Each factor returns +1 (bullish), 0 (neutral), or −1 (bearish). The dashboard in the top-right shows the live status of each. A green BUY label fires only when bullish count ≥ 4 AND bearish count ≤ 1 (defaults). The same logic mirrors for SELL labels.
HOW TO USE FOR STOCK SELECTION
Step 1 — Filter by regime: throw it on the daily chart of every name in your watchlist. Skip anything with a MIXED EMA stack or trading on the wrong side of the 200 EMA.
Step 2 — Rank by Net Score: cycle the survivors and rank by the dashboard's Net Score (bullCount − bearCount, max ±6). +5 or +6 = A-tier setup.
Step 3 — Wait for a structural trigger: don't enter at +6 alone (you're late). Wait for either a fresh BUY/SELL label or a sweep arrow near a key level (VWAP, POC, or VAL).
Step 4 — Confirm on lower timeframe: drop to 1H/15m and require the same bullish/bearish state. Multi-timeframe alignment cuts losers significantly.
ENTRY / STOP / TARGET FRAMEWORK
- Entry: close of the BUY/SELL bar, or pullback to VWAP / 9-21 EMA on the next bar.
- Stop: just beyond the wick of the sweep bar.
- Target 1: opposite VWAP band (take 50% off).
- Target 2: prior session POC or next swing high; trail rest with 21 EMA.
INPUTS
All factors are tunable: swing lookback, sweep strictness (wick ratio), VWAP band width, volume profile rows and value area %, EMA lengths, and minimum confluence threshold (default 4 of 6 — raise to 5 for fewer/cleaner signals, lower to 3 for more visual analysis).
ALERTS
Built-in alerts for: Confluence BUY, Confluence SELL, Bullish Liquidity Sweep, Bearish Liquidity Sweep.
LIMITATIONS
- The order-flow delta is a proxy from close-position-in-range × volume. Pine Script does not have access to real exchange tick/footprint data. It is directionally useful but not equivalent to true CVD.
- Volume Profile is session-anchored (resets daily), not visible-range. For multi-day profiles, layer TradingView's built-in Volume Profile Visible Range on top.
- For Forex (where volume is tick-based, not real volume) the OF and VP factors are weaker — lean more on EMAs + VWAP + sweeps.
Works on any market: equities, futures, commodities, crypto, forex. Best on 1H, 4H, and Daily timeframes.
This script is free and open-source. Feedback and forks welcome. Indikator

SHK 3 MA | SIGNAL STRENGTH MA [HA/ST/UT] | VWAP | TRIANGLE CROSS🔷 SHK 3 MA | Signal MA | VWAP | ▲▼ Cross Labels
An all-in-one trend-following overlay that combines three fully
customizable Moving Averages, an intelligent colour-coded Signal MA,
a manually anchored VWAP, and automatic triangle labels on every
MA crossover — all in a single clean indicator.
━━━━━━━━━━━━━━━━━━━━━━━━━━━━━━━
📐 THREE MOVING AVERAGES (MA 1 · MA 2 · MA 3)
━━━━━━━━━━━━━━━━━━━━━━━━━━━━━━━
Each MA is independently configurable with:
• Type — EMA | SMA | WMA | HMA | TEMA | DEMA | ZLEMA
• Length — 1 to 500
• Colour — fully customizable
Use them as trend bias lines, dynamic support/resistance,
or a classic 9/21/50 ribbon setup.
━━━━━━━━━━━━━━━━━━━━━━━━━━━━━━━
🎯 SIGNAL MA — 3-FILTER VOTING SYSTEM
━━━━━━━━━━━━━━━━━━━━━━━━━━━━━━━
A dedicated Signal MA whose colour dynamically reflects
market bias, scored from three independent filters:
✅ Heiken Ashi — Synthetic HA (non-repainting, real OHLC based)
✅ Supertrend — ATR-based trend direction
✅ UT Bot — ATR trailing stop momentum filter
🟢 Green = majority bullish (score > 0)
🔴 Red = majority bearish (score < 0)
⚪ Grey = conflicting / neutral (score = 0)
Each filter can be toggled ON/OFF independently.
Line width is also adjustable (1–5).
━━━━━━━━━━━━━━━━━━━━━━━━━━━━━━━
📊 VWAP (Manual Anchor)
━━━━━━━━━━━━━━━━━━━━━━━━━━━━━━━
Custom-built VWAP (not ta.vwap) with selectable anchor:
Session | Week | Month | Quarter | Year
The cumulative TPV/Volume resets cleanly at each anchor period,
giving accurate institutional price reference across all timeframes.
━━━━━━━━━━━━━━━━━━━━━━━━━━━━━━━
▲▼ MA CROSS LABELS
━━━━━━━━━━━━━━━━━━━━━━━━━━━━━━━
Triangle labels auto-plot at every crossover between:
• MA 1 × MA 2
• MA 2 × MA 3
▲ Up-triangle (below bar) = bullish cross
▼ Down-triangle (above bar) = bearish cross
Label text shows the exact period pair (e.g. 9×21).
Colour matches the respective MA colour. Up to 500 labels displayed.
━━━━━━━━━━━━━━━━━━━━━━━━━━━━━━━
🔔 ALERTS (6 pre-built conditions)
━━━━━━━━━━━━━━━━━━━━━━━━━━━━━━━
• MA1 crossed above/below MA2
• MA2 crossed above/below MA3
• Signal MA flipped Bullish 🟢
• Signal MA flipped Bearish 🔴
Signal MA flip alerts fire only once per state change
(not on every bar), keeping notifications clean and actionable.
━━━━━━━━━━━━━━━━━━━━━━━━━━━━━━━
⚙️ RECOMMENDED SETTINGS
━━━━━━━━━━━━━━━━━━━━━━━━━━━━━━━
Scalping / Intraday → 9 / 21 / 50 EMA | VWAP: Session
Swing Trading → 20 / 50 / 200 EMA | VWAP: Week/Month
All filters ON for strongest Signal MA confirmation.
━━━━━━━━━━━━━━━━━━━━━━━━━━━━━━━
📌 NOTES
━━━━━━━━━━━━━━━━━━━━━━━━━━━━━━━
• Built in Pine Script® v6
• Overlay indicator — works on any symbol and timeframe
• Heiken Ashi is synthetic (does not repaint real price values)
• UT Bot uses HA close as source for noise-filtered signals
• No repainting on MA or cross label logic
Best used on NSE / BSE instruments (Nifty, BankNifty, stocks)
on 5m, 15m, or 1H charts with all three filters enabled
for high-confidence trend confirmation.
━━━━━━━━━━━━━━━━━━━━━━━━━━━━━━━
⚠️ DISCLAIMER
━━━━━━━━━━━━━━━━━━━━━━━━━━━━━━━
This indicator is published for educational and informational
purposes only. It does not constitute financial advice, investment
recommendations, or a solicitation to buy or sell any financial
instrument.
All trading involves substantial risk of loss. Past performance
of any indicator or strategy does not guarantee future results.
You are solely responsible for your own trading decisions.
This script does not repaint on MA or cross label logic; however,
the Signal MA colour (HA · ST · UT filters) is calculated on the
current bar and may update until the bar closes. Always wait for
bar close confirmation before acting on any signal.
The author is not a SEBI-registered investment advisor.
Use this tool at your own risk. Always apply proper
risk management and consult a qualified financial professional
before making any trading decisions.
© SHK — All rights reserved. Please do not copy, reproduce,
or publish this script without the author's permission. Indikator

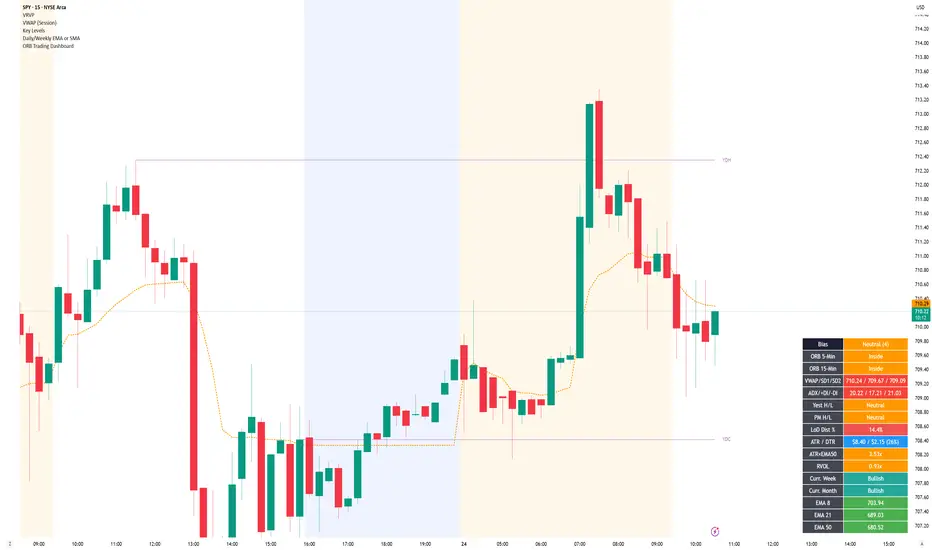
ORB Trading DashboardORB Trading Dashboard is a multi-factor intraday decision-support indicator built for fast market context.
It combines opening range behavior, trend structure, momentum, volume, and key levels into a single table with a weighted directional bias.
Features
Multi-timeframe ORB Status (5m / 15m / 30m)
Location-based ORB logic after each window completes
Bullish above ORB high
Bearish below ORB low
Inside = price within range
Time gates:
5m after 9:35 ET
15m after 9:45 ET
30m after 10:00 ET
Weighted Bias Model (max +/-21)
Converts multiple market factors into a single directional score
Bias states:
Strong Bull
Bullish
Lean Bull
Neutral
Lean Bear
Bearish
Strong Bear
EMA Trend Structure
Price vs Daily EMA 8 / 21 / 50 / 100 / 200
EMA stacking used to grade trend quality
VWAP Context with Volatility Bands
Session VWAP with SD1 / SD2 levels
Bias adjusts based on price relative to VWAP and SD1
Key Level Context
Yesterday high/low behavior
Premarket high/low behavior
Session position (top / mid / bottom of intraday range)
Higher Timeframe Directional Filter
Current week open status
Current month open status
Momentum & Participation
DMI / ADX direction and trend strength
Relative Volume (RVOL) confirmation or low-conviction penalty
Extension Awareness
ATR multiples from Daily EMA50 to identify trend health vs overextension
Practical Dashboard Metrics
LoD distance %
ATR / DTR %
RVOL
Weekly / monthly status
Optional EMA and key level plots
Settings
Display Options
Table position
Text size
Toggle rows:
ORB 5-Min
ORB 30-Min
Session High/Low
Toggle chart plots:
Daily EMA 8 / 21 / 50 / 100 / 200
Yesterday High/Low
Premarket High/Low
Alert Options
Enable 5-Min ORB alerts
Enable 15-Min ORB alerts
Enable 30-Min ORB alerts
Indicator Inputs
DMI/ADX length
ADX smoothing
How to Use
Use the bias score as a structured context layer, not as a standalone signal.
Combine it with your own entries, risk management, and session awareness.
Optional: How to Read the Table
Bias: composite directional score
ORB 5/15/30: opening range state (Bullish / Bearish / Inside)
VWAP / SD1 / SD2: mean and volatility context
ADX / DI: trend strength and direction
Key levels: yesterday, premarket, session positioning
Metrics: LoD %, ATR/DTR, ATR vs EMA50, RVOL
Disclaimer
This indicator is for educational and informational purposes only.
Always perform your own analysis and manage risk appropriately.
Indikator

VWAP Mensuel Auto-Ancre (3 Deviations)Monthly Auto-Anchored VWAP (3 Deviations) – Indicator Overview
Name: Monthly Auto-Anchored VWAP (3 Deviations)
Short Title: Monthly VWAP 3D
Type: Overlay Indicator (Plotted on Price Chart)
Key Features
This indicator calculates a Volume-Weighted Average Price (VWAP) anchored to the start of each month, providing a dynamic reference point for intramonth trading. It includes three customizable standard deviation bands, allowing traders to assess volatility, mean reversion zones, and potential support/resistance levels.
Customization Options
1. Calculation Settings
Source: Choose the price input (default: HLC/3).
Break Lines at New Month: Toggle whether to reset the VWAP and deviation lines at the start of each month.
2. Main VWAP Line
Visibility: Show/hide the primary VWAP line.
Appearance: Adjust color, line width (1–5), and style (solid, dashed, or dotted).
3. Deviation Bands (1–3)
Each deviation band is fully configurable:
Visibility: Show/hide individual bands.
Multiplier: Set the standard deviation multiplier (e.g., 1.0, 2.0, 3.0).
Appearance: Customize color, line width, and style (solid, dashed, or dotted).
How It Works
VWAP Calculation: Computes the volume-weighted average price from the start of the month, resetting automatically at month-end (or continuing seamlessly if disabled).
Standard Deviation Bands: Plots upper/lower bands based on the selected multipliers, helping identify overbought/oversold conditions relative to the monthly VWAP.
Auto-Anchoring: Eliminates manual anchor point selection, ideal for swing trading or intramonth analysis.
Use Cases
Trend Confirmation: Price above/below VWAP may signal bullish/bearish bias.
Mean Reversion: Deviations act as dynamic support/resistance zones.
Volatility Assessment: Wider bands indicate higher volatility; tighter bands suggest consolidation.
Why This Indicator?
Adaptive: Automatically adjusts to new monthly data.
Flexible: Customize bands to fit your trading strategy (e.g., tighter for scalping, wider for swing trading).
Clarity: Clean, non-cluttered visualization with user-defined styling.
Ideal for: Traders seeking a structured, volume-aware tool to gauge monthly trends and volatility without manual adjustments.
Personal Note :
"This indicator is like a wise old trader—it doesn’t just show you the average; it maps the battlefield of price and volume. Use it to spot when the market is stretching too far (deviations) or when it’s coiling for a move (VWAP as magnet). But remember: even the best tools need context. Combine it with volume spikes or momentum oscillators for higher-probability setups. And if the bands are too wide? The market’s whispering ‘caution’—listen." Indikator

VWAP Mensuel Auto-Ancre (3 Deviations)Monthly Auto-Anchored VWAP (3 Deviations) – Indicator Overview
Name: Monthly Auto-Anchored VWAP (3 Deviations)
Short Title: Monthly VWAP 3D
Type: Overlay Indicator (Plotted on Price Chart)
Key Features
This indicator calculates a Volume-Weighted Average Price (VWAP) anchored to the start of each month, providing a dynamic reference point for intramonth trading. It includes three customizable standard deviation bands, allowing traders to assess volatility, mean reversion zones, and potential support/resistance levels.
-Customization Options-
1. Calculation Settings
Source: Choose the price input (default: HLC/3).
Break Lines at New Month: Toggle whether to reset the VWAP and deviation lines at the start of each month.
2. Main VWAP Line
Visibility: Show/hide the primary VWAP line.
Appearance: Adjust color, line width (1–5), and style (solid, dashed, or dotted).
3. Deviation Bands (1–3)
Each deviation band is fully configurable:
Visibility: Show/hide individual bands.
Multiplier: Set the standard deviation multiplier (e.g., 1.0, 2.0, 3.0).
Appearance: Customize color, line width, and style (solid, dashed, or dotted).
-How It Works-
VWAP Calculation: Computes the volume-weighted average price from the start of the month, resetting automatically at month-end (or continuing seamlessly if disabled).
Standard Deviation Bands: Plots upper/lower bands based on the selected multipliers, helping identify overbought/oversold conditions relative to the monthly VWAP.
Auto-Anchoring: Eliminates manual anchor point selection, ideal for swing trading or intramonth analysis.
-Use Cases
Trend Confirmation: Price above/below VWAP may signal bullish/bearish bias.
Mean Reversion: Deviations act as dynamic support/resistance zones.
Volatility Assessment: Wider bands indicate higher volatility; tighter bands suggest consolidation.
-Why This Indicator?
Adaptive: Automatically adjusts to new monthly data.
Flexible: Customize bands to fit your trading strategy (e.g., tighter for scalping, wider for swing trading).
Clarity: Clean, non-cluttered visualization with user-defined styling.
Ideal for: Traders seeking a structured, volume-aware tool to gauge monthly trends and volatility without manual adjustments.
Personal note:
"This indicator is like a wise old trader—it doesn’t just show you the average; it maps the battlefield of price and volume. Use it to spot when the market is stretching too far (deviations) or when it’s coiling for a move (VWAP as magnet). But remember: even the best tools need context. Combine it with volume spikes or momentum oscillators for higher-probability setups. And if the bands are too wide? The market’s whispering ‘caution’—listen." Indikator

Indikator

VWAP Cross Flow Engine [AGPro Series]VWAP Cross Flow Engine
🔹 OVERVIEW
VWAP Cross Flow Engine is a precision scoring system for price-to-VWAP
crossovers. Instead of treating every VWAP cross as a binary signal,
this indicator measures the QUALITY of each crossover event in real
time using a weighted composite score derived from momentum, volume
expansion and optional sigma-band confluence. The engine is designed
for intraday scalpers and swing traders who rely on VWAP as a dynamic
equilibrium reference and need a structured way to separate high-
conviction continuation crosses from low-quality noise flips.
The script plots an anchored Volume-Weighted Average Price line with
optional volume-weighted standard-deviation bands, detects every
price/VWAP crossover event, scores each one on a 0–100 scale and
visualizes the result through compact X markers, directional bar
coloring, a retrospective quality dashboard and a dynamic bias zone
anchored on the strongest crosses.
🔸 UNIQUE EDGE
Most VWAP-based tools stop at plotting the line and marking raw
crossovers. VWAP Cross Flow Engine adds a multi-factor quality layer
on top of the crossover itself:
• Every cross receives a composite score, not a pass/fail flag
• Momentum sub-score derived from RSI distance from 50 at cross bar
• Volume sub-score derived from current volume vs SMA baseline
• Optional confluence bonus when cross occurs beyond 2-sigma envelope
• Retrospective follow-through measurement in ATR units
• Session-aware counters with automatic daily-vs-higher-timeframe
label switching
• ATR-based cooldown filter that prevents label overlap on any
timeframe, not just bar-count cooldowns that fail on daily charts
The combination of live scoring + retrospective success tracking in a
single panel is the core differentiator. It allows the trader to both
filter new crosses and study the historical reliability of VWAP cross
behavior on any symbol and timeframe.
🔷 METHODOLOGY
1. VWAP CALCULATION
Volume-weighted average of HLC3 (configurable) anchored to the
Session, Week or Month boundary. Cumulative price*volume and
cumulative volume series are reset at every anchor change.
2. SIGMA BANDS (optional)
Volume-weighted variance computed as E − E ² where X is the
source price weighted by volume. Square root produces the true
volume-weighted standard deviation. 1σ and 2σ envelopes are drawn
around the VWAP line.
3. CROSS DETECTION
Standard ta.crossover / ta.crossunder between close and VWAP.
4. QUALITY SCORING
• Momentum sub-score: |RSI(14) − 50|, scaled to 0–40 range
• Volume sub-score: volume / SMA(20), capped at 3x, scaled 0–30
• Confluence bonus: +5 if prior bar touched the opposing 2σ band
• Total live score (max 70 or 75) is rescaled to 0–100
5. COOLDOWN FILTER
A new cross is only plotted if BOTH conditions are met:
• At least N bars since the last plotted cross
• At least K × ATR price distance from the last plotted cross
6. FOLLOW-THROUGH TRACKING
Each cross is stored with its direction, price and ATR at the time
of the event. After N bars, the displacement (in the cross
direction) is measured. Success rate and average follow-through
in ATR units are maintained inside a rolling lookback window.
7. QUALITY ZONE
A rectangle zone (0.8 × ATR tall by default, 60 bars long) is
drawn at every strong cross (score ≥ 70). The zone acts as a
dynamic bias area anchored on high-conviction VWAP interactions.
🔶 SIGNALS & ALERTS
The indicator fires five distinct alert conditions:
1. High-Quality VWAP Cross Up — bullish cross above the min quality
threshold with cooldown satisfied.
2. High-Quality VWAP Cross Down — bearish cross above the min quality
threshold with cooldown satisfied.
3. Strong VWAP Cross (≥70) — score 70 or higher; anchors a new
quality zone.
4. Price Reached +2σ Band — price extended to the upper sigma band
(optional, requires bands enabled).
5. Price Reached −2σ Band — price extended to the lower sigma band
(optional, requires bands enabled).
🔹 KEY INPUTS
VWAP Reference
• Source — price series used for VWAP (default HLC3)
• Anchor Type — Session / Week / Month
• Show VWAP Line
Sigma Bands
• Show Sigma Bands (default OFF)
• Inner Band Multiplier (default 1.0)
• Outer Band Multiplier (default 2.0)
Quality Engine
• Momentum (RSI) Length
• Volume Average Length
• Follow-Through Bars
• ATR Length
• Min Quality To Plot (default 50)
• Use Sigma Confluence Bonus
• Cooldown — Minimum Bars (default 5)
• Cooldown — Minimum ATR Distance (default 0.5)
Visuals
• Show Cross X Labels
• Show Target Projection (default OFF)
• Show Quality Zone
• Quality Zone Height (ATR) / Length (Bars)
• Color Bars By Cross Strength
• Auto Label Size (upscale on 1D+)
Panel
• Show Dashboard Panel
• Panel Position (6 positions)
• Panel Theme (Dark / Light)
• Panel Font Size
• Success Rate Lookback Bars
🔸 HOW TO USE
• INTRADAY SCALPING — use Session anchor on 5m–1h charts. Focus on
crosses scoring 70 or higher. The quality zone becomes a short-term
bias area: price holding above a bull zone mid-line tends to favor
continuation, breaks back through the mid-line tend to indicate
weakening conviction.
• SWING BIAS — use Week or Month anchor on 4h and daily charts. Treat
strong crosses as potential regime-shift events. Monitor the
Success Rate metric to calibrate expectations for the current
market and instrument.
• MEAN-REVERSION — enable sigma bands and confluence bonus. Crosses
that form after a 2σ stretch tend to score higher and mark
statistically meaningful reversal attempts.
• FILTER CALIBRATION — raise Min Quality To Plot to 60 or 70 for
high-selectivity environments; lower to 40 for noisier instruments
where you want earlier confirmation.
The dashboard gives at-a-glance context: how many crosses have fired
this session, how many were strong, what the historical win rate
looks like in the current lookback window, the average ATR-normalized
follow-through, and whether price is currently above or below VWAP.
🔷 LIMITATIONS & TRANSPARENCY
• This is NOT a strategy and does not generate buy/sell orders.
• Score is a quality filter, not a directional prediction. A high-
score cross still carries market risk and can fail.
• Follow-through statistics depend on lookback window size and
timeframe; adjust Success Rate Lookback to match your trading
horizon.
• Sigma bands require a reliable volume feed. On low-liquidity
instruments the bands may be noisy or meaningless.
• Anchored VWAP resets at each new anchor (Session / Week / Month);
early-in-anchor values use fewer samples and are less stable.
• The indicator repaints only within the cross bar itself (like any
crossover detector). Once a bar closes, the plotted cross and its
score are fixed.
🔶 RISK DISCLOSURE
This script is a technical analysis tool intended for educational
and analytical purposes. It does not constitute financial advice,
investment advice or a recommendation to buy or sell any asset.
Trading financial markets involves substantial risk of loss. Past
performance of any indicator is not indicative of future results.
Users are fully responsible for their own trading decisions and
should combine this tool with independent analysis and proper risk
management. Indikator