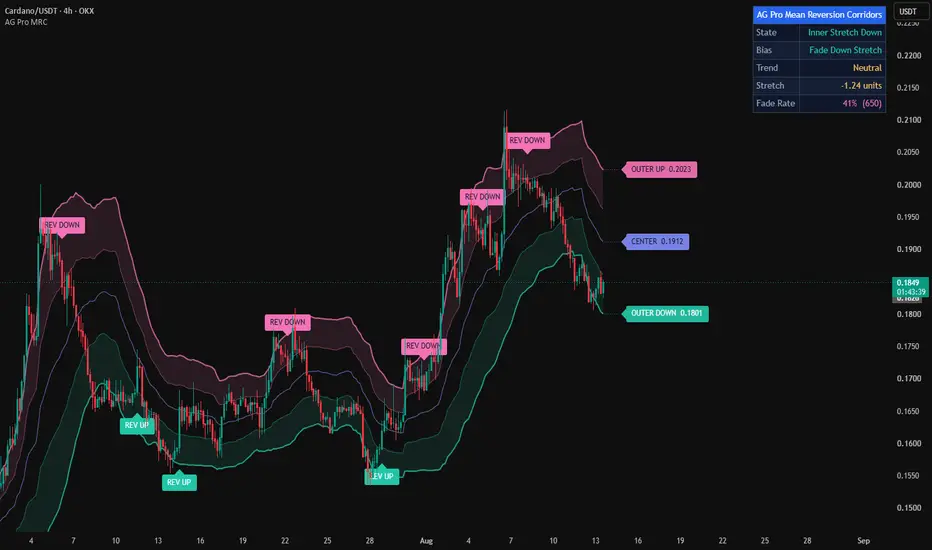
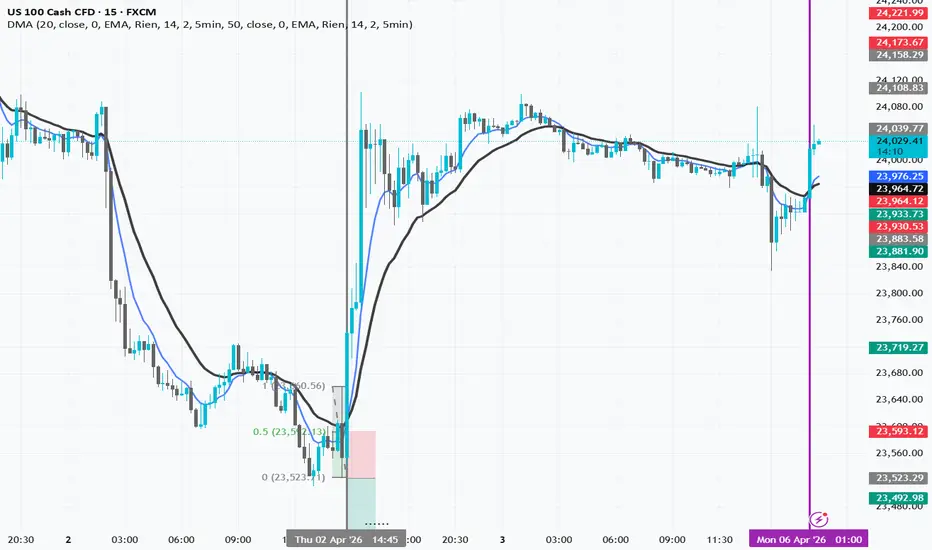
Smart AVWAPs## Smart AVWAPs
Smart AVWAPs is a multi-anchored VWAP indicator designed for swing traders who want to identify areas where several important volume-weighted price levels converge.
Instead of anchoring VWAPs to every minor swing, the indicator automatically creates AVWAPs from selected high-importance events:
* High relative volume swing highs and lows
* Earnings gaps
* 52-week highs and lows
* Major reversal candles with elevated volume
The indicator keeps the most recent active AVWAPs on the chart, making it easier to visually identify price zones where multiple anchored VWAPs overlap or compress.
### How to Use
AVWAP convergence can highlight areas where participants anchored to different market events have similar volume-weighted cost bases.
For swing trading, these areas can be monitored as potential support, resistance, consolidation, or breakout zones.
A typical workflow is:
1. Look for several AVWAPs converging within a narrow price range.
2. Observe how price behaves around the convergence area.
3. Wait for confirmation such as a strong breakout, reclaim, increased relative volume, or successful retest.
4. Use broader trend, market structure, and risk management before taking a position.
AVWAP convergence itself is not intended to be an automatic buy or sell signal.
### Inputs
**Active AVWAPs**
Controls the maximum number of recent AVWAP anchors displayed.
**Pivot Left / Right**
Controls the sensitivity of swing-high and swing-low detection.
**Minimum RVOL**
Requires a swing or reversal candle to have elevated volume relative to its recent average.
**Earnings Gap %**
Defines the minimum price gap required for an earnings event to create an anchor.
**Reversal ATR**
Controls how large a reversal candle must be relative to ATR before it qualifies as a significant anchor.
### Intended Use
The indicator is primarily designed for daily-chart swing trading, but the settings can be adjusted for other timeframes and trading styles.
It is best used as a visual confluence tool rather than as a standalone trading system.
For research and educational purposes only. This indicator does not provide financial advice or guarantee future mar
Indikator

Indikator

Auto AVWAP - Consecutive ViolationsAuto AVWAP with Consecutive Violation Control
This indicator plots automatically anchored Volume Weighted Average Price levels for potential support and resistance.
It maintains two primary Anchored VWAPs:
- High AVWAP: an upper reference derived from price highs or HLC3.
- Low AVWAP: a lower reference derived from price lows or HLC3.
It also calculates two developing “Next” AVWAPs. These represent potential future anchors identified through price extremes and Stochastic RSI conditions.
The main purpose of this version is to provide explicit control over when an active AVWAP is considered invalid. Unlike the original implementation, a main AVWAP is not replaced merely because a new price extreme appears or because the Stochastic RSI confirms a reversal. It remains active until price violates it for a configurable number of consecutive bars.
Core calculation
Each AVWAP is calculated as:
AVWAP = Sum(Price × Volume) / Sum(Volume)
By default, the indicator uses:
- High for the High AVWAP calculation.
- Low for the Low AVWAP calculation.
Users can disable the High/Low setting to calculate both AVWAPs from HLC3 instead.
Anchor candidate logic
Stochastic RSI and new price extremes are used to identify and maintain possible future anchor points.
The developing candidate levels are displayed as:
- High Next: potential future upper AVWAP.
- Low Next: potential future lower AVWAP.
These candidate levels can continue to develop without immediately replacing the active AVWAPs.
Consecutive violation control
A High AVWAP is considered violated when the selected price source is above it.
A Low AVWAP is considered violated when the selected price source is below it.
The active AVWAP is replaced only after the required number of consecutive violations has been reached. If a bar does not violate the level, the corresponding counter returns to zero.
This prevents a single wick, temporary breakout, or isolated close from prematurely replacing an established AVWAP.
Configurable violation source
The violation source can be selected from:
- Close: uses the candle close.
- Open: uses the candle open.
- High/Low: uses the high for High AVWAP violations and the low for Low AVWAP violations.
The “Count only closed bars” option prevents an unfinished real-time candle from temporarily increasing the violation counter.
Default configuration
The default configuration requires three consecutive confirmed closes:
- Consecutive bars to invalidate: 3
- Violation source: Close
- Count only closed bars: Enabled
This configuration is intended to filter isolated price excursions while allowing a sustained break to invalidate the active level.
Plots
The indicator displays:
- High AVWAP: primary upper reference.
- Low AVWAP: primary lower reference.
- High Next: developing upper candidate.
- Low Next: developing lower candidate.
The primary plots use stronger colors and greater width. Candidate plots use more transparent colors.
Alerts
The indicator includes alerts for:
- Breakout in either direction.
- High AVWAP resistance break.
- Low AVWAP support break.
- High AVWAP invalidation after consecutive violations.
- Low AVWAP invalidation after consecutive violations.
The breakout alerts can use either the candle open or close through the corresponding input.
How to use
- Treat the High AVWAP as a dynamic upper reference or potential resistance area.
- Treat the Low AVWAP as a dynamic lower reference or potential support area.
- Use the Next plots to monitor developing replacement anchors.
- Increase the required number of violations to retain AVWAPs for longer.
- Decrease it to make the indicator respond more quickly to sustained price breaks.
- Prefer confirmed closes when the objective is to reduce reactions to intrabar noise.
- Adjust the settings according to the symbol, timeframe, liquidity, and volatility regime.
- Combine the levels with market structure, volume analysis, and risk management.
Open-source reuse and credits
This script is based on the open-source indicator:
“Auto AVWAP (Anchored-VWAP)” by Electrified.
Original source:
This version adds and/or changes:
1) Consecutive-bar invalidation for the primary High and Low AVWAPs.
2) Configurable violation count.
3) Selectable Close, Open, or High/Low violation source.
4) Optional confirmed-bar-only counting.
5) Removal of automatic primary AVWAP replacement caused solely by new price extremes.
6) Removal of automatic primary AVWAP replacement caused solely by Stochastic RSI reversal confirmation.
7) Promotion of a developing candidate only after the active AVWAP satisfies its invalidation rule.
8) Dedicated High and Low AVWAP invalidation alerts.
9) Clear separation between candidate-anchor formation and active-level invalidation.
Limitations
- An AVWAP is a volume-weighted reference, not a guaranteed support or resistance level.
- Consecutive-bar confirmation introduces a deliberate delay before invalidation.
- Using High/Low as the violation source is more sensitive to intrabar price excursions.
- Candidate anchors depend on price extremes and Stochastic RSI behavior.
- Results vary across symbols, timeframes, sessions, and volatility regimes.
- Historical plots do not guarantee future market behavior.
- This is a decision-support tool, not a guaranteed-profit system.
- Risk management is required. Indikator

Stryk TrendsStryk: ATR Trends
Everything in this tool is measured in units of one master ATR. Change that one length and the whole indicator retunes together — the candle coloring, the compression reads, the reversal checks, and the trailing stop all use the same yardstick.
What it is
At the center is a composite value line: a weighted blend of seven EMAs (8 through 144) and a rolling volume-weighted average. The VWMA leans the line toward where volume actually transacted, and its window can auto-size to your chart timeframe so it covers a similar span whether you're on the 1-minute or the daily. Price tends to return to this line, and the whole tool reads price against it.
Candles color by distance from that line. Near it, they're neutral. The further price stretches away, the deeper the up or down color gets, reaching full saturation at a set ATR distance. A signal can also flip the candles to a solid color temporarily, so you can run the tool with every line hidden and still get the read from the candles alone.
The engines
Compression coil. A dedicated ATR is ranked into a percentile. When it compresses into the bottom of its range, the market is coiled. When the coil releases and price is at the same time over-extended from the composite, a fade marker prints back toward the line. One fire per release, inside a short window. A second marker can print if volume steps up afterward.
Compression release. A separate lens using Donchian width (highest high minus lowest low) ranked in the same percentile framework. When the envelope tightens and then releases, a marker prints in the direction of an ATR-normalized momentum read. This is not a Bollinger-inside-Keltner squeeze — it's built entirely in percentile space.
Reversal engine. Once price has stretched a set number of ATRs from the composite, the engine watches for the turn. It counts four independent checks: an RSI rollover, a close back inside the band around the line, a confirmed pivot, and a volume climax. When enough agree, a reversal marker prints — once per leg, and it won't re-arm until price comes back near the line. Pivots confirm after their right-side bars complete, so that check is delayed by design rather than repainting.
Whale and spike. A per-bar order-flow estimate built from close location and volume. Two whale reads fire from it: a fade of a volume spike where the delta ran against the move, and absorption — heavy delta into a bar that barely moved. Both can be gated by trend so you don't fade into a strong stretch. Bars at the extreme relative-volume threshold print a spike marker instead; the whale band sits below that threshold, so the two never fire on the same bar. The spike is an attention marker, not a directional call.
ATR trailing stop. A ratcheting volatility stop, either always on or armed by a coil fire. The default runs a tight 3/3 configuration as the real line, with a wider manual configuration drawn faintly beside it as a reference. The stop's ATR can be pulled from a higher timeframe, lookahead-off.
Volume participation. A volume EMA normalized 0 to 100 against its own recent range. Fifty is average. The extremes tint the background and the value sits in the status box.
Status box. One table on the chart reports every active engine on the last bar — stop side and level, compression stage, last reversal with its confluence count, last release, whale scenario, last spike, and participation. Rows light up when fresh and dim after a few bars. Every row can be toggled and the layout can run stacked or horizontal.
How I use it
Candle color is the base read. The coil and release tell me volatility compressed and which way it resolved. The reversal and whale engines flag exhaustion at the stretched edges. The trailing stop manages the rest. Each engine is independent — turn off what you don't use.
Originality
The rolling VWMA is the plain public-domain construction, sum(price x volume) / sum(volume), implemented directly with no external library. The compression framework — ATR-percentile coil plus Donchian-width release, scored in one percentile system — is original construction. Native built-ins only. Non-repainting on closed bars: higher-timeframe requests are lookahead-off on confirmed values, and alerts are meant for once-per-bar-close.
Notes
Built for standard candles only. The volume engines need a symbol with real volume, and the whale delta is an estimate from bar structure, not exchange order-flow data. This is an analysis tool, not advice, and it doesn't predict anything.
Indikator

Indikator

AlgoStorm Institutional VWAP Suite (IVS)AlgoStorm Institutional VWAP Suite (IVS)
A multi-anchor, institutional-grade VWAP framework covering five distinct time horizons simultaneously — Daily, Rolling Time-Window, NY, European/London, and Asian/Pacific — with volume-weighted standard deviation bands, a configurable color suite, a live info table, and full alert coverage.
The AlgoStorm Institutional VWAP Suite (IVS) is built on a single conviction: VWAP is not a single line, it is a layered structural map. Professional traders and institutions do not reference one VWAP — they read the relationship between multiple anchored VWAPs across sessions and time windows to understand where the auction is relative to where it has been. IVS makes this entire multi-anchor framework available in one cohesive, configurable overlay, designed for futures, equities, forex, and any instrument with reliable volume data.
Why Multiple VWAPs?
Each anchor tells a different story. The Daily VWAP defines where the current session is balanced. The Rolling VWAP reflects dynamic equilibrium over a configurable time window, acting as a responsive benchmark for swing and position traders. The session VWAPs — NY, London, and Asia — reveal the price acceptance or rejection developing within each regional trading block. When price holds above the NY VWAP but stalls beneath the Daily VWAP, that tension itself is actionable information. IVS maps all five references simultaneously so those relationships are always visible.
Technical Architecture
Each VWAP anchor is computed through a dedicated VwapInstance User-Defined Type (UDT). This object maintains the running sums required for both the VWAP price and the volume-weighted population standard deviation, using the mathematically correct formula σ² = E − E ² . Deviation bands derived from this are true volume-weighted standard deviations — not ATR estimates or fixed percentage offsets.
The Rolling VWAP runs on a High-Fidelity Sliding Time-Window Engine . Rather than anchoring to a calendar boundary, it maintains four parallel arrays (price-volume, volume, squared price-volume, and timestamps) to continuously evict data older than the user-defined window. This produces a genuinely time-accurate rolling VWAP at any timeframe, not a bar-count approximation.
Session resets (NY, London, Asia) use a one-minute anchor window via time("1", range, timezone) , which fires accurately across all chart timeframes — not just 1-minute charts.
Features & Functionality
Daily VWAP: Anchors at each calendar day open using hlc3 as the price source. Resets correctly on the first bar of every session including overnight gaps. Paired with optional volume-weighted standard deviation bands (two configurable multipliers for ±1σ and ±2σ levels).
Daily VWAP Wave (H/L): Plots two companion VWAPs anchored to the daily high and low respectively, with a filled channel between them. This "wave" shows the intraday auction range as a structural envelope rather than a single midline — price inside the wave indicates balance, price outside indicates initiative direction.
Rolling Time-Window VWAP: Fully configurable window in days, hours, and minutes. Defaults to 1 day. Paired with optional volume-weighted standard deviation bands. Unlike a fixed daily anchor, the rolling VWAP adapts continuously, making it a natural trend reference for intraday and swing traders.
NY Session VWAP: Anchors at 09:30 ET (New York open). The primary reference for equities and US futures RTH participants. Resets each session regardless of the chart's display timezone.
European / London Session VWAP: Configurable anchor at either 03:00 ET (London) or 02:00 ET (Frankfurt). Essential for tracking European institutional participation, particularly on DAX and EUR/USD.
Asian / Pacific Session VWAP: Configurable anchor at either 20:00 ET (Tokyo) or 18:00 ET (Sydney). Useful for establishing overnight reference levels and identifying the range that NY will either accept or reject at the open.
Color Suite: Every line has an independently configurable color input. The defaults (Silver, White, Blue, Lime, Red, Yellow) are chosen for visual hierarchy on dark themes, but each can be adjusted for light themes, personal preference, or multi-indicator setups.
Live VWAP Info Table: An optional on-chart table (top-right, togglable) displaying the current numeric value of all six active VWAP levels, color-coded to match their respective lines. Values display as — for any anchor that has not yet reset in the current session. Populated only on the last bar to avoid unnecessary per-bar overhead.
10 Alert Conditions: Cross-above and cross-below alerts for every VWAP line. Alerts fire on bar close (confirmed bar only) to prevent repainting. Each message includes {{ticker}} and {{close}} placeholders for use in webhook automations or notification routing.
Usage Guide
For intraday futures traders (ES, NQ, DAX): Enable the Daily VWAP Wave and NY VWAP as your primary references. Price reclaiming the NY VWAP after a morning flush is a high-probability mean-reversion setup. Price pushing beyond the Daily Wave High with sustained delta confirms initiative buying.
For swing and multi-day traders : The Rolling VWAP is your core tool. Set the window to 3-5 days and treat it as a dynamic fair value anchor. When price returns to the Rolling VWAP after extended deviation, evaluate whether volume supports continuation or reversal.
For session transition analysis : Enable all three session VWAPs. At the NY open, observe where price is relative to the Asian and London anchors. Acceptance above the London VWAP at NY open is structurally bullish. Rejection and failure below it signals continuation of overnight selling.
For deviation band usage : The ±1σ bands define the statistically normal range for the session. Extended moves to ±2σ with declining volume are classic mean-reversion setups. Moves to ±2σ with expanding volume signal initiative behavior and potential trend continuation. Indikator

Indikator

VWRSI Crossovers & Extremes [The AI Trading Desk]VWRSI Crossovers & Extremes
By integrating real volume into the RSI calculation, this engine surfaces only the moves that have money behind them. The hype-driven wiggles get filtered. The conviction moves stand out.
And then it tells you exactly what to do.
Two clear ways to act — no guesswork:
🔥 Extreme Release Signals — the RSI mistake most traders make
Most traders are taught RSI wrong. They sell the second it crosses 70 and buy the second it crosses 30 — and then they watch the market keep ripping in the same direction without them, or worse, against them. Here's the truth: RSI can stay in extreme zones far longer than you expect. Selling overbought into a strong trend is how accounts bleed.
This indicator doesn't fire when RSI enters an extreme zone. It fires when VWRSI comes back out of one. An orange flash and a labeled Up or Dn triangle mark the exact bar where momentum returns to normal range — meaning the extreme is resolving, not building. You're not fighting the trend. You're acting once the move has cooled and momentum has rotated back to your side.
How to use it:
Wait for the orange flash + triangle — don't act when VWRSI hits 70 or 30, act when it leaves
Down triangle (Dn) at the top — overbought is resolving, momentum cooling, look for short setups or trim longs
Up triangle (Up) at the bottom — oversold is resolving, momentum reviving, look for long setups or cover shorts
Best paired with structure — confluence with key levels, prior swing points, or trendlines tightens the edge
🌊 Crossover Confirmation — the answer to chop and fake-outs
Raw VWRSI crosses happen all day. Most are noise. The trick is waiting for the VWRSI to cross its signal moving average — that's the moment when short-term momentum has shifted decisively against the smoothed average, not just twitched.
The fill color flips with the cross — green for bullish momentum, red for bearish. By waiting for this confirmed cross instead of acting on every wiggle, you skip the chop, dodge the fake-outs, and only enter when the regime has actually changed. It's slower, on purpose. That's the point.
How to use it:
Watch the cloud color — green means VWRSI is above its MA (bullish bias); red means below (bearish bias)
Enter on the flip — when the color changes, momentum has rotated. Trend traders take entries with the new direction.
Stay in until it flips back — exits trigger when the cloud color reverses, signaling the regime has changed again
Skip the in-between — when VWRSI is hugging the MA closely (thin cloud), the market is undecided. Wait for separation.
Why this hits different:
Volume integrated into momentum calculation — high-volume bars influence momentum more than low-volume drift. Real moves stand out.
Both tops AND bottoms flagged — most VWRSI tools only catch one side. This catches both, with equal clarity.
No mystery readings — every signal has a name and a job. If you can't explain what your indicator is telling you, you can't trust it.
Calm when the market is calm — no constant red clouds during chop. The line stays quiet so you don't overtrade.
Built for traders who are tired of:
Selling tops too early and watching the trend keep running
Buying every dip into oversold and getting steamrolled
Indicators that fire constantly but rarely matter
Beautiful clouds that look great in screenshots but trick you into bad entries
Two trade types. Three visual cues. Zero guesswork.
Defaults: VWRSI 14, MA 9, OB 70, OS 30 — fully customizable.
Built by The AI Trading Desk. Indikator
Strategi

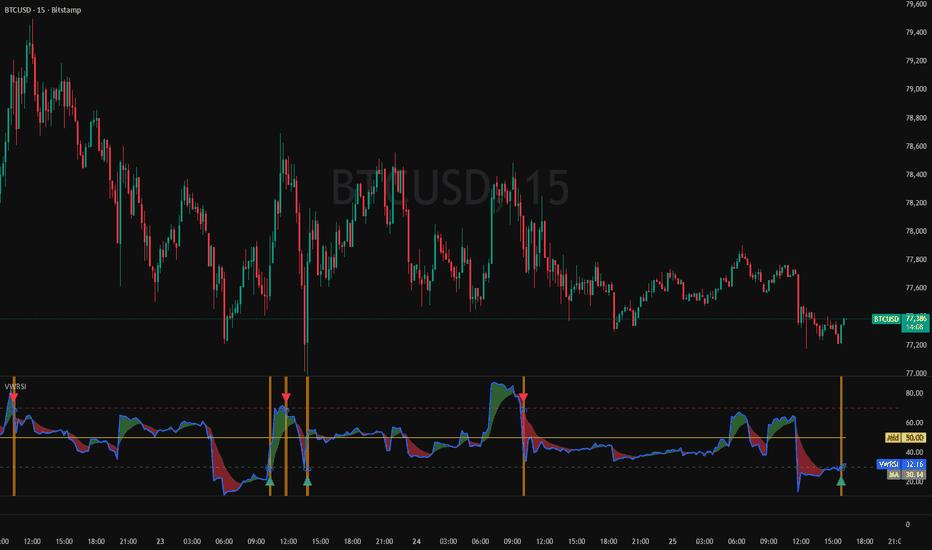
Mean Reversion Corridors [AGPro Series]Mean Reversion Corridors
🔹 Overview
Mean Reversion Corridors is a volatility-adaptive deviation framework that maps how far price has stretched from a chosen fair-value center and classifies that stretch into two actionable zones. An inner corridor marks the early reversion band where price is meaningfully extended but not yet extreme; an outer corridor marks statistical exhaustion where continuation becomes less probable under normal conditions. A higher-timeframe trend filter separates controlled mean reversion from failure-continuation expansions, so traders can tell fading the edge from respecting a real break — all from a single clean overlay.
🔸 Unique Edge
Most band systems (Bollinger, Keltner, ATR channels) offer a single width engine and a single band pair, leaving the trader to guess whether a tag is an exhaustion or a breakout. Mean Reversion Corridors is built around three ideas that work together:
- A dual-engine width unit that linearly blends ATR (range-based) and Standard Deviation (dispersion-based) so the corridor is stable on both gap-heavy and low-dispersion regimes.
- A two-layer corridor with distinct roles — inner for early stretch, outer for exhaustion — rendered as transparent zones you can read at a glance.
- A regime-aware state machine that uses a higher-timeframe trend filter to reclassify outer tags as either reversion candidates or failure-continuation, tracked as explicit REV and FAIL states with a bounded confirmation window.
🧠 Methodology
- Center Model — user choice of EMA, VWMA (volume-aware, default) or HMA (responsive), calculated on chart closes.
- Width Unit — the current volatility unit is a linear blend: (1 − blend) × ATR + blend × StDev, protected against empty volatility periods.
- Corridors — inner band at ±(width × inner multiplier), outer band at ±(width × outer multiplier). Stretch is reported in width-unit sigma.
- Trend Filter — the same center model is evaluated on a higher-timeframe via request.security with lookahead off, and its slope is normalized by ATR so the "strong" threshold is volatility-aware, not symbol-specific.
- State Machine — tracks the most recent outer-band extreme with a rolling 20-bar confirmation window. A reversion is confirmed only when price closes back inside the inner corridor and the trend filter is not strongly aligned with the original stretch. When the trend is strongly aligned, the outer break is reclassified as corridor failure (continuation).
- All conditions evaluate on confirmed bars to avoid repainting behavior.
⚡ Signals & Alerts
On-chart markers:
- REV — reversion confirmed back through the inner band after an outer extreme, trend-filtered.
- FAIL — corridor failure / trend-aligned continuation beyond the outer band.
Six bar-close alert conditions:
- Inner corridor entered — upside stretch
- Inner corridor entered — downside stretch
- Outer corridor hit — upside exhaustion
- Outer corridor hit — downside exhaustion
- Reversion confirmed
- Corridor failure (continuation)
⚙️ Key Inputs
- Center Model — EMA / VWMA / Hull
- Center Length and Volatility Length — independent lookbacks
- ATR ↔ StDev Blend — balance between range and dispersion engines
- Inner Corridor Width and Outer Corridor Width — in volatility units
- Trend Filter — enable, timeframe, length, strength threshold
- Visuals — outer-only mode, center line, fills, edge tags, state labels, label size
- Info Panel — show/hide, position (six options), font size
- Alerts — individually toggleable for each of the six events
📖 How to Use
- Start with the defaults on your main chart timeframe. The 34-period VWMA center, balanced blend and 1.0 / 2.2 inner/outer multipliers are chosen to work as a neutral starting point across liquid markets.
- Inner corridor tags are early stretch cues — they flag that price is extended, not that a turn is due. Use them as context for setups, not as standalone signals.
- Outer corridor tags with the trend filter neutral or opposed are the primary mean reversion setup; wait for a REV confirmation back inside the inner band before acting.
- When FAIL appears, the stretch is trend-aligned; treat the outer band as continuation, not resistance. This is the signal to stop fading.
- Use the Info Panel to read current state, reversion bias, trend regime and stretch magnitude in sigma at a glance.
⚠️ Limitations & Transparency
- This is an analytical tool, not a trading strategy or financial advice. It does not predict future price.
- Band-based classification assumes statistical behavior; during shocks, news events or illiquid sessions the width engine can lag.
- The trend filter uses a higher-timeframe slope — it reacts slower than short-term momentum by design, which is the intended behavior.
- Signals are evaluated on confirmed bars; intrabar crosses are not counted as events.
- Past behavior of any indicator does not guarantee future results. Always apply your own risk management. Indikator

Indikator

Spectra Inflection [JOAT]Spectra Inflection
Introduction
Spectra Inflection is an advanced open-source momentum oscillator that replaces conventional RSI with a Laguerre-domain filter, applies Jurik Moving Average (JMA) adaptive smoothing, and overlays a Zero-Lag EMA (ZEMA) signal line to produce a momentum reading with substantially less lag and noise than standard oscillators. The indicator then layers on Schmitt trigger state transitions, dynamic VWMA bands, gradient histogram rendering, momentum divergence detection, velocity and acceleration tracking, squeeze detection, exhaustion signals, and a comprehensive 16-row dashboard — all in a single pane.
This indicator exists because traditional momentum oscillators like RSI suffer from two fundamental problems: lag and noise. Lag causes late entries and exits. Noise causes false signals in choppy markets. Spectra Inflection addresses both by combining a Laguerre filter (which compresses price history into a shorter effective window without losing smoothness) with JMA adaptive smoothing (which tracks fast moves closely while filtering out chop). The result is a momentum curve that responds to genuine trend shifts quickly while remaining stable during consolidation.
Core Concepts
1. Laguerre RSI Core
The Laguerre filter is a four-element recursive filter originally developed by John Ehlers. Unlike a standard RSI that uses a fixed lookback window, the Laguerre filter uses a damping factor (alpha) to create an exponentially-weighted cascade of four internal registers (L0 through L3). This produces a smoother, more responsive oscillator:
float gamma = 1.0 - alpha
L0 := alpha * close + gamma * nz(L0 )
L1 := -gamma * L0 + nz(L0 ) + gamma * nz(L1 )
L2 := -gamma * L1 + nz(L1 ) + gamma * nz(L2 )
L3 := -gamma * L2 + nz(L2 ) + gamma * nz(L3 )
The cumulative up/down movements across all four registers are then computed to derive an RSI-like value scaled 0-100. Lower alpha values produce smoother output (more filtering), while higher values produce faster response. The default alpha of 0.07 provides a balance between responsiveness and noise rejection.
2. JMA Adaptive Smoothing
The raw Laguerre RSI output is then passed through a Jurik Moving Average, which is a proprietary-class adaptive filter. JMA uses a volatility-tracking mechanism to adjust its smoothing dynamically: when the input is volatile, JMA tracks more closely; when the input is stable, JMA smooths more aggressively. This means the momentum line hugs genuine reversals tightly while filtering out noise during consolidation. The JMA implementation uses three parameters: period (smoothing length), phase (lead/lag adjustment), and power (responsiveness curve).
3. ZEMA Signal Line
A Zero-Lag EMA is calculated on the JMA-smoothed momentum line. ZEMA works by computing two EMAs and extrapolating the difference to cancel out the inherent lag:
ema1 = ta.ema(src, len)
ema2 = ta.ema(ema1, len)
zema = ema1 + (ema1 - ema2)
Crossovers between the momentum line and the ZEMA signal line generate potential entry and exit signals. The indicator scores each crossover based on the angle of approach, distance from the midline, and volume context to produce a "cross quality" rating.
4. Schmitt Trigger State Machine
Rather than using simple threshold crossings (which produce whipsaws), the indicator uses a Schmitt trigger — a hysteresis-based state machine where the entry threshold differs from the exit threshold. For example, the momentum line must cross above 62 to enter a bullish state, but must drop below 55 to exit it. This prevents rapid flip-flopping in choppy conditions and produces cleaner, more tradeable state transitions.
5. Dynamic VWMA Bands
Volume-Weighted Moving Average bands are calculated around the momentum line. These bands expand when volume is high (indicating conviction) and contract when volume is low (indicating indecision). Price touching or exceeding the bands while momentum is extended signals potential exhaustion or continuation depending on the volume context.
Features
Gradient Histogram: A color-gradient histogram below the momentum line shows the distance from the midline (50). Colors shift smoothly from muted near the center to vivid at extremes, providing instant visual feedback on momentum intensity without cluttering the chart
Neon Glow Rendering: The main momentum line uses a multi-layer plot technique where progressively wider, more transparent copies of the line are stacked to create a subtle glow effect that intensifies with momentum strength
Momentum Divergence Detection: The indicator detects both regular and hidden divergences using fractal pivot anchoring. When price makes a new high but the Laguerre RSI makes a lower high (bearish divergence), or price makes a new low but the oscillator makes a higher low (bullish divergence), the indicator draws divergence lines and labels
Velocity and Acceleration Tracking: First and second derivatives of the momentum line are calculated and smoothed. Velocity shows the rate of momentum change; acceleration shows whether momentum is speeding up or slowing down. These are displayed in the dashboard
OB/OS Exhaustion Detection: When momentum reaches extreme overbought or oversold levels with declining velocity, the indicator flags potential exhaustion points where reversals are more likely
Cross Quality Scoring: Each momentum/signal crossover is scored 0-100 based on the angle of the cross, distance from the midline, and whether volume confirms the move. Higher scores indicate higher-conviction crosses
Band Squeeze Detection: When VWMA bands contract below a threshold, the indicator identifies a "squeeze" condition — compressed momentum that often precedes a sharp expansion move
Midline Conviction Signals: Crosses of the 50 midline are tracked with volume confirmation to identify shifts in the underlying momentum bias
Momentum Regime Classification: The dashboard classifies the current momentum state as Trending Bull, Trending Bear, Ranging, or Transitional based on the composite of all sub-systems
16-Row Dashboard: A comprehensive real-time table displays Laguerre RSI, JMA momentum, ZEMA signal, state, velocity, acceleration, cross quality, band width, squeeze status, divergence history, regime classification, and more
Input Parameters
Laguerre Core:
Alpha: Damping factor for the Laguerre filter (default: 0.07). Lower = smoother, higher = faster
JMA Smoothing:
Period: JMA smoothing length (default: 8)
Phase: Lead/lag adjustment from -100 to +100 (default: -50)
Power: Responsiveness curve (default: 0.6)
Signal Line:
ZEMA Length: Period for the zero-lag signal line (default: 13)
State Thresholds:
Bull Entry/Exit: Schmitt trigger thresholds for bullish state (default: 62/55)
Bear Entry/Exit: Schmitt trigger thresholds for bearish state (default: 38/45)
VWMA Bands:
Band Length: VWMA calculation period (default: 20)
Band Width: Multiplier for band distance (default: 1.5)
Visuals:
Toggles for histogram, glow, divergence lines, bar coloring, background zones, squeeze markers, and dashboard
How to Use This Indicator
Step 1: Identify the Momentum Regime
Check the dashboard's regime classification. In trending regimes, look for pullback entries in the direction of the trend. In ranging regimes, look for mean-reversion setups at the VWMA band extremes.
Step 2: Wait for Schmitt Trigger State Transitions
Rather than acting on every oscillator wiggle, wait for the Schmitt trigger to confirm a state change. A transition from neutral to bullish (momentum crossing above the bull threshold with hysteresis) is a higher-conviction signal than a simple RSI crossing 50.
Step 3: Confirm with Cross Quality
When a momentum/signal crossover occurs, check the cross quality score. Scores above 60 indicate strong, angled crosses with volume confirmation. Scores below 30 suggest weak, flat crosses that are more likely to fail.
Step 4: Watch for Divergences
Divergences between price and the Laguerre RSI often precede reversals. Regular divergences signal potential trend changes; hidden divergences signal trend continuation. Use these in conjunction with the regime classification for context.
Step 5: Monitor Squeeze and Exhaustion
Band squeezes indicate compressed momentum — prepare for a breakout. Exhaustion signals at OB/OS extremes with declining velocity suggest the current move is losing steam.
Indicator Limitations
Like all momentum oscillators, this indicator is a lagging derivative of price. It confirms moves rather than predicting them
The Laguerre filter's alpha parameter significantly affects behavior — values that work well on one timeframe or instrument may need adjustment for others
Divergence detection uses fractal pivots which require a right-bar confirmation delay (default 5 bars). Divergences are identified after the fact, not in real-time
The Schmitt trigger prevents whipsaws but also delays state transitions. In fast-moving markets, the state change may come after a significant portion of the move has already occurred
Volume-based features (VWMA bands, cross quality scoring) work best on instruments with reliable volume data. On forex or instruments with synthetic volume, these features may be less meaningful
This is a momentum tool, not a complete trading system. It should be combined with trend structure, support/resistance, and risk management for actual trading decisions
Originality Statement
This indicator is original in its synthesis of multiple advanced signal processing techniques into a unified momentum analysis system. While individual components (Laguerre filters, JMA smoothing, ZEMA, Schmitt triggers) are established concepts in technical analysis and signal processing, this indicator is justified because:
The Laguerre-to-JMA-to-ZEMA processing chain creates a momentum signal with properties not achievable by any single technique alone — the Laguerre provides the raw momentum extraction, JMA provides adaptive noise filtering, and ZEMA provides a lag-compensated reference
The Schmitt trigger state machine replaces simple threshold crossings with hysteresis-based transitions, substantially reducing false signals in choppy conditions
Cross quality scoring provides a quantitative measure of signal conviction that is not available in standard oscillator implementations
The integration of velocity, acceleration, exhaustion detection, squeeze detection, and divergence analysis into a single coherent pane eliminates the need for multiple separate indicators
Dynamic VWMA bands provide volume-contextual overbought/oversold boundaries rather than fixed levels
Disclaimer
This indicator is provided for educational and informational purposes only. It is not financial advice or a recommendation to buy or sell any financial instrument. Trading involves substantial risk of loss. Past performance of any indicator does not guarantee future results. The momentum readings, state classifications, and signals displayed are mathematical calculations based on historical price data — they do not predict future price movement. Always use proper risk management and conduct your own analysis before making trading decisions. The author is not responsible for any losses incurred from using this indicator.
-Made with passion by officialjackofalltrades
Indikator

5 EMA Multi-Timeframe Dashboard (Trend, Momentum & Entry Signals5 EMA Dashboard is a multi-timeframe trend and confirmation tool built for traders who want a quick visual read on market structure, trend direction, momentum, and possible entry signals.
This script plots the 200, 55, 34, 21, and 8 EMAs directly on the chart and displays a dashboard table that tracks trend structure across multiple timeframes: 1D, 15M, 5M, 2M, and 10S. Trend logic is based on full EMA stacking with price included, so bullish structure is defined as Price > 8 > 21 > 55 > 200, while bearish structure is the reverse.
The table highlights the active chart timeframe in yellow and shows whether each timeframe is bullish, bearish, or mixed. In addition, the script includes a confirmation section using a user-selected timeframe to evaluate whether the stock is “in play” based on trend alignment, momentum, and a TTM-style linear regression filter. It also flags possible entry conditions when price crosses above or below the 8 EMA or VWAP.
This makes the script useful for traders who want:
multi-timeframe trend alignment
quick bullish vs bearish structure checks
confirmation that a stock is actively trending
simple visual cues for possible EMA 8 or VWAP entries
You can also use this shorter version for the public library summary:
Multi-timeframe EMA dashboard that shows bullish, bearish, or mixed structure across 1D, 15M, 5M, 2M, and 10S using price + EMA stacking. Includes trend confirmation, momentum/TTM-style filters, and possible EMA 8 or VWAP entry signals in a movable on-chart table.
And if you want, here is a more polished “How it works” section too:
How it works
This script defines bullish structure as price above the 8 EMA, with the 8 above the 21, the 21 above the 55, and the 55 above the 200. Bearish structure is the exact opposite. If those conditions are not fully aligned, the script labels the timeframe as mixed. The dashboard then combines that structure with confirmation-timeframe momentum and entry logic to help traders quickly judge whether a stock is trending cleanly and whether a possible setup is forming.
Short Description
Multi-timeframe EMA dashboard showing bullish, bearish, or mixed structure using price + EMA stacking. Includes trend confirmation, momentum filters, and EMA 8 / VWAP entry signals in a movable table.
Full Description
Overview
The 5 EMA Multi-Timeframe Dashboard is a structured trading tool designed to help you quickly identify trend direction, confirm momentum, and spot potential entry opportunities—all in one view.
This script combines price action, EMA stacking, and momentum confirmation into a clean dashboard format, allowing traders to assess whether a stock is trending cleanly or in a choppy, non-tradeable state.
Key Features
1. Multi-Timeframe Trend Dashboard
Tracks structure across:
1 Day
15 Minute
5 Minute
2 Minute
10 Second (if supported)
Automatically highlights your current chart timeframe in yellow
Displays:
Structure (EMA alignment)
Trend (Bull / Bear / Mixed)
2. EMA Structure Logic (Core Edge)
Trend is defined using full EMA stacking with price included:
Bullish Structure:
Price > 8 EMA > 21 EMA > 55 EMA > 200 EMA
Bearish Structure:
Price < 8 EMA < 21 EMA < 55 EMA < 200 EMA
Mixed:
Any misalignment → indicates chop or low-quality setup
3. “Stock In Play” Confirmation
Uses a selectable confirmation timeframe (default: 2-minute) to determine if a stock is actively trending.
A stock is considered “In Play” when:
EMA structure is aligned (bullish or bearish)
Momentum is moving in the same direction
TTM-style linear regression filter supports the move
This helps filter out low-quality trades and focus only on stocks with real momentum.
4. Momentum & TTM-Style Filter
Momentum (10-period) confirms directional strength
TTM-style linear regression acts as a trend acceleration filter
Displays:
POS (Positive)
NEG (Negative)
FLAT
5. Entry Signals (Simple & Actionable)
Identifies potential entries on the confirmation timeframe:
EMA 8 Cross
Bullish: price crosses above EMA 8
Bearish: price crosses below EMA 8
VWAP Cross
Bullish: price crosses above VWAP
Bearish: price crosses below VWAP
These are labeled clearly in the dashboard for quick decision-making.
6. Fully Customizable Dashboard
Move the table anywhere on the chart:
Top / Bottom / Left / Right / Center
Adjustable font size for visibility
Works across different trading styles (scalping → intraday → swing)
🧠 How to Use
Step 1: Check Structure
Look for alignment across multiple timeframes
Best setups occur when 2M, 5M, and 15M agree
Step 2: Confirm “In Play”
Only trade when:
Trend = Bull or Bear
“In Play” = Confirmed
Momentum + TTM align
Step 3: Wait for Entry
EMA 8 or VWAP cross signals provide timing
Avoid chasing extended moves
⚠️ Important Notes
Lower timeframes (especially 10-second) depend on your TradingView data plan
Multi-timeframe values may slightly adjust in real-time due to how data is aggregated
Best used with confirmed setups—not as a standalone signal generator
🚀 Best For
Intraday traders
Scalpers
Momentum traders
Anyone using EMA-based strategies
⚠️ Disclaimer
This indicator is for educational and informational purposes only. It does not constitute financial advice. Always perform your own analysis and risk management. Indikator
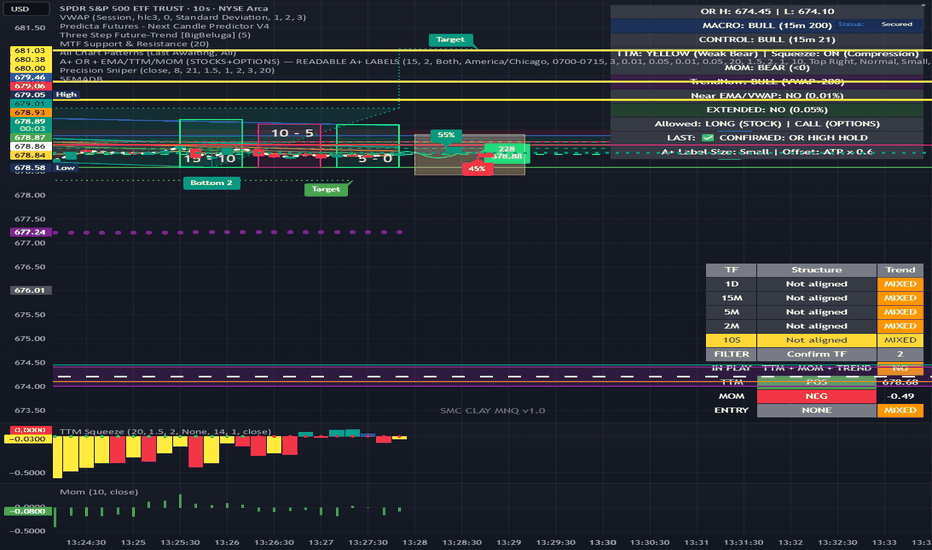
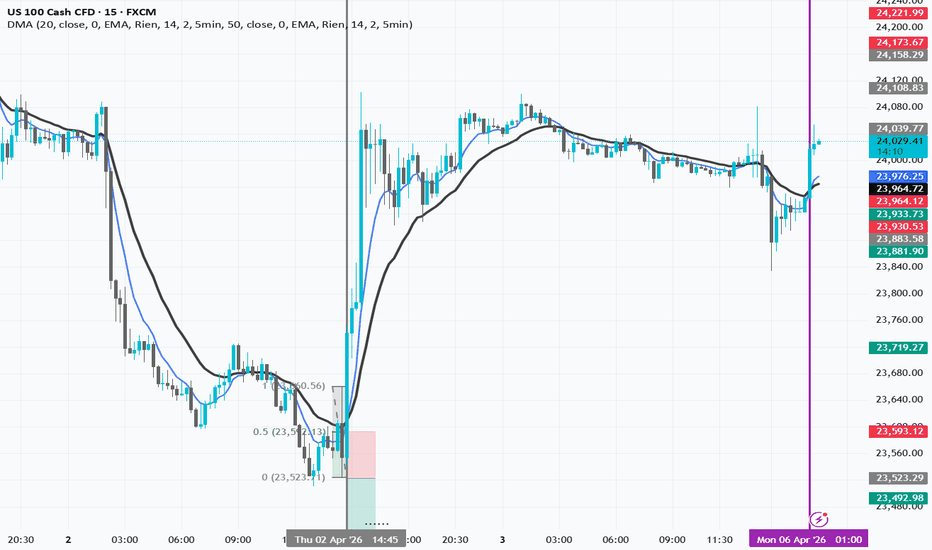
Double Moving Average## 📊 Double Moving Average (DMA)
**General Description:**
An indicator composed of two completely independent Moving Averages (MAs), each configured with its own parameters. Unlike a standard MA, each MA #1 and MA #2 can use a different timeframe, even if the chart displays another timeframe.
---
### **MA #1 - Parameters**
| Parameter | Default | Range | Description |
|-----------|---------|-------|-------------|
| **Enable MA #1** | ✓ | Yes/No | Activate/deactivate the first MA |
| **Length** | 50 | 1-500 | Calculation period of the MA |
| **Source** | Close | Open/High/Low/Close | Price source |
| **Offset** | 0 | 0-100 | Shift the curve to the right |
| **Type** | EMA | SMA/EMA/WMA | Type of moving average |
### **MA #2 - Parameters**
Identical to MA #1 but with default **Length: 200**
---
### **Smoothing - Per MA**
Each MA can have its own smoothing:
| Parameter | Options |
|-----------|---------|
| **Enable Smoothing** | Yes/No |
| **Type** | None / SMA / EMA / WMA |
| **Length** | 1-100 |
| **BB StdDev** | 0.1-10 (Bollinger Bands) |
---
### **Timeframe (Period) - Per MA**
Each MA calculates on an independent timeframe:
**Options:** 1min, 2min, 5min, 10min, 15min, 30min, 1hr, 2hr, 4hr, 1day
**"Wait for Close":** Waits for the timeframe candle to close before confirmation
---
### **Main Functions**
1. **`f_convert_timeframe()`** - Converts timeframe formats for Pine Script
2. **`f_calculate_ma()`** - Calculates SMA, EMA, or WMA
3. **`f_apply_smoothing()`** - Applies smoothing if enabled
---
### **Use Cases**
- Display short-term MA (5min) for scalping
- Display long-term MA (1day) for overall trend
- All on the same chart, independent of the displayed timeframe
- Compare two different trend periods simultaneously Indikator
AG Pro VWMA Dislocation Map [AGPro Series]AG Pro VWMA Dislocation Map
OVERVIEW
AG Pro VWMA Dislocation Map is a state-based charting tool designed to measure how far price is trading from its volume-weighted mean, how persistent that displacement has become, and whether the move is still expanding or beginning to normalize.
This script is built around a simple but often underexplored idea: distance from a moving average is not equally meaningful in all situations. A small deviation can matter when it is persistent and building under directional participation, while a larger deviation can become less informative when the move is already mature and beginning to contract. Instead of treating every separation from the mean as identical, this script organizes that behavior into a structured framework.
The result is a visual map centered on VWMA behavior rather than a classic crossover model. The goal is not to guess tops or bottoms, and it is not to replace broader market structure analysis. The goal is to help the user read displacement quality, persistence, and normalization pressure around a volume-weighted equilibrium reference.
This makes the script useful in two very different but related contexts. In intraday use, it can help identify when a move is still building away from the mean versus when extension may already be mature. In swing use, it can help frame whether price is holding a healthy distance from its weighted mean or rotating back toward equilibrium.
WHAT MAKES IT DIFFERENT
This script is not presented as “another moving average” and it is not intended to function as a simple VWMA trend filter. Its design focus is the behavior around VWMA, not the line by itself.
The main distinction is the state model. Instead of reducing the chart to a binary above/below interpretation, the script tracks whether displacement is mild, active, persistent, extended, overextended, re-approaching, or rebalanced. That adds context to moves that may otherwise look similar at first glance but are materially different in maturity and behavior.
A second distinction is normalization. Raw distance in price units can be misleading across different symbols, different volatility conditions, and different phases of the same market. For that reason, the script evaluates displacement relative to a normalization unit rather than using absolute price distance alone. This is intended to make the map more comparable and more structurally meaningful.
A third distinction is presentation. The indicator is designed as a chart-reading framework, with a central weighted-mean structure, layered displacement bands, background state context, a last-bar state label, and a compact information panel. The output is meant to be descriptive and contextual rather than promotional or predictive.
METHODOLOGY
The script begins with a VWMA reference built from user-defined length and source settings. Around that reference, it measures normalized price displacement. The normalization can be based on ATR, standard deviation, or a hybrid approach, depending on the selected mode.
From there, the script derives several internal components:
1. Distance
This reflects how far price is trading from the VWMA after normalization. The purpose is to measure relative displacement rather than raw tick or point difference.
2. Persistence
This tracks how long the current directional displacement has remained active. A move that has stayed consistently above or below the weighted mean for multiple bars may carry a different interpretation than a one-bar separation.
3. Expansion
This evaluates whether the displacement is still building. Rising displacement can indicate that price is not merely away from the mean, but continuing to separate from it.
4. Normalization
This evaluates whether the displacement is beginning to contract toward the mean. It does not forecast reversal by itself. It is intended to show whether the existing separation is losing expansion pressure and moving into a more balanced phase.
5. Regime
The script also classifies contextual slope behavior into a simplified regime reading. This is not meant to be a full market regime engine. It is a compact contextual aid for distinguishing broader trend-like conditions from quieter or more balanced environments.
These components feed the state engine and the panel metrics. The result is not a claim of certainty, but a structured way to read where price is operating relative to a volume-weighted center.
STATE MODEL
The indicator organizes behavior into discrete chart states. These states are designed for interpretation, not for deterministic outcome prediction.
Balanced
Price is trading close to the VWMA and displacement is limited.
Early Dislocation
Price is beginning to separate from the weighted mean, but the move is still in an early stage.
Persistent Dislocation
Distance is no longer only emerging; it has remained active for a more sustained period.
Extended
The move has reached a stronger separation from the mean and may require more caution in interpretation.
Overextended
Displacement is extreme relative to the current normalization model. This does not mean price must reverse immediately. It indicates an elevated extension condition.
Re-approaching
Distance is beginning to contract and the move may be rotating back toward VWMA equilibrium.
Rebalanced
Price has moved back toward the mean after a prior displacement phase.
The practical value of this model is that it helps separate fresh movement from mature movement. Two charts can both be above VWMA, but one may be in an early building phase while another may already be extended and normalizing.
HOW TO READ THE PANEL
The information panel is designed to provide a quick summary of the current state without overwhelming the chart.
Score
A composite reading of displacement behavior. This is a contextual score, not a performance metric and not a probability estimate.
Bias
A directional summary based on price relative to VWMA.
Regime
A simplified context tag derived from the weighted-mean behavior.
Distance
The current normalized displacement from VWMA.
Persistence
The number of bars associated with the current directional displacement run.
Normalization
A compact measure of contraction pressure toward the weighted mean.
Footer interpretation
A short descriptive line showing the current qualitative state context and whether displacement is expanding or contracting.
The panel is intended to summarize current conditions, not to replace full chart reading.
VISUAL STRUCTURE
The chart output is designed to be read in layers.
The central weighted-mean structure provides the equilibrium reference.
The inner visual structure highlights the core region around VWMA.
The displacement bands expand outward to show increasingly stretched conditions relative to the normalization thresholds.
The background tint provides a broad state cue so users can quickly identify periods of balance, active displacement, or higher extension.
The last-bar state label is included to make the current state readable at a glance without scanning the full panel.
This layered design is intentional. It allows the script to remain visually expressive while still communicating a hierarchy: center, displacement, extension, and normalization.
HOW THIS TOOL MAY BE USED
Some users may apply the script as a continuation context tool. In that workflow, the focus is less on exact entries and more on whether a move is still developing in a healthy way away from the weighted mean.
Some users may apply it as an extension-awareness tool. In that workflow, the purpose is to identify when a move may already be mature and when aggressive continuation assumptions deserve more caution.
Others may use it as a mean-normalization context tool. In that workflow, the interest is not whether price is simply above or below VWMA, but whether the separation is holding, expanding, or rotating back toward equilibrium.
Because of this flexibility, the script is not restricted to one market style. It can be used as an analytical overlay in trending markets, in rotational conditions, or as part of a broader discretionary review process.
SIGNALS AND ALERTS
The script includes alerts tied to state transitions and context changes. These alerts are descriptive events based on the model, not trade promises.
Persistent Dislocation
Triggers when the script enters the Persistent Dislocation state.
Extended
Triggers when the script enters the Extended state.
Overextended
Triggers when the script enters the Overextended state.
Re-approaching
Triggers when the script enters the Re-approaching state.
Rebalanced
Triggers when price rotates back toward the weighted mean after prior displacement.
Score Threshold Cross
Triggers when the composite score crosses above the user-defined threshold.
Bias Flip
Triggers when directional bias flips across VWMA.
These alerts are intended to support monitoring and workflow organization. They should be interpreted in the context of the broader chart.
KEY INPUTS
VWMA Length
Controls the length of the volume-weighted mean.
Normalization Mode
Selects whether normalized displacement is built from ATR, standard deviation, or a hybrid of the two.
Normalization Length
Controls the lookback used in the normalization engine.
Distance Smoothing
Adjusts smoothing applied to the displacement behavior.
Regime Lookback
Controls the lookback used in the regime context calculation.
State Thresholds
Define how mild, active, strong, and extreme displacement are classified.
Persistence Confirmation Bars
Helps distinguish brief separation from more sustained displacement.
Re-Approach Confirmation Bars
Controls how quickly the script recognizes contraction back toward the mean.
Visual Settings
Allow the user to manage bands, background context, VWMA visibility, line strength, opacity behavior, and label placement.
Panel Settings
Allow layout, position, theme, and text sizing adjustments.
The script is intended to be configurable so the same framework can be adapted to different symbols and timeframes without changing its core logic.
LIMITATIONS AND TRANSPARENCY
This script does not predict future price direction.
It is not a standalone trading system, not an execution engine, and not a substitute for full chart analysis.
A strong displacement can remain strong for longer than expected. An overextended reading does not guarantee immediate reversal. A re-approaching or rebalanced state does not guarantee that a larger directional move has ended.
Like any normalized framework, the output depends on the settings chosen by the user. Different symbols, timeframes, volatility environments, and threshold selections can meaningfully change the visual behavior and state classification.
The script should be understood as a descriptive map around a volume-weighted mean, not as a promise of edge by itself.
RISK DISCLOSURE
This indicator is for analytical and educational charting use only.
It does not provide financial advice, investment advice, or guaranteed outcomes.
All trading and investing involve risk. Users should evaluate any signal, state change, or alert in the context of their own process, market conditions, risk controls, and independent judgment.
AG Pro VWMA Dislocation Map is designed to help structure interpretation around VWMA displacement behavior. It is not designed to remove uncertainty from markets, and it should not be used as the sole basis for financial decisions.
Indikator

Indikator

Trade Intelligence Dashboard// =============================================================================
// INDICATOR DESCRIPTION
// =============================================================================
// Name : Trade Intelligence Dashboard
// Version : Pine Script v6
// Type : Indicator (overlay)
// Author : Built with Claude (Anthropic) — designed as a universal debug tool
// Instruments : NQ, MNQ, ES, MES, SPY, QQQ, Stocks — any instrument
// Timeframes : Works on all timeframes
// =============================================================================
//
// OVERVIEW
// --------
// The Trade Intelligence Dashboard is a standalone indicator designed to give traders
// a comprehensive at-a-glance view of market conditions across 9 independent
// analysis sections, all displayed in a single clean horizontal table at the
// bottom of the chart. It is instrument-agnostic and works with any strategy —
// not just the VWAP + CVD strategy it was originally built alongside.
//
// The panel is designed to support real-time trading decisions by surfacing
// the most important technical and structural information in one place, color
// coded for instant interpretation — no hunting through multiple indicators
// or panels.
//
// Because it is a standalone indicator it can be added or removed from any
// chart independently without affecting any strategy script. This makes it
// ideal for live trading sessions where you want maximum information density,
// and easy to remove during backtesting when a clean chart is preferred.
//
// =============================================================================
// LAYOUT
// =============================================================================
//
// The panel displays as a horizontal table across the bottom of the chart
// with 10 columns and 9 rows:
// - Column 0 : Instrument info (always visible, cannot be toggled)
// - Columns 1–9 : Analysis sections (each independently toggleable)
// - Row 0 : Section headers (shaded with Section Header Background color)
// - Rows 1–8 : Metric labels and values
//
// When a section is toggled off its column disappears and all remaining
// columns shift left automatically — the table always stays compact and clean
// regardless of how many sections are active.
//
// =============================================================================
// SECTIONS
// =============================================================================
//
// INSTRUMENT (Col 0 — always visible)
// ------------------------------------
// Displays the selected instrument preset, point value, current price, daily
// change in points, and daily change as a percentage. The instrument preset
// dropdown auto-fills the correct point value for dollar-value calculations
// displayed throughout the panel.
// Presets: NQ (20), MNQ (2), ES (50), MES (5), SPY/QQQ/Stock (1)
//
// VWAP (Col 1)
// ------------
// Shows the relationship between price and session VWAP. Metrics include:
// Above/Below status, distance in points, distance as percentage, VWAP value,
// and dollar distance from VWAP (using point value). Green when price is above
// VWAP, red when below.
//
// TREND (Col 2)
// -------------
// Displays the current trend direction (Up/Down/Flat), whether the trend is
// strong enough to trade (based on ATR multiple threshold), trend strength in
// points, and trend strength expressed as an ATR multiple. Green for bullish,
// red for bearish, white for flat/neutral.
//
// ATR & VOLATILITY (Col 3)
// ------------------------
// Shows the current ATR value, ATR as a percentage of price, volatility
// condition (OK or Low based on minimum ATR % floor), ATR dollar value
// (ATR × point value), and ATR direction with percentage change from the
// previous bar. Useful for understanding whether current conditions are
// favorable for momentum trades.
//
// CVD — Cumulative Volume Delta (Col 4)
// --------------------------------------
// Displays the session CVD value (resets each day when session reset is
// enabled), CVD threshold, overall CVD direction (Bullish/Bearish/Neutral),
// CVD position relative to threshold (Above/Inside/Below), and the session
// reset status. Green for bullish CVD, red for bearish, yellow for neutral/
// inside threshold. Note: CVD uses bar direction as a proxy for true delta
// since bid/ask volume is unavailable in Pine Script.
//
// EMA/SMA (Col 5)
// ---------------
// Shows the fast MA value and direction, slow MA value and direction, the
// most recent cross signal (Bullish Cross / Bearish Cross / None), and
// price position relative to both the fast and slow MA. MA mode (EMA or SMA)
// and both lengths are fully user adjustable. MA lines for fast and slow are
// also plotted on the chart when this section is enabled. Green for rising/
// bullish, red for falling/bearish.
//
// VOLUME (Col 6)
// --------------
// Displays current bar volume, volume classification vs average (High/Normal/
// Low based on user-defined thresholds), volume ratio (current vs average),
// bar pressure (Buying/Selling/Neutral based on bar direction), and the volume
// moving average value. High volume = green, low volume = red, normal = white.
//
// MARKET STRUCTURE (Col 7)
// ------------------------
// Tracks swing highs and lows using pivot detection to identify the current
// market structure. Displays the last swing type (HH/HL/LH/LL), overall
// structure bias (Bullish/Bearish/Neutral), bars since the last swing, last
// swing high and low values, and swing range in points. HH/HL = green
// (bullish structure), LH/LL = red (bearish structure).
//
// RSI (Col 8)
// -----------
// Shows the current RSI value, condition (Overbought/Oversold/Neutral),
// RSI trend (Rising/Falling/Flat), overbought and oversold levels, and
// RSI distance from the 50 midline. RSI above 50 = green, below 50 = red,
// at 50 = yellow. Overbought = red (caution), oversold = green (opportunity).
// RSI length and OB/OS levels are fully user adjustable.
//
// PRICE ACTION (Col 9)
// --------------------
// Displays bar-level price action analysis including: bar direction (Bullish/
// Bearish/Doji), bar range in points and dollars, bar range vs current ATR
// (above 1x ATR = green, below = red), bar close position (Upper/Mid/Lower
// third of the bar range), and consecutive bullish or bearish bar count.
// This section helps identify momentum, exhaustion, and conviction at the
// bar level without needing a separate candlestick pattern indicator.
//
// =============================================================================
// COLOR CODING SYSTEM
// =============================================================================
//
// All values throughout the panel follow a consistent dynamic color system:
//
// Green (Positive Color) — bullish, true, above, rising, high, OK,
// long, buying, HH/HL, oversold RSI (opportunity)
// Red (Negative Color) — bearish, false, below, falling, low, weak,
// short, selling, LH/LL, overbought RSI (caution)
// Yellow (Warning Color) — neutral boundary, 50% levels, inside threshold,
// Doji bars, equal wicks, RSI at 50
// White (Neutral Color) — raw numbers with no directional meaning,
// labels, static reference values
//
// All four colors are fully user adjustable via the Colors input group.
//
// =============================================================================
// DOLLAR VALUE CALCULATIONS
// =============================================================================
//
// Several metrics display dollar values calculated by multiplying point values
// by the instrument point value from the preset. This makes the panel
// immediately useful for futures traders who think in dollar terms:
//
// NQ — 1 point = $20 (full size Nasdaq futures)
// MNQ — 1 point = $2 (micro Nasdaq futures)
// ES — 1 point = $50 (full size S&P 500 futures)
// MES — 1 point = $5 (micro S&P 500 futures)
// SPY / QQQ / Stock — 1 point = $1 (shares, adjust for lot size manually)
//
// Dollar values appear for: VWAP distance, ATR value, and bar range.
//
// =============================================================================
// DISPLAY SETTINGS
// =============================================================================
//
// Box Position — Top Right, Top Left, Bottom Right, Bottom Left
// Box Text Size — Small (size.tiny), Medium (size.small), Large (size.normal)
// Box Background — fully user adjustable color
// Box Text Color — fully user adjustable color
// Box Border — thickness 0–5, fully user adjustable
// Section Header — separate background color for section header row
//
// =============================================================================
// USAGE TIPS
// =============================================================================
//
// - Add this indicator to any chart independently of any strategy script.
// It recalculates all values from scratch using only price and volume data
// so it works alongside any strategy without conflicts.
//
// - Toggle sections off that are not relevant to your current setup to keep
// the panel compact. For example, if you are not using MA-based entries
// you can toggle off the EMA/SMA section entirely.
//
// - Use the Instrument preset to ensure dollar value calculations match your
// actual instrument. For NQ set to NQ, for MNQ set to MNQ etc.
//
// - The CVD session reset toggle should match the setting in your strategy
// script for consistent values across both panels.
//
// - For intraday trading the panel works best on timeframes of 1m through
// 30m. On daily or weekly charts the session-based metrics (CVD, session
// high/low, VWAP) will reflect longer periods which may not be meaningful
// for intraday setups.
//
// - Use TradingView Templates (gear icon → template dropdown → Save As) to
// save separate panel configurations for different instruments, with only
// the relevant sections enabled for each.
//
// - The MA lines (Fast MA and Slow MA) only plot on the chart when the
// EMA/SMA section is toggled on. Toggle it off to hide the MA lines from
// the chart without removing the indicator entirely.
//
// - The VWAP line also only plots when the VWAP section is toggled on.
// If you have a separate VWAP indicator already on the chart, toggle the
// VWAP section off to avoid duplicate lines.
// ============================================================================= Indikator

Volume Analysis Pro [KTY]Volume Analysis Pro
Analyze everything about volume with a single indicator.
Buy/Sell split candles, VWMA cloud, oscillator signals, volume divergence —
all essential volume analysis tools in one package.
━━━━━━━━━━━━━━━━━━━━━━━━━━━━━━━
🔑 Key Features
━━━━━━━━━━━━━━━━━━━━━━━━━━━━━━━
▶ Buy/Sell Volume Candles
Splits candle bodies by buy/sell ratio and displays them with color.
Dark area = dominant side / Light area = weaker side
Bull candle with large light area → appears bullish, but selling is dominant
Bear candle with large light area → appears bearish, but buying is dominant
See the true story behind every candle at a glance.
━━━━━━━━━━━━━━━━━━━━━━━━━━━━━━━
▶ Buy/Sell VWMA Cloud
Visualizes the difference between buy volume-weighted
and sell volume-weighted average prices as a cloud.
Green cloud = buy dominance (bullish)
Red cloud = sell dominance (bearish)
▲▼ triangles = shown on cloud cross + price position confirmation
The moment the cloud flips is a key shift in supply/demand.
━━━━━━━━━━━━━━━━━━━━━━━━━━━━━━━
▶ Oscillator Signals
Detects volume flow and anomalies in the bottom panel.
Buy/Sell split columns — visually separates buy and sell volume per bar
Conflict detection (▼▲) — warns when candle direction and volume disagree
Spike detection (■) — marks when volume surges significantly above average
EMA line — tracks volume flow direction with glow effect
━━━━━━━━━━━━━━━━━━━━━━━━━━━━━━━
▶ Volume Divergence
Auto-detects when price and volume flow move in opposite directions.
🔴 D — price rising but volume dropping → uptrend weakening
🟢 D — price falling but volume rising → downtrend weakening
Visualized with connecting lines + D labels on chart
Hidden divergence (trend continuation signal) also supported:
🟢 HD — volume fading on pullback in uptrend → trend likely continues
🔴 HD — volume fading on bounce in downtrend → downtrend likely continues
━━━━━━━━━━━━━━━━━━━━━━━━━━━━━━━
💡 Tips
━━━━━━━━━━━━━━━━━━━━━━━━━━━━━━━
Repeated conflicts (▼▲) → current trend weakening
Divergence (D) + cloud flip together → strong reversal signal
Spike (■) + trend direction match → trend acceleration
All features can be toggled ON/OFF individually → customize to your style
━━━━━━━━━━━━━━━━━━━━━━━━━━━━━━━
🔧 Settings
━━━━━━━━━━━━━━━━━━━━━━━━━━━━━━━
Hover over the ⓘ icon next to each setting for detailed descriptions.
Core parameters are built-in with optimized values —
ready to use with default settings right away.
✅ Chart Overlay — Volume candles, VWMA cloud, cloud cross ON/OFF
✅ Oscillator — Conflict, spike, EMA line ON/OFF + EMA color
✅ Divergence — Regular / Hidden divergence ON/OFF
━━━━━━━━━━━━━━━━━━━━━━━━━━━━━━━
🔔 Alerts
━━━━━━━━━━━━━━━━━━━━━━━━━━━━━━━
Cloud cross (buy/sell shift)
Candle-volume conflict detected
Volume spike detected
Divergence detected (bearish / bullish)
Hidden divergence detected (bearish / bullish)
Setup: ALT + A → Select 【Volume Analysis Pro】📊 → Create alert
━━━━━━━━━━━━━━━━━━━━━━━━━━━━━━━
📌 Note
━━━━━━━━━━━━━━━━━━━━━━━━━━━━━━━
Buy/sell volume is estimated based on the direction
of lower timeframe (1-minute) candles.
This is not order flow data from the bid/ask book.
Focus on relative flow and trend shifts
rather than absolute buy/sell amounts.
━━━━━━━━━━━━━━━━━━━━━━━━━━━━━━━
⚠️ Disclaimer
━━━━━━━━━━━━━━━━━━━━━━━━━━━━━━━
This indicator is an analysis tool, not a trade signal service.
Default settings are a starting point — not optimized for any specific market.
Past reactions do not guarantee future outcomes.
All trading decisions and associated risks are solely your responsibility. Indikator

Indikator

Volume Weighted Trend [QuantAlgo]🟢 Overview
The Volume Weighted Trend indicator identifies statistically significant trend changes by combining volume-weighted price analysis with volatility-based breakout bands. It calculates a Volume Weighted Moving Average (VWMA) as the central trend baseline, then creates dynamic upper and lower bands using Average True Range (ATR) multipliers to define normal volatility boundaries. When price breaks above the upper band or below the lower band, it signals a confirmed trend change, helping traders and investors identify directional shifts driven by both volume-weighted momentum and volatility expansion across different timeframes and markets.
🟢 How It Works
The indicator's core methodology lies in its dual-layer approach combining volume weighting with volatility filtering, where trend changes require both price direction and statistical significance:
vwma_basis = ta.vwma(close, vwma_length)
atr_value = ta.atr(vwma_length)
upper_band = vwma_basis + atr_value * atr_multiplier
lower_band = vwma_basis - atr_value * atr_multiplier
First, the script calculates the Volume Weighted Moving Average to establish a trend baseline that gives greater weight to periods with higher trading volume, ensuring the trend line reflects significant participation and genuine market conviction rather than low-volume noise.
Then, it measures the Average True Range over the same period to quantify current market volatility:
atr_value = ta.atr(vwma_length)
Next, dynamic volatility bands are constructed by adding and subtracting ATR-based buffers from the VWMA baseline, creating adaptive boundaries that expand during volatile conditions and contract during calm periods:
upper_band = vwma_basis + atr_value * atr_multiplier
lower_band = vwma_basis - atr_value * atr_multiplier
The trend state is then determined through breakout logic that requires price to exceed these volatility-adjusted boundaries:
if close > upper_band
trend_direction := 1
else if close < lower_band
trend_direction := -1
Finally, trend change detection identifies transitions between bullish and bearish states:
trend_turned_bullish = trend_direction == 1 and trend_direction != 1
trend_turned_bearish = trend_direction == -1 and trend_direction != -1
This creates a robust trend-following system that only signals directional changes when price makes statistically significant moves beyond normal volatility bounds, with volume weighting ensuring the trend reflects meaningful market activity rather than thin-volume spikes.
🟢 Signal Interpretation
▶ Bullish Trend (Price Above Upper Band): When price closes above the upper volatility band, the indicator switches to bullish mode with green/bullish coloring throughout all visual elements = Confirmed uptrend signal for trend-following long positions. The trend remains bullish until price breaks below the lower band, allowing traders to stay positioned during sustained upward momentum without premature exits on minor pullbacks within the band range.
▶ Bearish Trend (Price Below Lower Band): When price closes below the lower volatility band, the indicator switches to bearish mode with red/bearish coloring throughout all visual elements = Confirmed downtrend signal for trend-following short positions or long exit signals. The trend remains bearish until price breaks above the upper band, enabling traders to maintain directional bias through corrective moves that stay within the band boundaries.
▶ Neutral Zone (Price Between Bands): When price trades between the upper and lower volatility bands, the indicator maintains its previous trend direction = Continuation of existing trend during consolidation or normal volatility retracements. This design prevents whipsaws during sideways action by requiring price to make a significant move beyond opposite-side bands to trigger trend reversal, rather than flip-flopping on minor crosses of the VWMA center line.
🟢 Features
▶ Preconfigured Presets: Three optimized parameter sets for different trading approaches and timeframes. "Default" provides balanced trend detection for swing trading on 4-hour and daily charts, filtering noise effectively while capturing meaningful trend changes. "Fast Response" delivers quicker trend signals for intraday trading on 5-minute to 1-hour charts, with tighter bands triggering earlier on breakouts for active traders who can monitor positions closely. "Smooth Trend" focuses on major trend changes for position trading on daily to weekly timeframes, with wider bands filtering out minor fluctuations to identify only primary directional shifts.
▶ Built-in Alerts: Three alert conditions enable automated monitoring of trend changes without constant chart watching. "Bullish Trend Signal" triggers when the indicator switches to bullish mode after price breaks above the upper band, alerting for potential long entries. "Bearish Trend Signal" activates when the indicator switches to bearish mode after price breaks below the lower band, signaling potential short entries or long exits. "Trend Direction Changed" provides a combined alert for any trend transition regardless of direction, allowing traders to monitor both bullish and bearish opportunities with a single alert setup.
▶ Visual Customization: Six color presets (Classic, Aqua, Cosmic, Cyber, Neon, plus Custom) accommodate different chart backgrounds and aesthetic preferences, with coordinated bullish and bearish color schemes applied across all indicator elements. Optional neon glow effect creates layered visual emphasis around the central VWMA line with three overlapping plots at different transparencies, making the trend line more prominent and easier to track (ideal for charts with multiple indicators where visual distinction is important). Optional volatility ribbons display gradient fills between the VWMA and band boundaries, providing visual context for price position relative to breakout thresholds with adjustable band transparency (0-100%) to control prominence. Optional bar coloring tints price bars with trend-appropriate colors during bullish and bearish periods, enabling instant visual confirmation of trend state across multiple timeframes without switching between chart and indicator panels.
Indikator
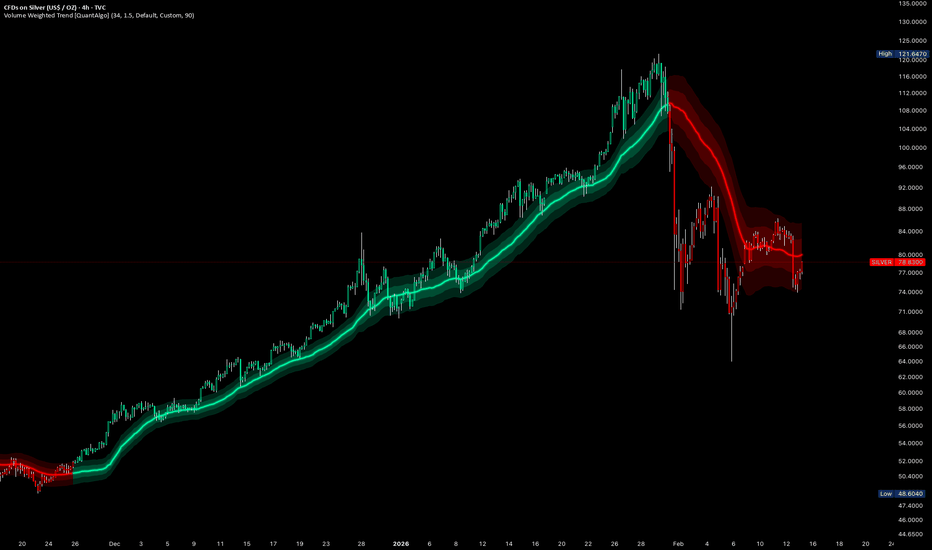
VWAP Gate (1m aligned ORB5)VWAP Gate v2.3 is a 1-minute aligned, session-aware VWAP regime filter (“gate”) designed to keep VWAP trades out of flat/choppy conditions and focus only on periods where VWAP is moving with structure. It plots a Session Anchored VWAP (RTH) with an ε touch zone, optionally plots an Overnight Anchored VWAP, and can mark VWAP retest entry signals only when the gate is active and price action confirms.
This is an overlay tool for discretionary execution and rule-based filtering. It does not manage exits, risk, or position sizing.
Core idea (what it does)
VWAP works best when the market has directional order flow and fails in mean-reverting chop. This indicator attempts to separate those regimes by requiring:
VWAP has actually moved (slope/magnitude filter)
Price is not constantly flipping around VWAP (chop filter)
Price is holding on one side of VWAP by a realistic buffer (hold/acceptance filter)
Only when these conditions persist does the Gate turn ON, enabling a “tradeable VWAP” environment.
All calculations are done on 1-minute data using request.security(..., "1", ...) so the behavior stays consistent across chart timeframes.
What is plotted
1) Session AVWAP (RTH Anchored VWAP)
A manually computed VWAP that resets at the start of the RTH session (default 09:30–16:00 New York).
It is plotted as “Session AVWAP” and changes color based on gate state and directional readiness (see “Colors” below).
2) VWAP ε Touch Zone (retest band)
Two lines around Session VWAP:
VWAP ε Upper = VWAP + ε
VWAP ε Lower = VWAP − ε
The band between them is filled. This creates a practical “touch zone” for retests and rejection closes.
ε (epsilon) is adaptive to instrument microstructure:
ε = max(minTicksEps × tickSizePts, spreadPts × epsSpreadMult)
This prevents treating tiny touches (often just spread/noise) as meaningful VWAP interactions.
3) Overnight AVWAP (optional)
If enabled, plots an Overnight anchored VWAP computed over the defined overnight session (default 00:00–09:30 New York).
Useful for mapping overnight fair value into the open.
4) ORB(5) High/Low (optional)
Plots the Opening Range Breakout (5 minutes) high/low (default 09:30–09:35 New York).
Optionally draws an ε band around ORB levels (ORB ± ε) to account for noise/spread around key levels.
5) VWAP Retest Entry Markers (optional)
When the gate is active, the tool can print:
“L” for a long retest entry
“S” for a short retest entry
These are filters + triggers, not guaranteed trades.
Gate logic (when trading is allowed)
A) VWAP Move / Slope filter
The indicator measures VWAP displacement over lookbackMin minutes:
VWAP_move = |VWAP_now − VWAP_lookback|
It must exceed thresholds tied to:
Recent price range: thrRange = kRange × (highestHigh − lowestLow over lookback)
Spread: thrSpr = kSpread × spreadPts
Threshold mode
Strict AND: VWAP_move must beat both thresholds
Loose: VWAP_move must beat max(thrRange, thrSpr)
Purpose: block low-energy sessions where VWAP drift is too small vs noise.
B) Chop filter (VWAP flips)
The indicator counts how often price flips sides of VWAP during the lookback window (with a small buffer to reduce micro-noise flips).
If flips exceed maxCrossesN, the environment is classified as chop and the gate cannot activate.
Purpose: avoid mean-reverting “ping-pong” around VWAP.
C) Gate confirmation (anti-flicker / hysteresis)
The gate requires persistence:
Gate turns ON after onConfirmBars consecutive passes
Gate turns OFF after offConfirmBars consecutive fails
Purpose: prevent rapid ON/OFF switching in borderline conditions.
Directional “Hold” readiness (LONG vs SHORT bias)
Even when the gate is ON, the indicator requires acceptance away from VWAP:
Define δ (delta buffer):
δ = max(2 ticks, spreadPts × holdDeltaMult)
Then:
HoldLong = price has stayed > (VWAP + δ) for holdBars 1-minute closes
HoldShort = price has stayed < (VWAP − δ) for holdBars 1-minute closes
Additionally, direction must agree with VWAP slope:
Long requires VWAP slope > 0
Short requires VWAP slope < 0
Purpose: avoid “false bias” when price temporarily deviates but VWAP is drifting the other way.
VWAP Retest Entry signals (L / S)
Entry markers trigger only when all are true:
Gate is active
Inside your Trade Window (default 09:40–11:00 New York)
HoldLongOk / HoldShortOk is true
Price touches the ε zone: low ≤ VWAP+ε AND high ≥ VWAP−ε
Then closes away from VWAP (“rejection close”) by a fraction of ε:
Long rejection:
close > VWAP + (ε × rejCloseFrac)
Short rejection:
close < VWAP − (ε × rejCloseFrac)
Optional: Require pullback can require the previous close to already be on the trend side (to avoid first-touch chaos).
Colors (quick regime read)
The Session VWAP line and ε zone communicate state:
Gray: gate inactive / no-trade regime
Yellow: gate active but no clean long/short hold yet (standby)
Lime: gate active + long hold confirmed (long bias)
Red: gate active + short hold confirmed (short bias)
Optional background tint can reinforce gate state, and optional shading can gray out bars outside the trade window.
Important notes / limitations
Set spreadPts and tickSizePts correctly for your instrument. ε and δ depend on them; wrong values distort the entire filter.
The indicator uses 1-minute computations across all chart timeframes for consistent behavior.
This tool is a regime filter + entry trigger, not a complete trading system (no exits, no sizing, no expectancy validation included).
If volume is missing/invalid, the script substitutes a minimal volume value for VWAP calculations.
Suggested use
Use Prop VWAP Gate to:
Avoid VWAP trading in flat/choppy opens
Focus attention when VWAP is moving and price is holding with structure
Execute VWAP retest setups inside a controlled time window
Combine with ORB(5) and overnight VWAP for key reference levels Indikator

AUTO FIB PRO - VWAP Bias and Retrace Breakouts (DAX NQ) v6AUTO FIB PRO by funnelzon automatically detects swing points (pivot highs/lows), draws dynamic Fibonacci levels, highlights the key retracement area (0.236–0.618), and prints continuation-style BUY/SELL signals after a retrace. It also includes VWAP + VWAP zone (ATR-based), a configurable trend filter (EMA200 / HTF EMA200 / VWAP / combined “BEST”), session & volatility filters, a CHOP blocker, a top-right “traffic light” status panel, and optional manual R/S zones (R1–R4 & S1–S4) with width presets and background highlighting.
1) Auto Swing → Auto Fibonacci
The script detects swing points using pivot highs/lows.
Once two valid swing points are available (P1 → P2), it plots Fibonacci levels:
0.236 / 0.382 / 0.500 / 0.618 / 0.786 / 1.000
Lines extend to the right and update automatically with new swings.
2) Retracement Box (0.236–0.618)
The yellow retracement box marks the key pullback area between 0.236 and 0.618.
Optional ATR padding can slightly widen the box (helps with “near touches”).
3) VWAP + VWAP Zone + VWAP Bias Label
VWAP line is optional.
VWAP zone is an ATR-based band around VWAP.
Bias label shows: BULL / BEAR / NEUTRAL, placed outside the chart (left/right selectable).
4) Filters (to avoid low-quality market phases)
Session Filter (DAX / NQ sessions in CET)
ATR-Min Filter (blocks low volatility)
CHOP Filter (blocks markets that get “stuck” inside the retracement zone for too long)
5) Signals (Continuation After Retrace)
Default behavior (Continuation ON):
Retracement zone must be touched first (setup becomes “armed”).
Signal triggers only when price breaks out across the box edge:
BUY: crossover above retrace top + bullish candle + filters OK
SELL: crossunder below retrace bottom + bearish candle + filters OK
Alternative (Continuation OFF):
More aggressive signals can trigger already inside the retracement box.
6) Signal Quality Modes
MORE Trades: looser rules, more signals (optional counter-trend allowed)
A+ ONLY: stricter rules (RSI + EMA slope + trend alignment)
7) Traffic-Light Panel (Top Right)
Shows in real time:
Auto preset type (DAX/NQ + Scalp/Swing + FAST/STABLE)
STATUS: TRADE OK / NO TRADE (and the reason)
Direction: LONG / SHORT / WAIT
Selected trend filter mode
VWAP bias
Pivot length
8) Manual Support/Resistance Zones (R1–R4 & S1–S4)
8 zones as price “areas” (boxes), extended left/right in time
Width presets: Narrow / Normal / Wide or Manual (Points/ATR)
Optional background highlighting when price is inside a zone
Key Features
Auto Swing Detection (Pivot High/Low) → builds P1 → P2 swing
Auto Fibonacci Levels: 0.236 / 0.382 / 0.500 / 0.618 / 0.786 / 1.000
Retracement Box: 0.236–0.618 (+ optional ATR padding)
VWAP Line + VWAP Zone (ATR-based)
VWAP Bias Label: BULL / BEAR / NEUTRAL (outside the chart)
Trend Filter Modes: OFF / EMA200 / HTF EMA200 / VWAP / HTF EMA200 + VWAP (BEST)
Trade Quality Modes:
MORE Trades (looser, more signals)
A+ ONLY (stricter: RSI + EMA slope + trend alignment)
Gate Filters:
Session filter (DAX / NQ CET sessions)
ATR-min filter (blocks low volatility)
CHOP filter (blocks extended sideways inside retrace zone)
Traffic Light Panel (Top Right): STATUS, DIR, FILTER, VWAP BIAS, PivotLen
Manual Zones (R1–R4 / S1–S4):
Width presets: Narrow / Normal / Wide (or Manual via Points/ATR)
Optional background highlight when price is inside a zone
Signals (Logic)
Default (Continuation ON):
Setup becomes “armed” after retracement zone touch
Signal triggers only on breakout:
BUY: close crosses above retrace top + bullish candle + filters OK
SELL: close crosses below retrace bottom + bearish candle + filters OK
Continuation OFF: more aggressive signals can trigger already inside the retracement box.
Recommended Setup (Quick Presets)
Clean & Reliable (recommended)
Auto Presets: ON
Mode: AUTO / SCALP (1/5/15)
Auto Fib Mode: STABLE
Quality: A+ ONLY
Continuation: ON
Trend Filter: HTF EMA200 + VWAP (BEST)
Session filter: ON
ATR-min: ON
CHOP filter: ON
More Trades
Auto Fib Mode: FAST
Quality: MORE Trades
Trend Filter: VWAP or EMA200
FAQ (Quick)
Q: Why do I see “NO TRADE” in the panel?
A: One of the gate filters blocks signals (outside session, ATR too low, or CHOP detected).
Q: Why no signals even though price is moving?
A: A valid swing (P1→P2) must exist, retrace zone must be touched (Continuation ON), and trend/quality filters must pass.
Q: What does CHOP mean here?
A: Price stayed inside the retracement zone for too many bars → higher noise → signals disabled until conditions improve.
Q: DAX vs NQ feels different — what should I change first?
A: Start with Market Preset, then adjust VWAP zone ATR mult and CHOP bars limit.
Disclaimer
Educational/analytical tool only. Not financial advice. Use risk management and confirm signals with market context. Indikator

Indikator