Volume Delta
The Volume Delta indicator uses intrabar volume and price fluctuations to estimate the difference (delta) between buying and selling pressure within each chart bar, providing insight into an instrument's sentiment and market dynamics. By default, the side of each trade is estimated from intrabar price movement. With Tick-based calculation, it is determined from market data.
The indicator analyzes each chart bar from an intrabar timeframe (i.e., a timeframe lower than the chart's), categorizing each intrabar's volume as positive or negative. It gradually accumulates the polarized volume values throughout a chart bar to calculate the volume delta, and it keeps track of the highest and lowest volume delta values achieved over the bar's duration.
After performing this analysis on a bar, the indicator plots a candle to represent the results:
- The candle's open value is always 0.
- The candle's close signifies the bar's final volume delta value.
- The high reflects the highest volume delta calculated throughout the bar's duration.
- The low reflects the lowest volume delta calculated throughout the bar's duration.
Aggregated calculation
By default, the indicator is calculated from aggregated intrabar data.
In this method, the indicator scans volume and price action across lower-timeframe bars within each chart bar to calculate volume delta values. To do this, it must first determine the intrabar timeframe to analyze.
The indicator selects the intrabar timeframe automatically based on the chart's timeframe using the following rules:
When selecting an intrabar timeframe manually, it's important to note that lower timeframes provide higher precision at the cost of less chart bar coverage. Higher timeframes provide more historical data, but the volume delta values will be less precise.
After timeframe selection, the indicator analyzes the direction of the available intrabars to categorize their volume and calculate the delta on each bar.
If the intrabar's opening price is not equal to the closing price:
- It considers the intrabar's volume positive and adds the value to the chart bar's total if the closing price exceeds the opening price.
- It considers the intrabar's volume negative and subtracts it from the chart bar's total if the closing price is below the opening price.
If the intrabar's opening and closing prices are equal:
- It considers the intrabar's volume positive and adds the value to the chart bar's total if the closing price exceeds the close of the previous intrabar.
- It considers the intrabar's volume negative and subtracts it from the chart bar's total if the closing price is below the previous intrabar's close.
- If the closing price equals that of the previous intrabar, the indicator assigns the previous intrabar's positive/negative status to the current intrabar.
Tick-based calculation
Tick-based calculation is an alternative mode in which the indicator determines the side of each trade from market data instead of intrabar price movement. It is off by default. To turn it on, see the Inputs section below.
In this mode, the indicator picks the best available method for the symbol, in this order:
- Aggressor side: The side of the trade (buy or sell) as reported by the exchange or the data provider. If the side is missing for a single trade, the indicator determines it with the next method.
- Distance to bid and ask: A trade above the ask counts as a buy and a trade below the bid counts as a sell. A trade between the bid and the ask goes to the side it is closer to: the ask means a buy, the bid means a sell. If the price is exactly in the middle, or the quotes are invalid, the indicator uses the next method. On CFD symbols, this method is not used: the indicator uses price movement on ticks.
- Price movement on ticks: The indicator compares the price of each tick with the price of the previous tick. If the price is higher, the volume of the tick counts as a buy and is added to the delta. If it is lower, the volume counts as a sell and is subtracted from the delta. If the price has not changed, the tick takes the side of the previous tick. The first tick counts as a buy.
For the list of symbols that provide aggressor side, see the Volume Footprint article. On other symbols with tick data, the indicator uses the second or third method.
The method in use is shown in the indicator's legend. If you change the symbol and the method becomes less accurate, for example from aggressor side to bid and ask, the status updates and a message appears. Once you close the message, it does not appear again during the session.
Tick-based calculation works on timeframes up to 1D and on plans with access to tick data [link to the plans page needed]. It is also available in Volume Footprint and Cumulative Volume Delta.
In tick-based mode, the delta of a bar in this indicator matches the delta of the same bar in Volume Footprint and the change of CVD over that bar. The toggles are independent: if one tool uses ticks and another uses aggregated data on the same chart, their values can differ.
The calculation can use up to 3 million ticks.
If a symbol has no tick data, the option is not available.
Inputs
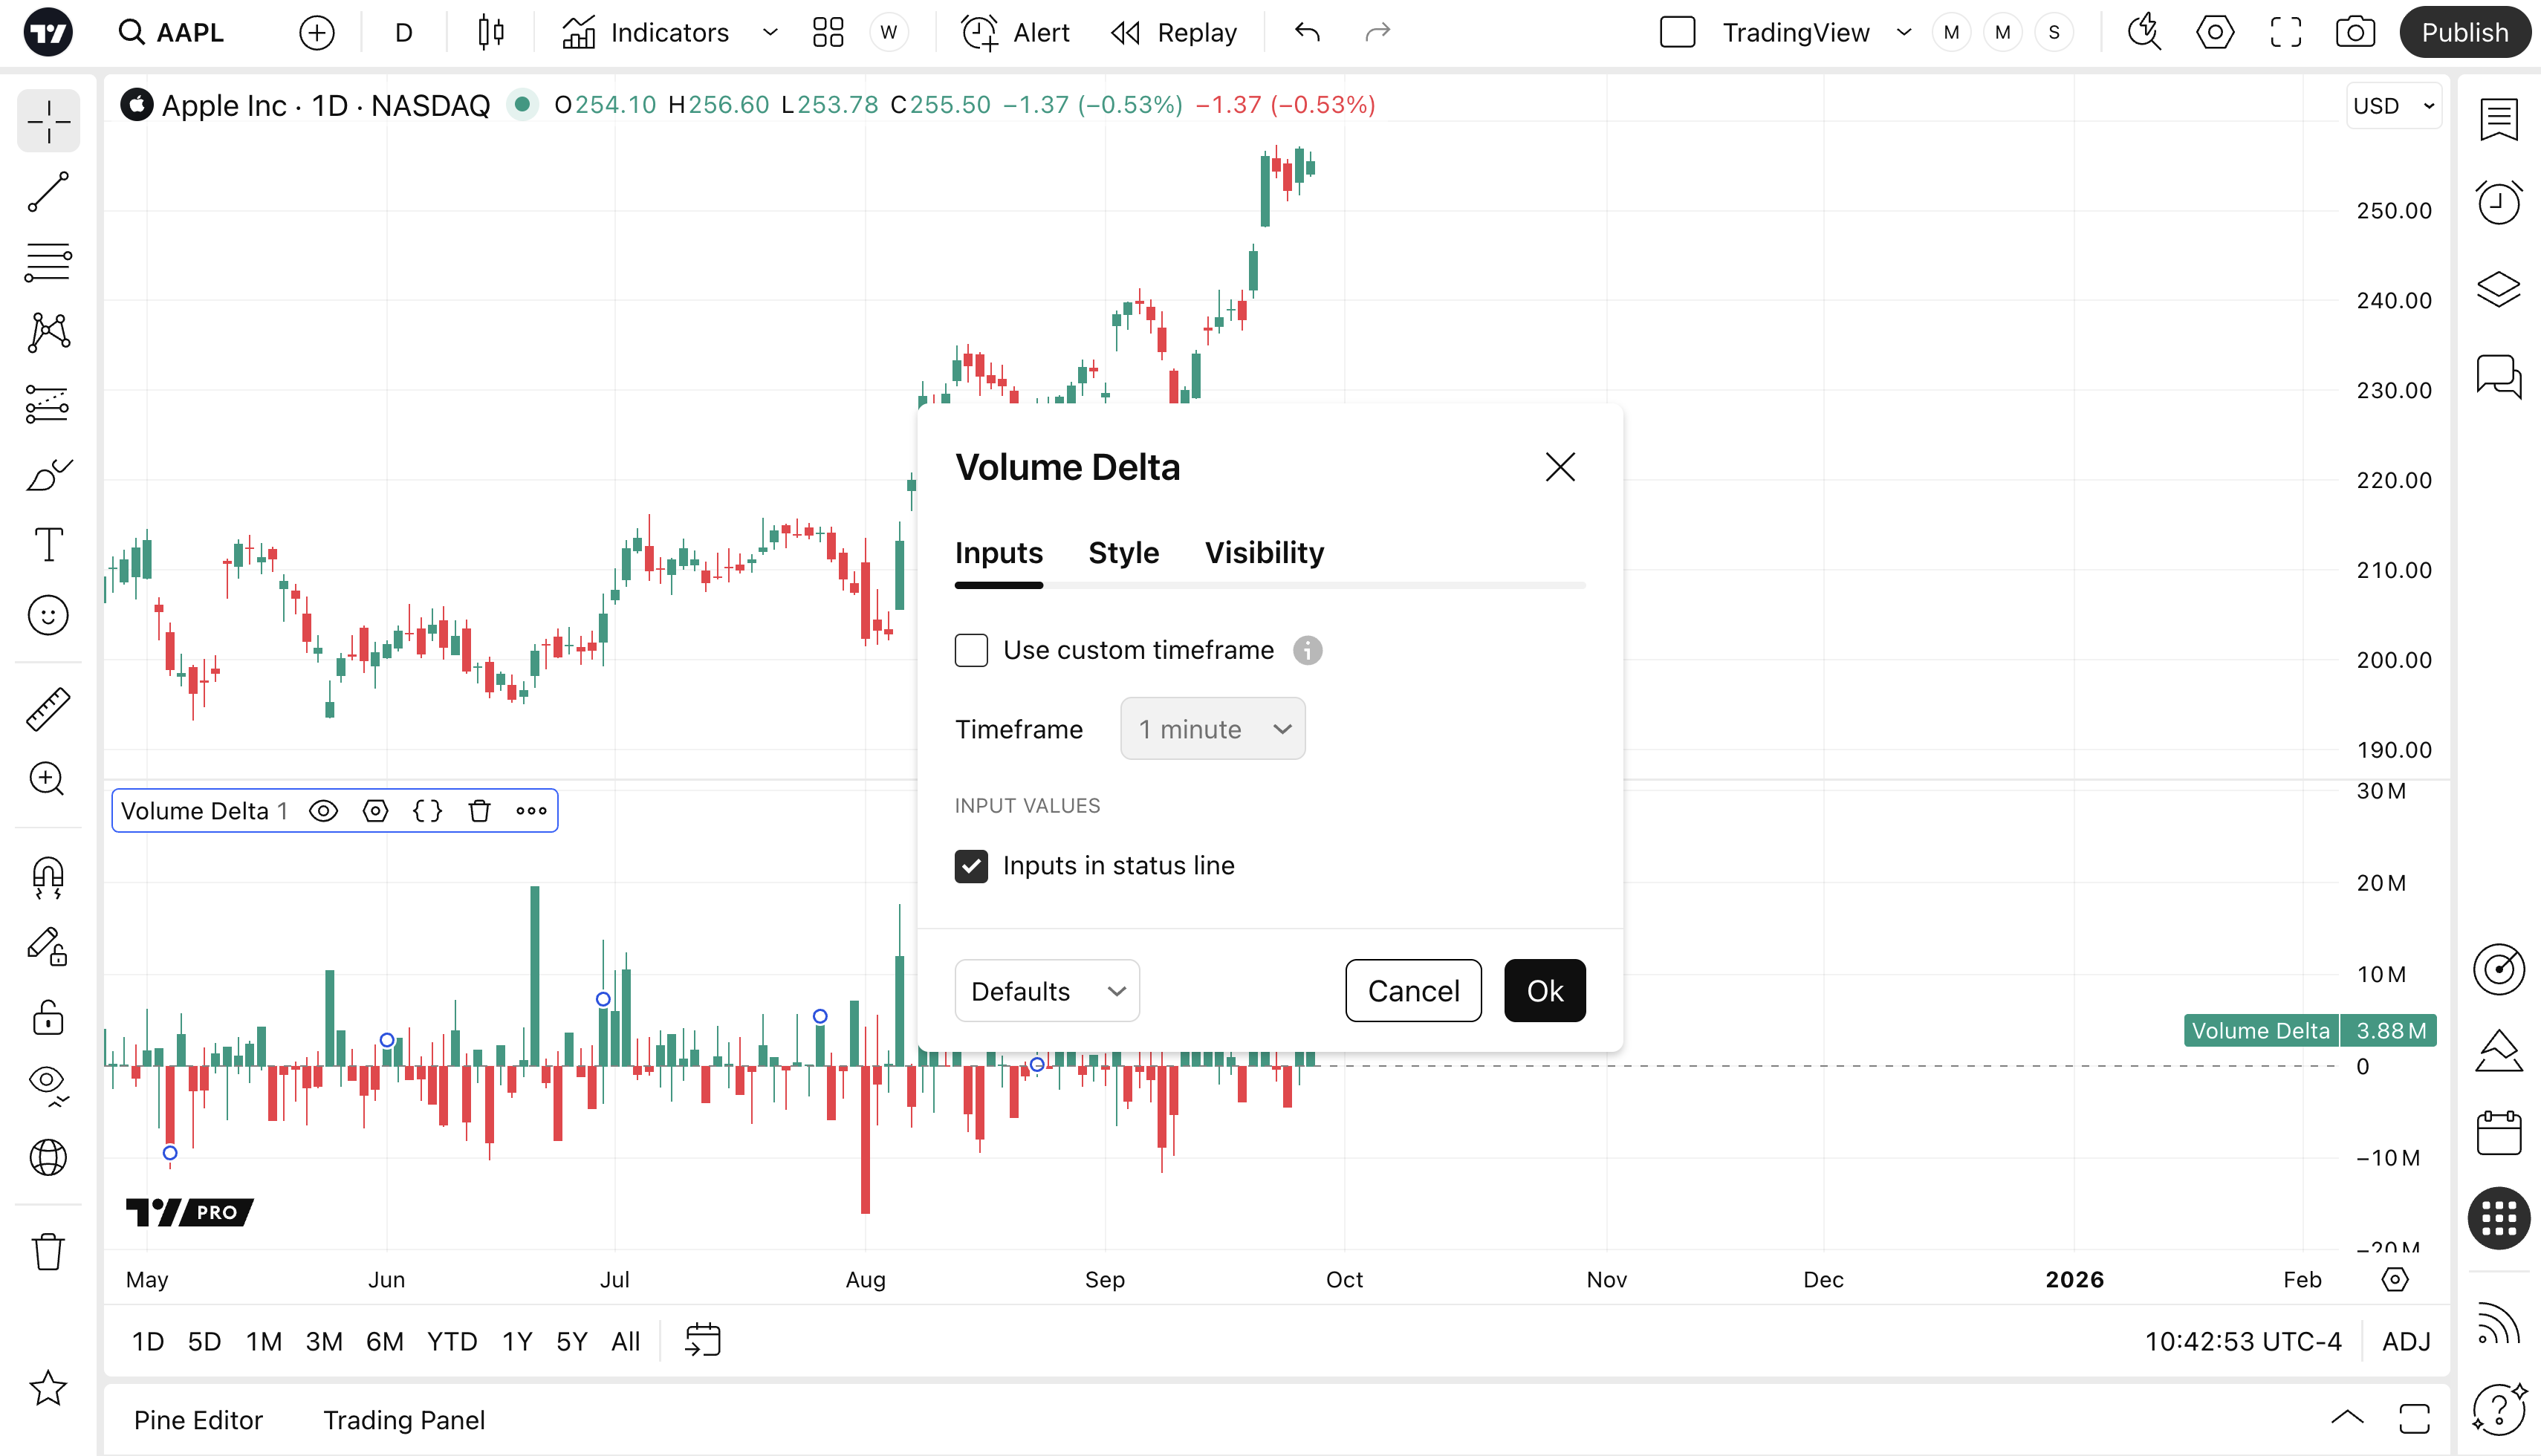
Tick-based calculation
Turns on the tick-based calculation, in which the indicator determines the side of each trade from market data instead of intrabar price movement. The option is off by default. You can also turn it on with the toggle in the indicator's legend. See the Tick-based calculation section above for the methods, availability and limitations.