
hello
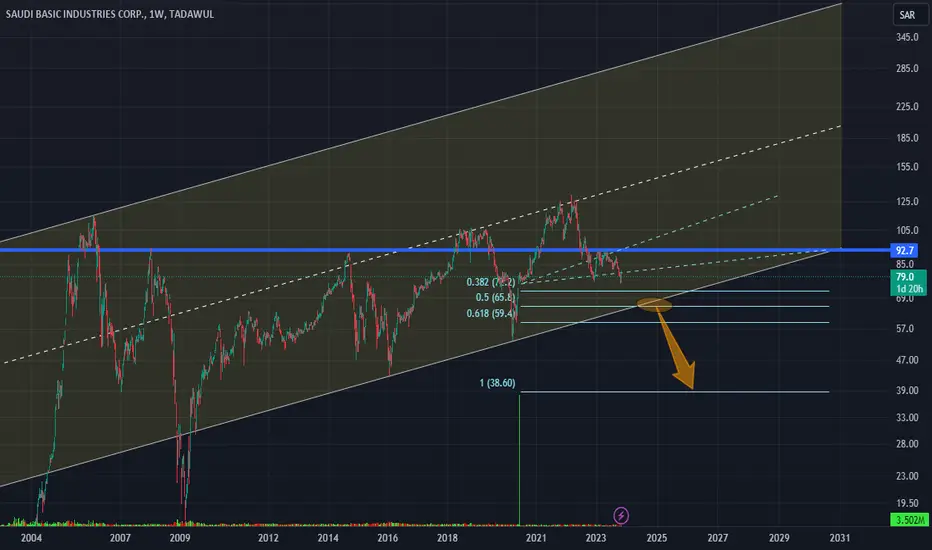
first as you see on my chart resepects its evolution according to the figure so:
- if it breaks the suuport line around 65.8 it will reach 59.4 then maye be pulback toward its broken support then continue its free fall until 38.6 or more.
- otherwise it will rebond on its support and buyers can hold their stocks wishing higher levels
Remember that this support is a critical level so pay attention
NB:the horizontal blue line presents a historical level that retraces history of this stock
Keep in mind that i am not having a cristal ball predicting future but i try to be more efficient and rationnal
first as you see on my chart resepects its evolution according to the figure so:
- if it breaks the suuport line around 65.8 it will reach 59.4 then maye be pulback toward its broken support then continue its free fall until 38.6 or more.
- otherwise it will rebond on its support and buyers can hold their stocks wishing higher levels
Remember that this support is a critical level so pay attention
NB:the horizontal blue line presents a historical level that retraces history of this stock
Keep in mind that i am not having a cristal ball predicting future but i try to be more efficient and rationnal

פרסומים קשורים
כתב ויתור
המידע והפרסומים אינם מיועדים להיות, ואינם מהווים, ייעוץ או המלצה פיננסית, השקעתית, מסחרית או מכל סוג אחר המסופקת או מאושרת על ידי TradingView. קרא עוד ב־תנאי השימוש.
פרסומים קשורים
כתב ויתור
המידע והפרסומים אינם מיועדים להיות, ואינם מהווים, ייעוץ או המלצה פיננסית, השקעתית, מסחרית או מכל סוג אחר המסופקת או מאושרת על ידי TradingView. קרא עוד ב־תנאי השימוש.