
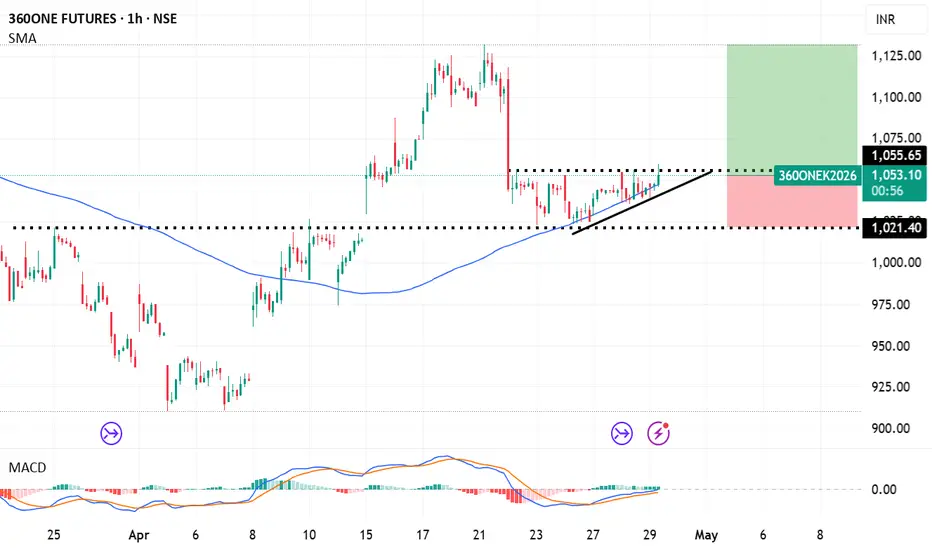
Based on the technical analysis of 360 ONE WAM Ltd (360ONE) as of late April 2026, the stock has been navigating a period of high volatility, with a reported bearish trend on daily charts (below key moving averages) but a robust long-term performance.
Pattern: The stock has shown consolidation patterns (previously a potential symmetrical triangle or rising wedge) on hourly charts, often appearing as a consolidation before a significant price move.
Recent Structure: Technical reports indicate the price is compressing beneath a downward trendline resistance on the hourly/daily charts, often referred to as a "descending triangle" or consolidation near resistance.
Breakout Requirement: A sustained close above key resistance levels (around ₹1,120–₹1,130) is typically needed to confirm a bullish breakout, which has been challenged by high selling pressure.
Strategy: Buy on breakout or accumulation at lower support levels, as the stock has experienced sharp intraday swings.
Stop Loss (SL): ₹1,020 (Based on your request). Note: Technical reports frequently highlight crucial support near the ₹1,025–₹1,030 range or deeper at ₹900-₹950, so 1020 acts as a short-term defense level.
Target: ₹1,132 (Based on your request). Note: The immediate 52-week high is around ₹1,273, with significant intermediate resistance near ₹1,100–₹1,130 based on recent, high-volume trading activity.
Current Context: The futures recently experienced a 3-day decline, losing 5.67% and high open interest (OI) suggesting elevated short positions or hedging, meaning a move to 1132 would likely require a reversal of this bearish momentum.
Pattern: The stock has shown consolidation patterns (previously a potential symmetrical triangle or rising wedge) on hourly charts, often appearing as a consolidation before a significant price move.
Recent Structure: Technical reports indicate the price is compressing beneath a downward trendline resistance on the hourly/daily charts, often referred to as a "descending triangle" or consolidation near resistance.
Breakout Requirement: A sustained close above key resistance levels (around ₹1,120–₹1,130) is typically needed to confirm a bullish breakout, which has been challenged by high selling pressure.
Strategy: Buy on breakout or accumulation at lower support levels, as the stock has experienced sharp intraday swings.
Stop Loss (SL): ₹1,020 (Based on your request). Note: Technical reports frequently highlight crucial support near the ₹1,025–₹1,030 range or deeper at ₹900-₹950, so 1020 acts as a short-term defense level.
Target: ₹1,132 (Based on your request). Note: The immediate 52-week high is around ₹1,273, with significant intermediate resistance near ₹1,100–₹1,130 based on recent, high-volume trading activity.
Current Context: The futures recently experienced a 3-day decline, losing 5.67% and high open interest (OI) suggesting elevated short positions or hedging, meaning a move to 1132 would likely require a reversal of this bearish momentum.

כתב ויתור
המידע והפרסומים אינם מיועדים להיות, ואינם מהווים, ייעוץ או המלצה פיננסית, השקעתית, מסחרית או מכל סוג אחר המסופקת או מאושרת על ידי TradingView. קרא עוד ב־תנאי השימוש.
כתב ויתור
המידע והפרסומים אינם מיועדים להיות, ואינם מהווים, ייעוץ או המלצה פיננסית, השקעתית, מסחרית או מכל סוג אחר המסופקת או מאושרת על ידי TradingView. קרא עוד ב־תנאי השימוש.