
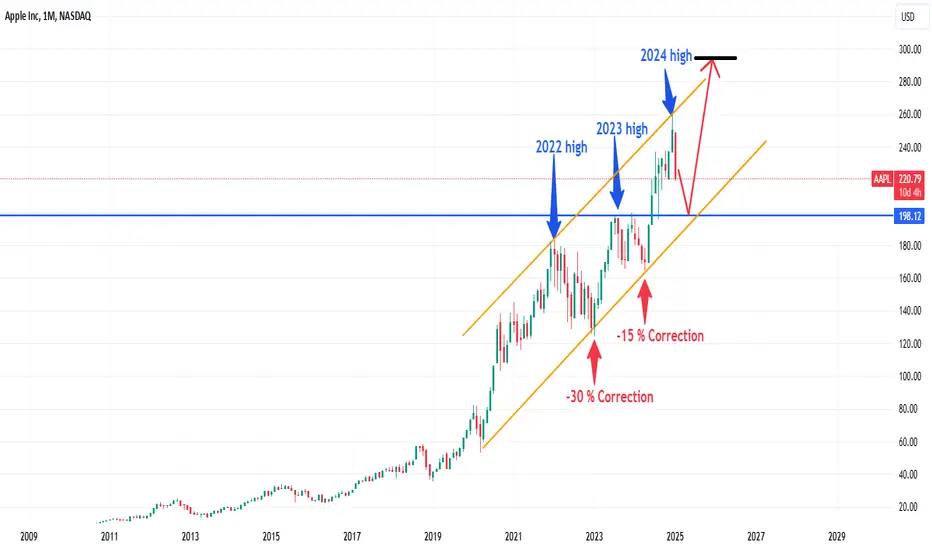
Offcourse the chart is self explanatory.
on daily timeframe where it touches the 200 SMA.
It means that the long term downtrend is gonna start.
Still a big no.... it has to touch the monthly resistance around 200 area.
Dear Traders, Go away and check for another mind.
as investor I already took my position at 240. Will take more position around 200 price.
Let's analyse it again in April-May 2025.
on daily timeframe where it touches the 200 SMA.
It means that the long term downtrend is gonna start.
Still a big no.... it has to touch the monthly resistance around 200 area.
Dear Traders, Go away and check for another mind.
as investor I already took my position at 240. Will take more position around 200 price.
Let's analyse it again in April-May 2025.

כתב ויתור
המידע והפרסומים אינם מיועדים להיות, ואינם מהווים, ייעוץ או המלצה פיננסית, השקעתית, מסחרית או מכל סוג אחר המסופקת או מאושרת על ידי TradingView. קרא עוד ב־תנאי השימוש.
כתב ויתור
המידע והפרסומים אינם מיועדים להיות, ואינם מהווים, ייעוץ או המלצה פיננסית, השקעתית, מסחרית או מכל סוג אחר המסופקת או מאושרת על ידי TradingView. קרא עוד ב־תנאי השימוש.