
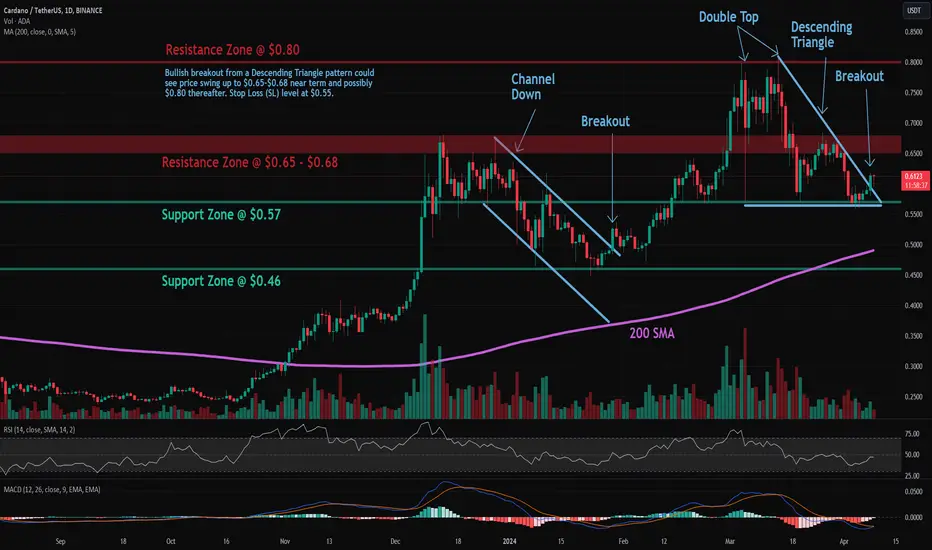
Trade setup: Trends are mixed but long-term still appears in an Uptrend with Higher Highs and Higher Lows. Bullish breakout from a Descending Triangle pattern could see price swing up to $0.65-$0.68 near term and possibly $0.80 thereafter. Stop Loss (SL) level at $0.55.
Pattern: Price is trading in a Descending Triangle pattern. Typically, a breakout will occur in the direction of the existing trend.
Trend: Downtrend on Short-Term basis, Neutral on Medium-Term basis and Uptrend on Long-Term basis.
Momentum is Mixed as MACD Line is below MACD Signal Line (Bearish) but RSI ~ 50 (Neutral). MACD Histogram bars are rising, which suggests that momentum could be nearing another upswing.
Support and Resistance: Nearest Support Zone is $0.57, then $0.46. The nearest Resistance Zone is $0.65 - $0.68, then $0.80.

כתב ויתור
המידע והפרסומים אינם מיועדים להיות, ואינם מהווים, ייעוץ או המלצה פיננסית, השקעתית, מסחרית או מכל סוג אחר המסופקת או מאושרת על ידי TradingView. קרא עוד ב־תנאי השימוש.
כתב ויתור
המידע והפרסומים אינם מיועדים להיות, ואינם מהווים, ייעוץ או המלצה פיננסית, השקעתית, מסחרית או מכל סוג אחר המסופקת או מאושרת על ידי TradingView. קרא עוד ב־תנאי השימוש.