
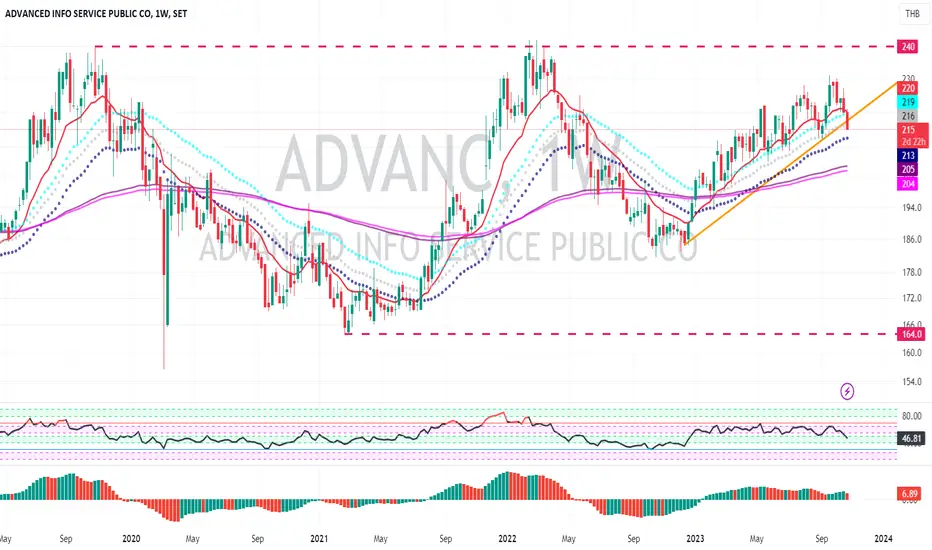
ADVANC , Week Chart , have been sideway in the trading range since 2020
and this week is the first week that price start reverse down and break out the trendline.
RSI and AO show weak momentum signal.
We should monitor how deep that this chart go down by using the daily chart to monitor more detail.
and this week is the first week that price start reverse down and break out the trendline.
RSI and AO show weak momentum signal.
We should monitor how deep that this chart go down by using the daily chart to monitor more detail.

Pragasit Thitaram, CEWA
כתב ויתור
המידע והפרסומים אינם מיועדים להיות, ואינם מהווים, ייעוץ או המלצה פיננסית, השקעתית, מסחרית או מכל סוג אחר המסופקת או מאושרת על ידי TradingView. קרא עוד ב־תנאי השימוש.
Pragasit Thitaram, CEWA
כתב ויתור
המידע והפרסומים אינם מיועדים להיות, ואינם מהווים, ייעוץ או המלצה פיננסית, השקעתית, מסחרית או מכל סוג אחר המסופקת או מאושרת על ידי TradingView. קרא עוד ב־תנאי השימוש.