שורט
A Corrective Mess
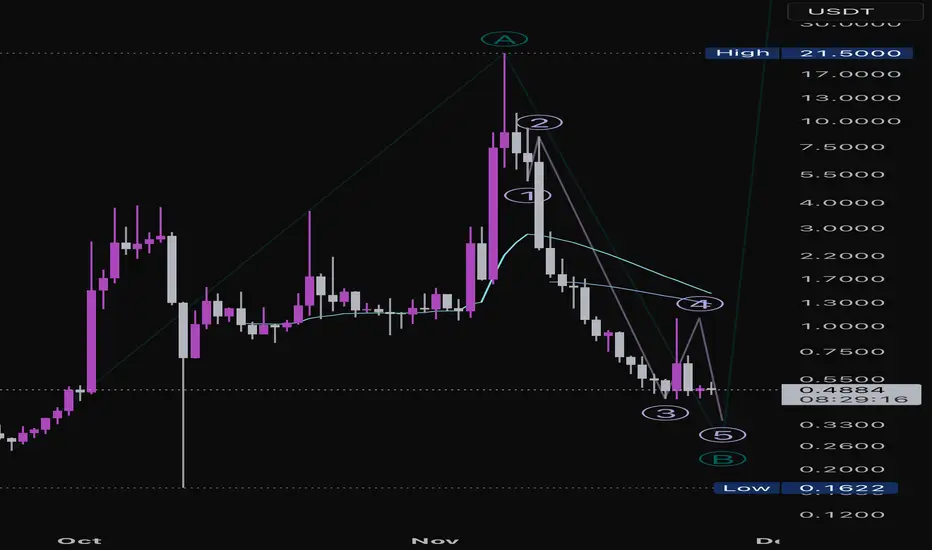
Hard to count this chart as anything but long-term bearish, but my best Elliot interpretation of AIA is that we could be in wave 4 of C of B to the downside. Very short term, we could see another [relatively] small rally to the 1.09-1.3ish area, but volume is low and further downside is expected with or without a C wave up. A break above the intraday high would be a first signal for a C wave, break below 0.439 for larger trend continuation.
הערה
Clarification: very short-term possibility is Wave c of 4, not Wave C of larger ABC count. Standard Fibonacci extension targets if we do get a Wave c of 4 rally: 1.09-1.49
כתב ויתור
המידע והפרסומים אינם מיועדים להיות, ואינם מהווים, ייעוץ או המלצה פיננסית, השקעתית, מסחרית או מכל סוג אחר המסופקת או מאושרת על ידי TradingView. קרא עוד ב־תנאי השימוש.
כתב ויתור
המידע והפרסומים אינם מיועדים להיות, ואינם מהווים, ייעוץ או המלצה פיננסית, השקעתית, מסחרית או מכל סוג אחר המסופקת או מאושרת על ידי TradingView. קרא עוד ב־תנאי השימוש.