
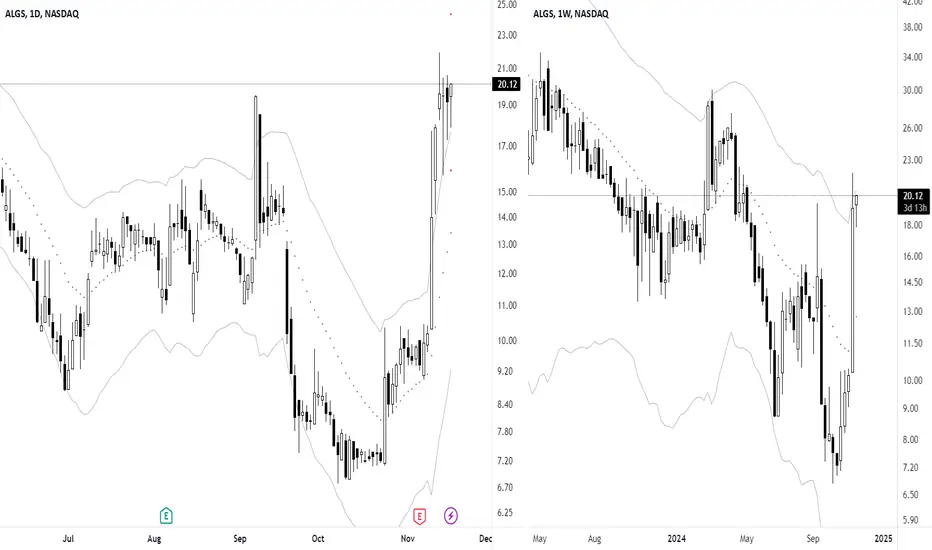
When stock showed up in screener showed a bullish continuation pattern on daily timeframe and a potential failure test / pullback on the higher timeframe downtrend, a bit near mean but was added to watchlist.
Execution chart.
Trade Overview
• Structure: Bullish Continuation (D)
• Position: Near Mean (D)
• Entry Trigger: Breakout (D)
Entry Details
• Entry Price: 11.13
• Stop Price: 9.38
• Target Price: 12.96
• Expected Risk/Reward: 1.05R
Exit Strategy
• Exit Price: 14.47 / 1.91R

Technical Trading: Research and Application
stockleave.com/
stockleave.com/
כתב ויתור
המידע והפרסומים אינם מיועדים להיות, ואינם מהווים, ייעוץ או המלצה פיננסית, השקעתית, מסחרית או מכל סוג אחר המסופקת או מאושרת על ידי TradingView. קרא עוד ב־תנאי השימוש.
Technical Trading: Research and Application
stockleave.com/
stockleave.com/
כתב ויתור
המידע והפרסומים אינם מיועדים להיות, ואינם מהווים, ייעוץ או המלצה פיננסית, השקעתית, מסחרית או מכל סוג אחר המסופקת או מאושרת על ידי TradingView. קרא עוד ב־תנאי השימוש.