
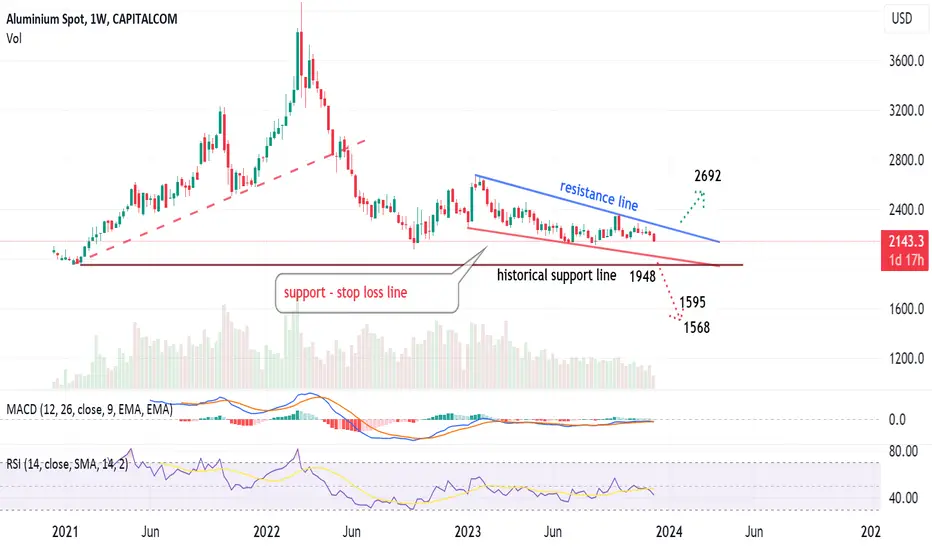
Weekly chart, Aluminum is showing negative indicators RSI and MACD. It seems the price is testing down the support line, then -may be- the historical support line.
Below that level, price can easily go to 1595 and 1568
Above resistance, the target is 2692
Below that level, price can easily go to 1595 and 1568
Above resistance, the target is 2692
עסקה פעילה
Aluminium price crossed the resistance line upwards, and activated the target
כתב ויתור
המידע והפרסומים אינם מיועדים להיות, ואינם מהווים, ייעוץ או המלצה פיננסית, השקעתית, מסחרית או מכל סוג אחר המסופקת או מאושרת על ידי TradingView. קרא עוד ב־תנאי השימוש.
כתב ויתור
המידע והפרסומים אינם מיועדים להיות, ואינם מהווים, ייעוץ או המלצה פיננסית, השקעתית, מסחרית או מכל סוג אחר המסופקת או מאושרת על ידי TradingView. קרא עוד ב־תנאי השימוש.