
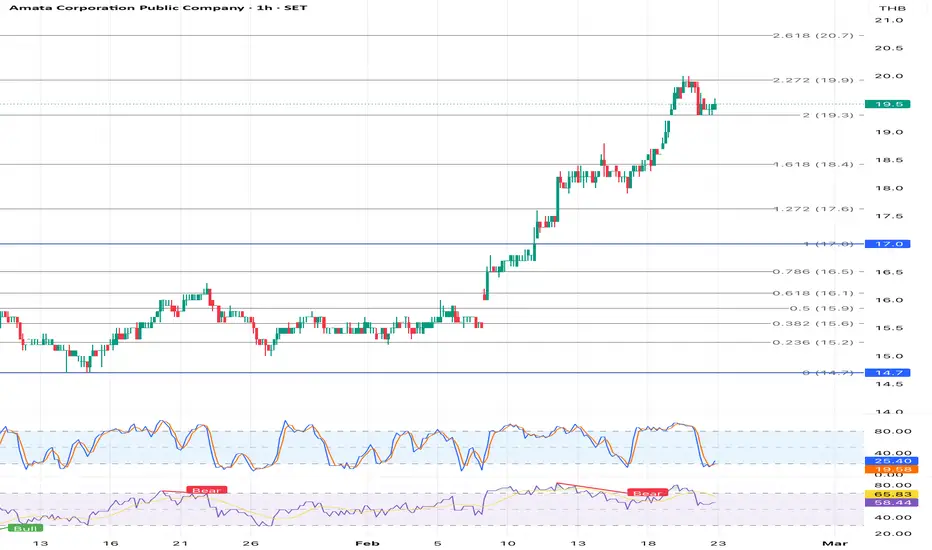
On the 1H chart, AMATA shows a strong bullish impulse after breaking above 17.0 (Fib 1.0 / blue line). Price then followed the Fibonacci Extension targets and is currently seeing profit-taking, resulting in a short-term pullback and consolidation near key levels.
Technical Overview
• The primary trend remains bullish (clear Higher High / Higher Low structure after the 17.0 breakout).
• In the short term, price is in a pullback / consolidation phase after an extended rally.
Key Price Zones (Based on the Fib Extensions on the chart)
Major Supports
• 19.3 (Fib 2.0): Key pivot zone — holding above keeps the bullish continuation bias intact.
• 18.4 (Fib 1.618): If 19.3 fails, this is the next likely retest area.
• 17.6 (Fib 1.272) and 17.0 (Fib 1.0): Structural supports from the larger breakout leg.
Major Resistances
• 20.0–20.x: Prior swing high / supply zone (needs a clean break to continue toward new highs).
Price Action Scenarios
• Bullish continuation: If price holds above 19.3 and breaks the local consolidation to the upside, it can retest 20.0–20.x and potentially print a new high.
• Deeper pullback: If price breaks below 19.3 decisively, watch for a reaction at 18.4, then 17.6 / 17.0 if selling pressure persists.
Summary: The uptrend structure remains intact as long as price stays above 19.3, but a clean breakdown below that level increases the odds of a pullback toward 18.4.
Pine Script®
Technical Overview
• The primary trend remains bullish (clear Higher High / Higher Low structure after the 17.0 breakout).
• In the short term, price is in a pullback / consolidation phase after an extended rally.
Key Price Zones (Based on the Fib Extensions on the chart)
Major Supports
• 19.3 (Fib 2.0): Key pivot zone — holding above keeps the bullish continuation bias intact.
• 18.4 (Fib 1.618): If 19.3 fails, this is the next likely retest area.
• 17.6 (Fib 1.272) and 17.0 (Fib 1.0): Structural supports from the larger breakout leg.
Major Resistances
• 20.0–20.x: Prior swing high / supply zone (needs a clean break to continue toward new highs).
Price Action Scenarios
• Bullish continuation: If price holds above 19.3 and breaks the local consolidation to the upside, it can retest 20.0–20.x and potentially print a new high.
• Deeper pullback: If price breaks below 19.3 decisively, watch for a reaction at 18.4, then 17.6 / 17.0 if selling pressure persists.
Summary: The uptrend structure remains intact as long as price stays above 19.3, but a clean breakdown below that level increases the odds of a pullback toward 18.4.

כתב ויתור
המידע והפרסומים אינם מיועדים להיות, ואינם מהווים, ייעוץ או המלצה פיננסית, השקעתית, מסחרית או מכל סוג אחר המסופקת או מאושרת על ידי TradingView. קרא עוד ב־תנאי השימוש.
כתב ויתור
המידע והפרסומים אינם מיועדים להיות, ואינם מהווים, ייעוץ או המלצה פיננסית, השקעתית, מסחרית או מכל סוג אחר המסופקת או מאושרת על ידי TradingView. קרא עוד ב־תנאי השימוש.