
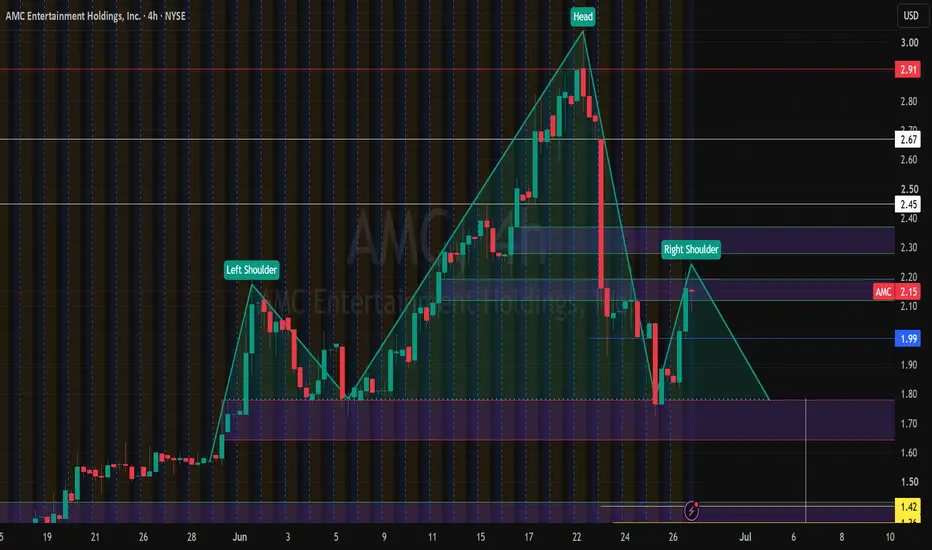
The Head & Shoulders pattern is a key chart formation in technical analysis that signals a potential market reversal from an uptrend to a downtrend. It consists of three peaks: a higher middle peak (the "head") flanked by two lower peaks (the "shoulders") and a support line called the "neckline." Traders use this pattern to:
Identify Reversals: Signals a shift from bullish to bearish trends.
Set Entry Points: A break below the neckline indicates a trading opportunity.
Manage Risk: Stop-loss orders are placed above the shoulders or head.
Estimate Targets: Pattern height helps calculate potential price moves.
Identify Reversals: Signals a shift from bullish to bearish trends.
Set Entry Points: A break below the neckline indicates a trading opportunity.
Manage Risk: Stop-loss orders are placed above the shoulders or head.
Estimate Targets: Pattern height helps calculate potential price moves.

LUIS
כתב ויתור
המידע והפרסומים אינם מיועדים להיות, ואינם מהווים, ייעוץ או המלצה פיננסית, השקעתית, מסחרית או מכל סוג אחר המסופקת או מאושרת על ידי TradingView. קרא עוד ב־תנאי השימוש.
LUIS
כתב ויתור
המידע והפרסומים אינם מיועדים להיות, ואינם מהווים, ייעוץ או המלצה פיננסית, השקעתית, מסחרית או מכל סוג אחר המסופקת או מאושרת על ידי TradingView. קרא עוד ב־תנאי השימוש.