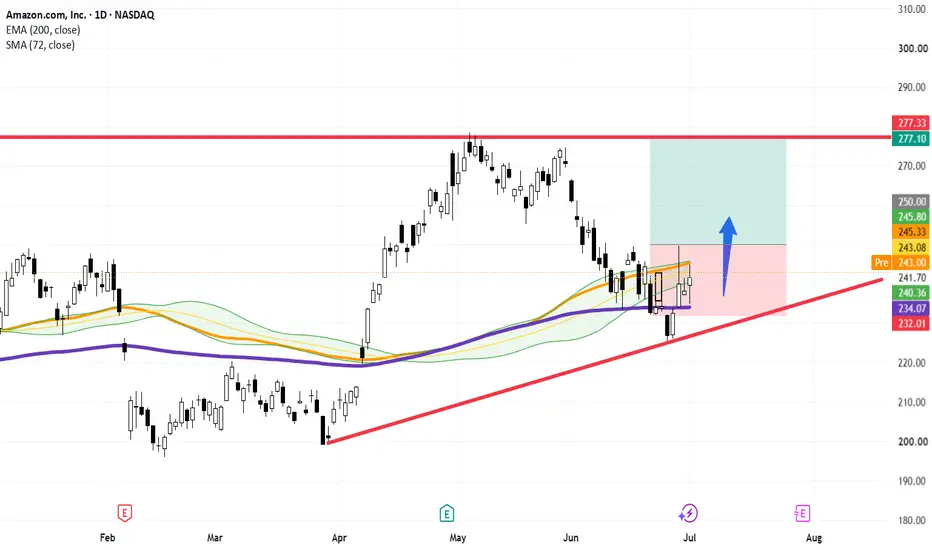
Amazon ( AMZN) Daily: Clean Rebound Off 200-EMA Sets Up High-Asymmetry Breakout Play Above $250
### 🇺🇸 Amazon.com, Inc. (AMZN - NASDAQ) Daily Technical Study (Ref: AMZN_2026-07-02_09-05-08.png)
We are analyzing a high-probability trend-continuation setup on Amazon (AMZN) on the Daily (1D) chart. The asset has successfully completed a healthy multi-week mean reversion phase, presenting a highly asymmetric risk-to-reward matrix for systematic trend followers.
---
### 🔍 Technical Architecture & Core Observations:
1. **The Moving Average Confluence Floor:** After rotating lower from its local highs, AMZN found precision institutional support right at the 200-period Exponential Moving Average (EMA 200 - purple line at $234.07). The defensive behavior and bullish candle absorption at this key structural baseline confirm that the macro uptrend remains intact.
2. **The Liquidity Pocket:** The current price consolidation above the dynamic support zone represents strong re-accumulation. Weak hands have been shaken out, and order flow is shifting back to the buy-side.
---
### 🎯 The Execution Strategy & Trigger Matrix
To maximize win-probability, our operational model applies strict execution discipline rather than chasing the immediate bottom:
* **The Breakout Trigger ($250.00):** We are waiting for a definitive daily close above the **$250.00** psychological and structural level. A clean breakout here clears the local descending overhead supply, printing a confirmed higher low and triggering an aggressive wave of momentum buyers.
* **Risk Management (Stop Loss):** Capital preservation is anchored just beneath the structural safety net. The invalidation level (Stop Loss) is strictly positioned below the EMA 200 and the recent swing low, around the **$232.00** area.
* **The Target Matrix:** The primary objective of this structural expansion leg is a complete retest and potential breach of the macro swing high at **$277.10**, offering an excellent risk-reward ratio.
---
### 📊 Tactical Summary:
* **Bias:** Bullish (Conditional on Breakout)
* **Entry Trigger:** Confirmed daily breakout/close above **$250.00**
* **Stop Loss:** Below dynamic support at **$232.00**
* **Primary Target:** Macro structural peak at **$277.10**
---
📊 **ChartPro Data** *Trend Continuity Models, Institutional S/R Clusters & Systematic Risk Sourcing.*
⚠️ **Disclaimer:** For educational and informational purposes only. This technical study represents a personal trading model and does not constitute financial or investment advice.
AMZN) Daily: Clean Rebound Off 200-EMA Sets Up High-Asymmetry Breakout Play Above $250### 🇺🇸 Amazon.com, Inc. (
AMZN - NASDAQ) Daily Technical Study (Ref: AMZN_2026-07-02_09-05-08.png)We are analyzing a high-probability trend-continuation setup on Amazon (
AMZN) on the Daily (1D) chart. The asset has successfully completed a healthy multi-week mean reversion phase, presenting a highly asymmetric risk-to-reward matrix for systematic trend followers.---
### 🔍 Technical Architecture & Core Observations:
1. **The Moving Average Confluence Floor:** After rotating lower from its local highs, AMZN found precision institutional support right at the 200-period Exponential Moving Average (EMA 200 - purple line at $234.07). The defensive behavior and bullish candle absorption at this key structural baseline confirm that the macro uptrend remains intact.
2. **The Liquidity Pocket:** The current price consolidation above the dynamic support zone represents strong re-accumulation. Weak hands have been shaken out, and order flow is shifting back to the buy-side.
---
### 🎯 The Execution Strategy & Trigger Matrix
To maximize win-probability, our operational model applies strict execution discipline rather than chasing the immediate bottom:
* **The Breakout Trigger ($250.00):** We are waiting for a definitive daily close above the **$250.00** psychological and structural level. A clean breakout here clears the local descending overhead supply, printing a confirmed higher low and triggering an aggressive wave of momentum buyers.
* **Risk Management (Stop Loss):** Capital preservation is anchored just beneath the structural safety net. The invalidation level (Stop Loss) is strictly positioned below the EMA 200 and the recent swing low, around the **$232.00** area.
* **The Target Matrix:** The primary objective of this structural expansion leg is a complete retest and potential breach of the macro swing high at **$277.10**, offering an excellent risk-reward ratio.
---
### 📊 Tactical Summary:
* **Bias:** Bullish (Conditional on Breakout)
* **Entry Trigger:** Confirmed daily breakout/close above **$250.00**
* **Stop Loss:** Below dynamic support at **$232.00**
* **Primary Target:** Macro structural peak at **$277.10**
---
📊 **ChartPro Data** *Trend Continuity Models, Institutional S/R Clusters & Systematic Risk Sourcing.*
⚠️ **Disclaimer:** For educational and informational purposes only. This technical study represents a personal trading model and does not constitute financial or investment advice.

כתב ויתור
המידע והפרסומים אינם מיועדים להיות, ואינם מהווים, ייעוץ או המלצה פיננסית, השקעתית, מסחרית או מכל סוג אחר המסופקת או מאושרת על ידי TradingView. קרא עוד ב־תנאי השימוש.
כתב ויתור
המידע והפרסומים אינם מיועדים להיות, ואינם מהווים, ייעוץ או המלצה פיננסית, השקעתית, מסחרית או מכל סוג אחר המסופקת או מאושרת על ידי TradingView. קרא עוד ב־תנאי השימוש.