
Hello traders,
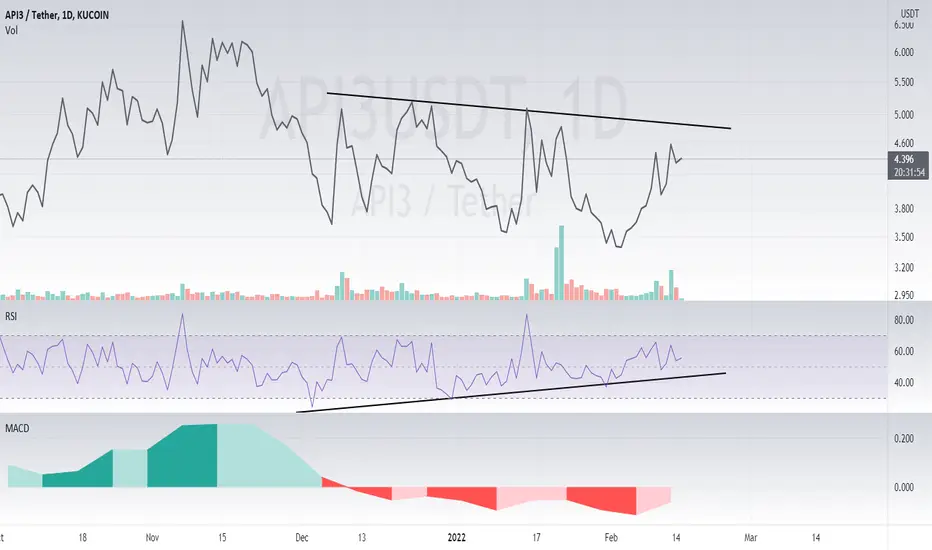
As you can see on the daily chart of API3, the price performance has been in a downtrend recently however the Momentum Oscillator (RSI) is showing a bullish divergence by presenting us with lower lows! The weekly MACD is also revealing a possible divergence to the green, I see a very low likely hood of it continuing to be red mainly due to the fact MACD's come in swings of 3, which we have already experienced.
Safe trading,
-Pulkanator
As you can see on the daily chart of API3, the price performance has been in a downtrend recently however the Momentum Oscillator (RSI) is showing a bullish divergence by presenting us with lower lows! The weekly MACD is also revealing a possible divergence to the green, I see a very low likely hood of it continuing to be red mainly due to the fact MACD's come in swings of 3, which we have already experienced.
Safe trading,
-Pulkanator

כתב ויתור
המידע והפרסומים אינם מיועדים להיות, ואינם מהווים, ייעוץ או המלצה פיננסית, השקעתית, מסחרית או מכל סוג אחר המסופקת או מאושרת על ידי TradingView. קרא עוד ב־תנאי השימוש.
כתב ויתור
המידע והפרסומים אינם מיועדים להיות, ואינם מהווים, ייעוץ או המלצה פיננסית, השקעתית, מסחרית או מכל סוג אחר המסופקת או מאושרת על ידי TradingView. קרא עוד ב־תנאי השימוש.