
🔎 Current Price Snapshot
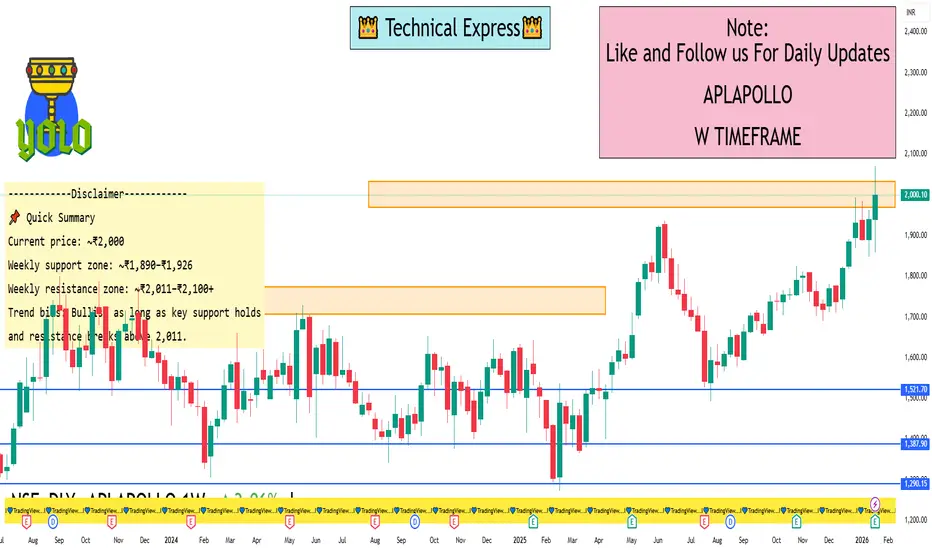
🟢 Last close: ₹2,000.10 (23 Jan 2026) — near a 52-week high zone.
📉 Weekly Technical Levels (1-Week Time Frame)
🧱 Support Levels (Key Floors)
These are levels where price is likely to find buying interest if the price pulls back:
S1: ~₹1,913 – ₹1,926 — first strong support band.
S2: ~₹1,890 – ₹1,911 — secondary support base from pivot structure.
S3: ~₹1,850+ — deeper support from broader weekly structure and previous pivot base.
Note: Above ~₹1,890 zone is a key defence level in weekly charts — losing this could signal short-term weakness.
📈 Resistance Levels (Key Ceilings)
These are weekly upside barriers where price may struggle initially:
R1: ~₹2,011 – ₹2,050 — first resistance cluster from weekly pivots.
R2: ~₹2,080 – ₹2,100 — next overhead resistance from extended levels.
R3: ~₹2,128 – ₹2,140+ — broader technical pivot resistance.
Bullish bias continues only above ~₹2,011–₹2,050.
📌 Weekly Trading Scenarios
🟢 Bullish Case (Upside)
Trigger: Sustained weekly close above ~₹2,011–₹2,050
Targets:
→ Short-term: ~₹2,080–₹2,100
→ Extended: ~₹2,120–₹2,140+
Outlook: Strength above R1 opens path to higher weekly highs.
🔵 Neutral / Range
Range: ₹1,890–₹2,050
Behavior: Price oscillates as buyers/sellers balance.
🔴 Bearish Case (Downside)
Trigger: Weekly close below ~₹1,890
Downside key support: ~₹1,850+
Outlook: Weekly momentum weakens if key support breaks.
🟢 Last close: ₹2,000.10 (23 Jan 2026) — near a 52-week high zone.
📉 Weekly Technical Levels (1-Week Time Frame)
🧱 Support Levels (Key Floors)
These are levels where price is likely to find buying interest if the price pulls back:
S1: ~₹1,913 – ₹1,926 — first strong support band.
S2: ~₹1,890 – ₹1,911 — secondary support base from pivot structure.
S3: ~₹1,850+ — deeper support from broader weekly structure and previous pivot base.
Note: Above ~₹1,890 zone is a key defence level in weekly charts — losing this could signal short-term weakness.
📈 Resistance Levels (Key Ceilings)
These are weekly upside barriers where price may struggle initially:
R1: ~₹2,011 – ₹2,050 — first resistance cluster from weekly pivots.
R2: ~₹2,080 – ₹2,100 — next overhead resistance from extended levels.
R3: ~₹2,128 – ₹2,140+ — broader technical pivot resistance.
Bullish bias continues only above ~₹2,011–₹2,050.
📌 Weekly Trading Scenarios
🟢 Bullish Case (Upside)
Trigger: Sustained weekly close above ~₹2,011–₹2,050
Targets:
→ Short-term: ~₹2,080–₹2,100
→ Extended: ~₹2,120–₹2,140+
Outlook: Strength above R1 opens path to higher weekly highs.
🔵 Neutral / Range
Range: ₹1,890–₹2,050
Behavior: Price oscillates as buyers/sellers balance.
🔴 Bearish Case (Downside)
Trigger: Weekly close below ~₹1,890
Downside key support: ~₹1,850+
Outlook: Weekly momentum weakens if key support breaks.

פרסומים קשורים
כתב ויתור
המידע והפרסומים אינם מיועדים להיות, ואינם מהווים, ייעוץ או המלצה פיננסית, השקעתית, מסחרית או מכל סוג אחר המסופקת או מאושרת על ידי TradingView. קרא עוד ב־תנאי השימוש.
פרסומים קשורים
כתב ויתור
המידע והפרסומים אינם מיועדים להיות, ואינם מהווים, ייעוץ או המלצה פיננסית, השקעתית, מסחרית או מכל סוג אחר המסופקת או מאושרת על ידי TradingView. קרא עוד ב־תנאי השימוש.