
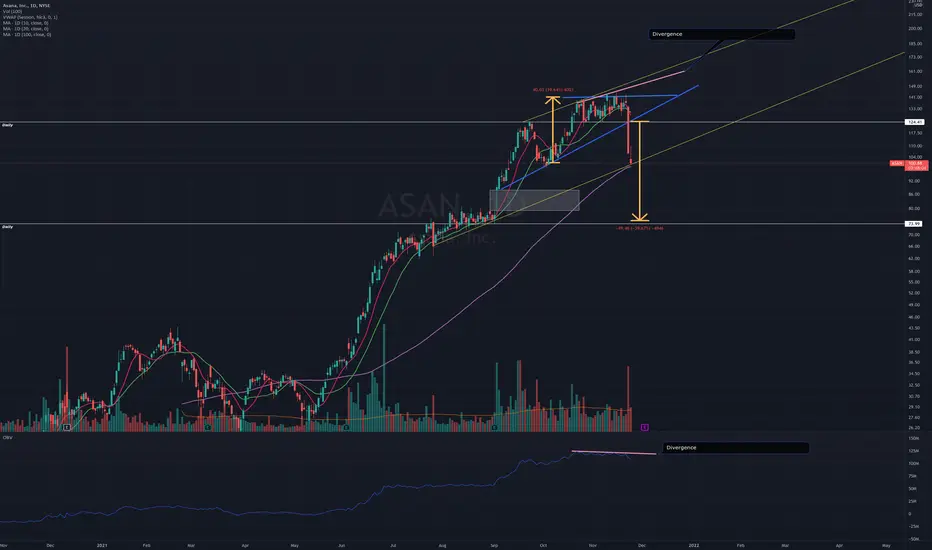
Bearish setup on daily chart. Let me know what you all see.
ASAN Short - Bearish setup
* MA 20/10 crossover
* Ascending triangle breakdown on high volume
* Bearish Divergence on OBV indicator
- Potential area to analyze
Break of trendline support which would also be a confluence area for MA100
Entry - Im thinking the closed below Trendline $98-99
Profit area - Test of gap or gap fill ($ 87 - 79) or implied move of pattern $74.
ASAN Short - Bearish setup
* MA 20/10 crossover
* Ascending triangle breakdown on high volume
* Bearish Divergence on OBV indicator
- Potential area to analyze
Break of trendline support which would also be a confluence area for MA100
Entry - Im thinking the closed below Trendline $98-99
Profit area - Test of gap or gap fill ($ 87 - 79) or implied move of pattern $74.

כתב ויתור
המידע והפרסומים אינם מיועדים להיות, ואינם מהווים, ייעוץ או המלצה פיננסית, השקעתית, מסחרית או מכל סוג אחר המסופקת או מאושרת על ידי TradingView. קרא עוד ב־תנאי השימוש.
כתב ויתור
המידע והפרסומים אינם מיועדים להיות, ואינם מהווים, ייעוץ או המלצה פיננסית, השקעתית, מסחרית או מכל סוג אחר המסופקת או מאושרת על ידי TradingView. קרא עוד ב־תנאי השימוש.