
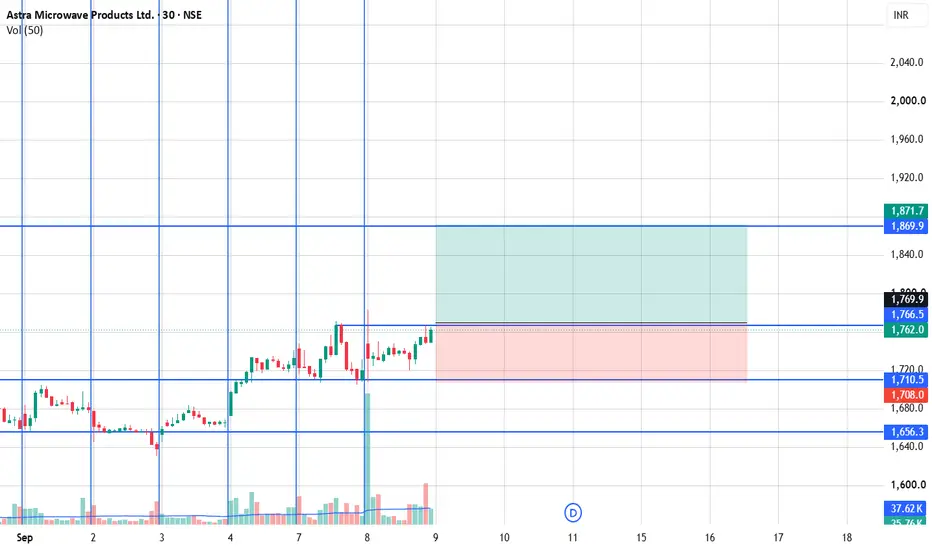
This is Astra Microwave – 30-minute chart. I’ll explain the Buy/Sell setup
Current situation on your chart
Current price is around ₹1,762, so it is sitting between ₹1,710 support and ₹1,870 resistance.
That means the chart is currently in a range, rather than giving a clean breakout/breakdown signal.
Simple rule:
Below ₹1,710 → bearish structure
₹1,710–₹1,870 → range / wait for confirmation
Above ₹1,870 → bullish breakout structure

כתב ויתור
המידע והפרסומים אינם מיועדים להיות, ואינם מהווים, ייעוץ או המלצה פיננסית, השקעתית, מסחרית או מכל סוג אחר המסופקת או מאושרת על ידי TradingView. קרא עוד ב־תנאי השימוש.
כתב ויתור
המידע והפרסומים אינם מיועדים להיות, ואינם מהווים, ייעוץ או המלצה פיננסית, השקעתית, מסחרית או מכל סוג אחר המסופקת או מאושרת על ידי TradingView. קרא עוד ב־תנאי השימוש.