

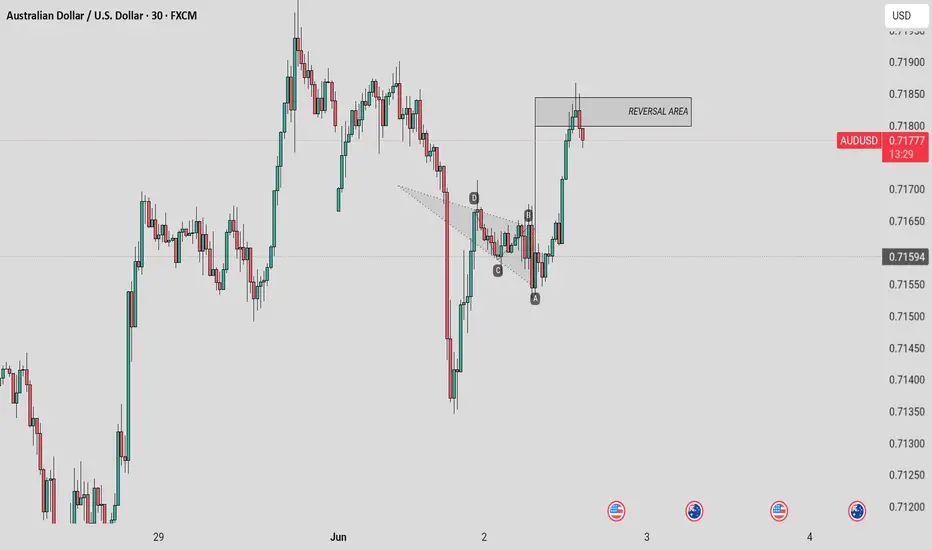
1. Harmonic Pattern: The chart illustrates a harmonic pattern characterized by points labeled A, B, C, and D. These points indicate a specific price movement structure that traders often use to identify potential reversal zones in the market.
2. Price Action: Following point D of the harmonic pattern, the price has begun to move upwards, suggesting a bullish trend or potential upward momentum in the AUDUSD pair.
3. Reversal Area: A shaded rectangle is marked as the "REVERSAL AREA" around the 0.71800 level. This area is highlighted as a potential zone where the price may encounter resistance, indicating that traders might expect a reversal or pullback in the upward trend.
4. Technical Analysis: The chart reflects a technical analysis approach, utilizing patterns and price action to make trading decisions. Traders may use this information to enter or exit positions based on anticipated market behavior.
Overall, the chart serves as a tool for traders looking to analyze the AUDUSD currency pair's movements and identify potential trading opportunities based on established patterns and market dynamics.

כתב ויתור
המידע והפרסומים אינם מיועדים להיות, ואינם מהווים, ייעוץ או המלצה פיננסית, השקעתית, מסחרית או מכל סוג אחר המסופקת או מאושרת על ידי TradingView. קרא עוד ב־תנאי השימוש.
כתב ויתור
המידע והפרסומים אינם מיועדים להיות, ואינם מהווים, ייעוץ או המלצה פיננסית, השקעתית, מסחרית או מכל סוג אחר המסופקת או מאושרת על ידי TradingView. קרא עוד ב־תנאי השימוש.