
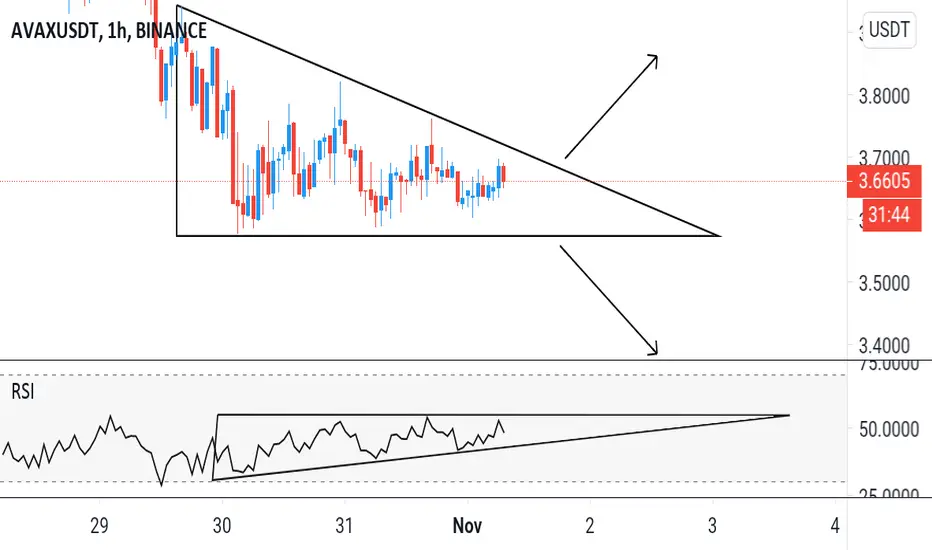
AVAXUSDT is printing a descending triangle chart pattern.
We could see a breakout above the inclined resistance ⬆️ or a breakdown below the horizontal support ⬇️.
RSI pattern breakout could be a confirmation.
We could see a breakout above the inclined resistance ⬆️ or a breakdown below the horizontal support ⬇️.
RSI pattern breakout could be a confirmation.

כתב ויתור
המידע והפרסומים אינם מיועדים להיות, ואינם מהווים, ייעוץ או המלצה פיננסית, השקעתית, מסחרית או מכל סוג אחר המסופקת או מאושרת על ידי TradingView. קרא עוד ב־תנאי השימוש.
כתב ויתור
המידע והפרסומים אינם מיועדים להיות, ואינם מהווים, ייעוץ או המלצה פיננסית, השקעתית, מסחרית או מכל סוג אחר המסופקת או מאושרת על ידי TradingView. קרא עוד ב־תנאי השימוש.